
8.3 KiB
Name
基于EMA指标的趋势追踪策略EMA-Oscillator-Trend-Following-Strategy
Author
ChaoZhang
Strategy Description
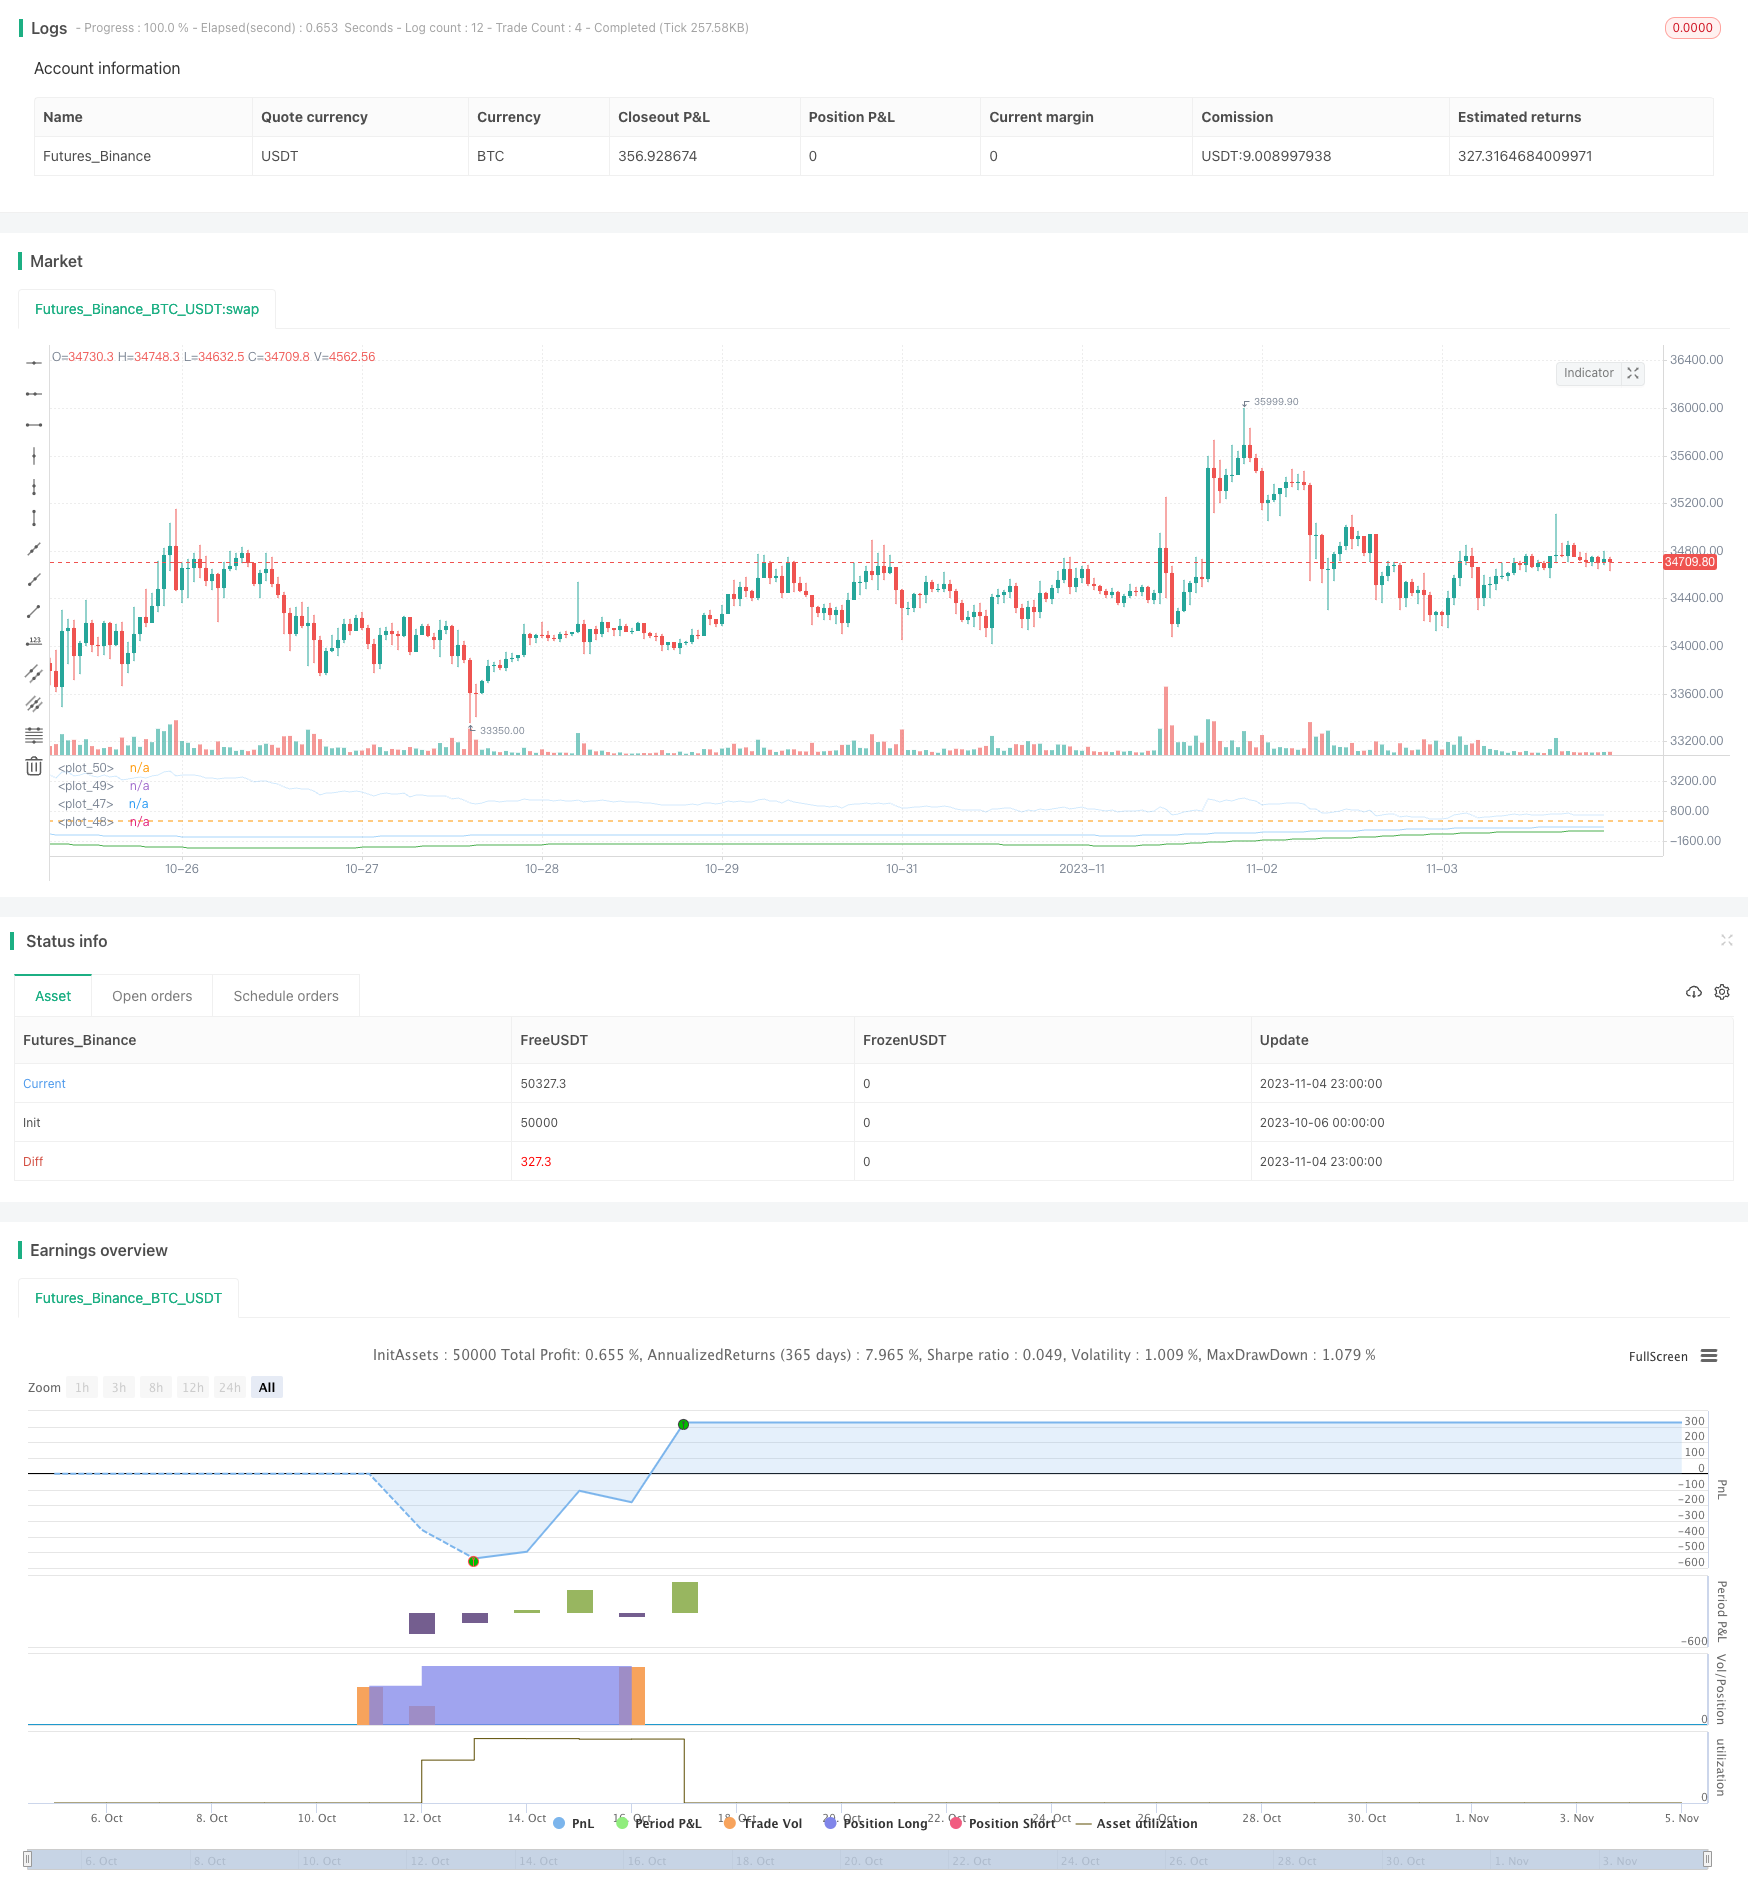 [trans]
概述
该策略利用EMA指标识别股票价格趋势,并结合标准差计算买入卖出信号,实现追踪趋势的交易策略。主要思想是计算当前价格与EMA的差值,设定阈值买入。
策略原理
策略首先计算close价格与长度为ema_length的EMA的差值v。然后计算v的ema_length周期的标准差dev。再确定买入方向系数k,k为1表示买入看涨,k为-1表示买入看跌。然后计算买入信号阈值dev_limit,它是k乘以dev再乘以限制factor。当v越过dev_limit就产生买入信号。退出信号是v回穿0轴。
该策略提供两种模式:
-
买入看跌,当v下穿负的dev_limit就买入,即追踪下跌趋势。
-
买入看涨,当v上穿正的dev_limit就买入,即追踪上涨趋势。
综上,该策略通过动态计算价格与EMA差值的标准差,设定买入阈值实现追踪趋势。factor参数控制买入信号的灵敏度。ema_length控制EMA周期。买入模式控制买入方向。
策略优势分析
该策略具有以下优势:
-
使用EMA指标识别价格趋势方向,EMA指标平滑价格,识别趋势效果好。
-
结合标准差计算动态阈值,相比固定阈值更能适应市场变化。
-
两种买入模式可以选择追踪上涨趋势或下跌趋势。
-
factor参数提供调整买入灵敏度的空间。ema_length参数可调整EMA周期优化参数。
-
策略逻辑清晰简单,容易理解和修改。
-
可灵活设置仓位管理,实现追涨跌趋势的积极策略。
风险分析
该策略也存在以下风险:
-
EMA指标存在滞后,可能错过趋势转折点。
-
依赖参数优化,如果参数设置不当,可能过于灵敏或迟钝。
-
追逐趋势带来的风险,如果趋势反转可能造成较大损失。
-
多空转换频繁造成交易频繁。
-
大幅震荡行情中信号频繁,交易费用成本增加。
针对这些风险,可以考虑加入止损策略控制风险,优化参数组合测试寻找最佳参数,加入过滤条件避免过于频繁交易等。
优化方向
该策略可以从以下方面进行优化:
-
测试不同EMA周期的参数效果,寻找最优EMA周期长度。
-
测试factor的不同取值,寻找最佳阈值灵敏度。
-
优化开仓仓位管理策略,比如随趋势加仓方式。
-
添加其他指标过滤,避免在震荡行情下出错交易。
-
增加止损策略控制单笔损失。
-
针对两个买入模式分别优化参数,寻找最佳参数组合。
-
研究趋势反转信号,设置关闭趋势追踪。
总结
该策略基于EMA识别趋势方向,并动态计算阈值产生买入卖出信号,实现对趋势的追踪。策略逻辑简单清晰,可灵活配置仓位管理积极追踪趋势。同时策略也存在一定风险,需要对参数组合进行优化测试,并辅以StopIteration损策略控制风险。该策略可作为学习指标结合应用、优化参数设置的良好案例。
||
Overview
This strategy uses the EMA indicator to identify price trends and combines standard deviation to calculate buy and sell signals for trend following trading. The main idea is to compute the difference between the close price and EMA, set a threshold to trigger orders.
Strategy Logic
The strategy first calculates the difference v between close price and EMA of length ema_length. Then it calculates the standard deviation dev of v over ema_length periods. Next it determines the direction coefficient k, with k=1 for long and k=-1 for short. The buy signal threshold dev_limit is calculated by k * dev * factor limit. When v crosses over dev_limit, a buy signal is triggered. The exit signal is when v crosses 0.
The strategy provides two modes:
-
Buy short, go long when v crosses below negative dev_limit, to follow a downtrend.
-
Buy long, go long when v crosses above positive dev_limit, to follow an uptrend.
In summary, the strategy dynamically calculates the standard deviation of the difference between price and EMA to set the threshold and follows trends. The factor controls the sensitivity of buy signals. ema_length determines the EMA period. The buy mode controls the order direction.
Advantage Analysis
The advantages of this strategy include:
-
EMA identifies trend direction well by smoothing prices.
-
Dynamic threshold based on standard deviation adapts better than fixed thresholds.
-
Two buy modes allow following uptrend or downtrend.
-
The factor provides flexibility in tuning buy sensitivity. ema_length allows EMA period optimization.
-
The logic is simple and easy to understand and modify.
-
Position sizing can be configured flexibly for aggressive trend following.
Risk Analysis
The risks of the strategy:
-
EMA has lag and may miss trend turning points.
-
It relies on parameter optimization. Improper settings lead to insufficient sensitivity or oversensitivity.
-
Trend following risks larger losses when trend reverses.
-
Frequent long/short switches increase trading frequency.
-
Frequent signals in ranging markets increase costs.
To address the risks, consider adding stop loss, optimizing parameters, adding filters to avoid overtrading, etc.
Optimization Directions
The strategy can be optimized by:
-
Testing different EMA periods to find the optimal length.
-
Testing different factor values to find the best sensitivity.
-
Optimizing position sizing strategies, e.g. pyramiding.
-
Adding filters to avoid wrong trades in choppy markets.
-
Incorporating stop loss to control single trade loss.
-
Optimizing parameters separately for the two buy modes.
-
Researching trend reversal signals to stop trend following.
Conclusion
The strategy identifies trends with EMA and generates dynamic threshold orders to follow trends. The logic is simple and clear. Position sizing can be aggressive for trend chasing. It has risks that need to be addressed through parameter optimization and stop loss. It serves as a good example to learn indicator combination and parameter tuning.
[/trans]
Strategy Arguments
| Argument | Default | Description |
|---|---|---|
| v_input_int_1 | 200 | Period |
| v_input_float_1 | 1.7 | Factor |
| v_input_string_1 | 0 | Model: Buy on enter to OverSell |
Source (PineScript)
/*backtest
start: 2023-10-06 00:00:00
end: 2023-11-05 00:00:00
period: 1h
basePeriod: 15m
exchanges: [{"eid":"Futures_Binance","currency":"BTC_USDT"}]
*/

// This source code is subject to the terms of the Mozilla Public License 2.0 at https://mozilla.org/MPL/2.0/
// © Azzrael

// Based on EMA and EMA Oscilator https://www.tradingview.com/script/qM9wm0PW-EMA-Oscilator-Azzrael/

// (EMA - close) + Std Dev + Factor = detecting oversell/overbuy
// Long only!
// Pyramiding - sometimes, depends on ...
// There 2 enter strategies in one script
// 1 - Classic, buy on entering to OverSell zone (more profitable ~> 70%)
// 2 - Crazy, buy on entering to OverBuy zone (catching trend and pyramiding, more net profit)
// Exit - crossing zero of (EMA - close)

//@version=5
strategy("STR:EMA Oscilator [Azzrael]", overlay=false,
 margin_long=100,
 margin_short=100,
 currency=currency.USD,
 default_qty_type=strategy.percent_of_equity,
 default_qty_value=30,
 pyramiding=3)

entry_name="Buy"

ema_length = input.int(200, "Period", minval=2, step=10)
limit = input.float(1.7, "Factor", minval=1, step=0.1, maxval=10)
dno = input.string(defval="Buy on enter to OverSell", title="Model", options=["Buy on enter to OverSell", "Buy on enter to OverBuy"]) == "Buy on enter to OverSell"

v = close - ta.ema(close, ema_length)
dev = ta.stdev(v, ema_length)
k = dno ? -1 : 1
dev_limit = k*dev*limit

cond_long = dno ? ta.crossunder(v, dev_limit) : ta.crossover(v, dev_limit)
cond_close = ta.cross(v, 0)

// dev visualization
sig_col = (dno and v <= dev_limit) or (not dno and v >= dev_limit) ? color.green : color.new(color.blue, 80)
plot(dev_limit, color=color.green)
plot(k*dev, color=color.new(color.blue, 60))
plot(v, color=sig_col )
hline(0)

// Make love not war
strategy.entry(entry_name, strategy.long, when=cond_long)
strategy.close(entry_name, when=cond_close)
Detail
https://www.fmz.com/strategy/431217
Last Modified
2023-11-06 09:53:27