
181 lines
8.7 KiB
Markdown
181 lines
8.7 KiB
Markdown
|
|
> Name
|
|
|
|
基于ATR的多重趋势跟踪策略与止盈止损优化系统-ATR-Based-Multi-Trend-Following-Strategy-with-Take-Profit-and-Stop-Loss-Optimization-System
|
|
|
|
> Author
|
|
|
|
ChaoZhang
|
|
|
|
> Strategy Description
|
|
|
|
|
|
|
|
[trans]
|
|
#### 概述
|
|
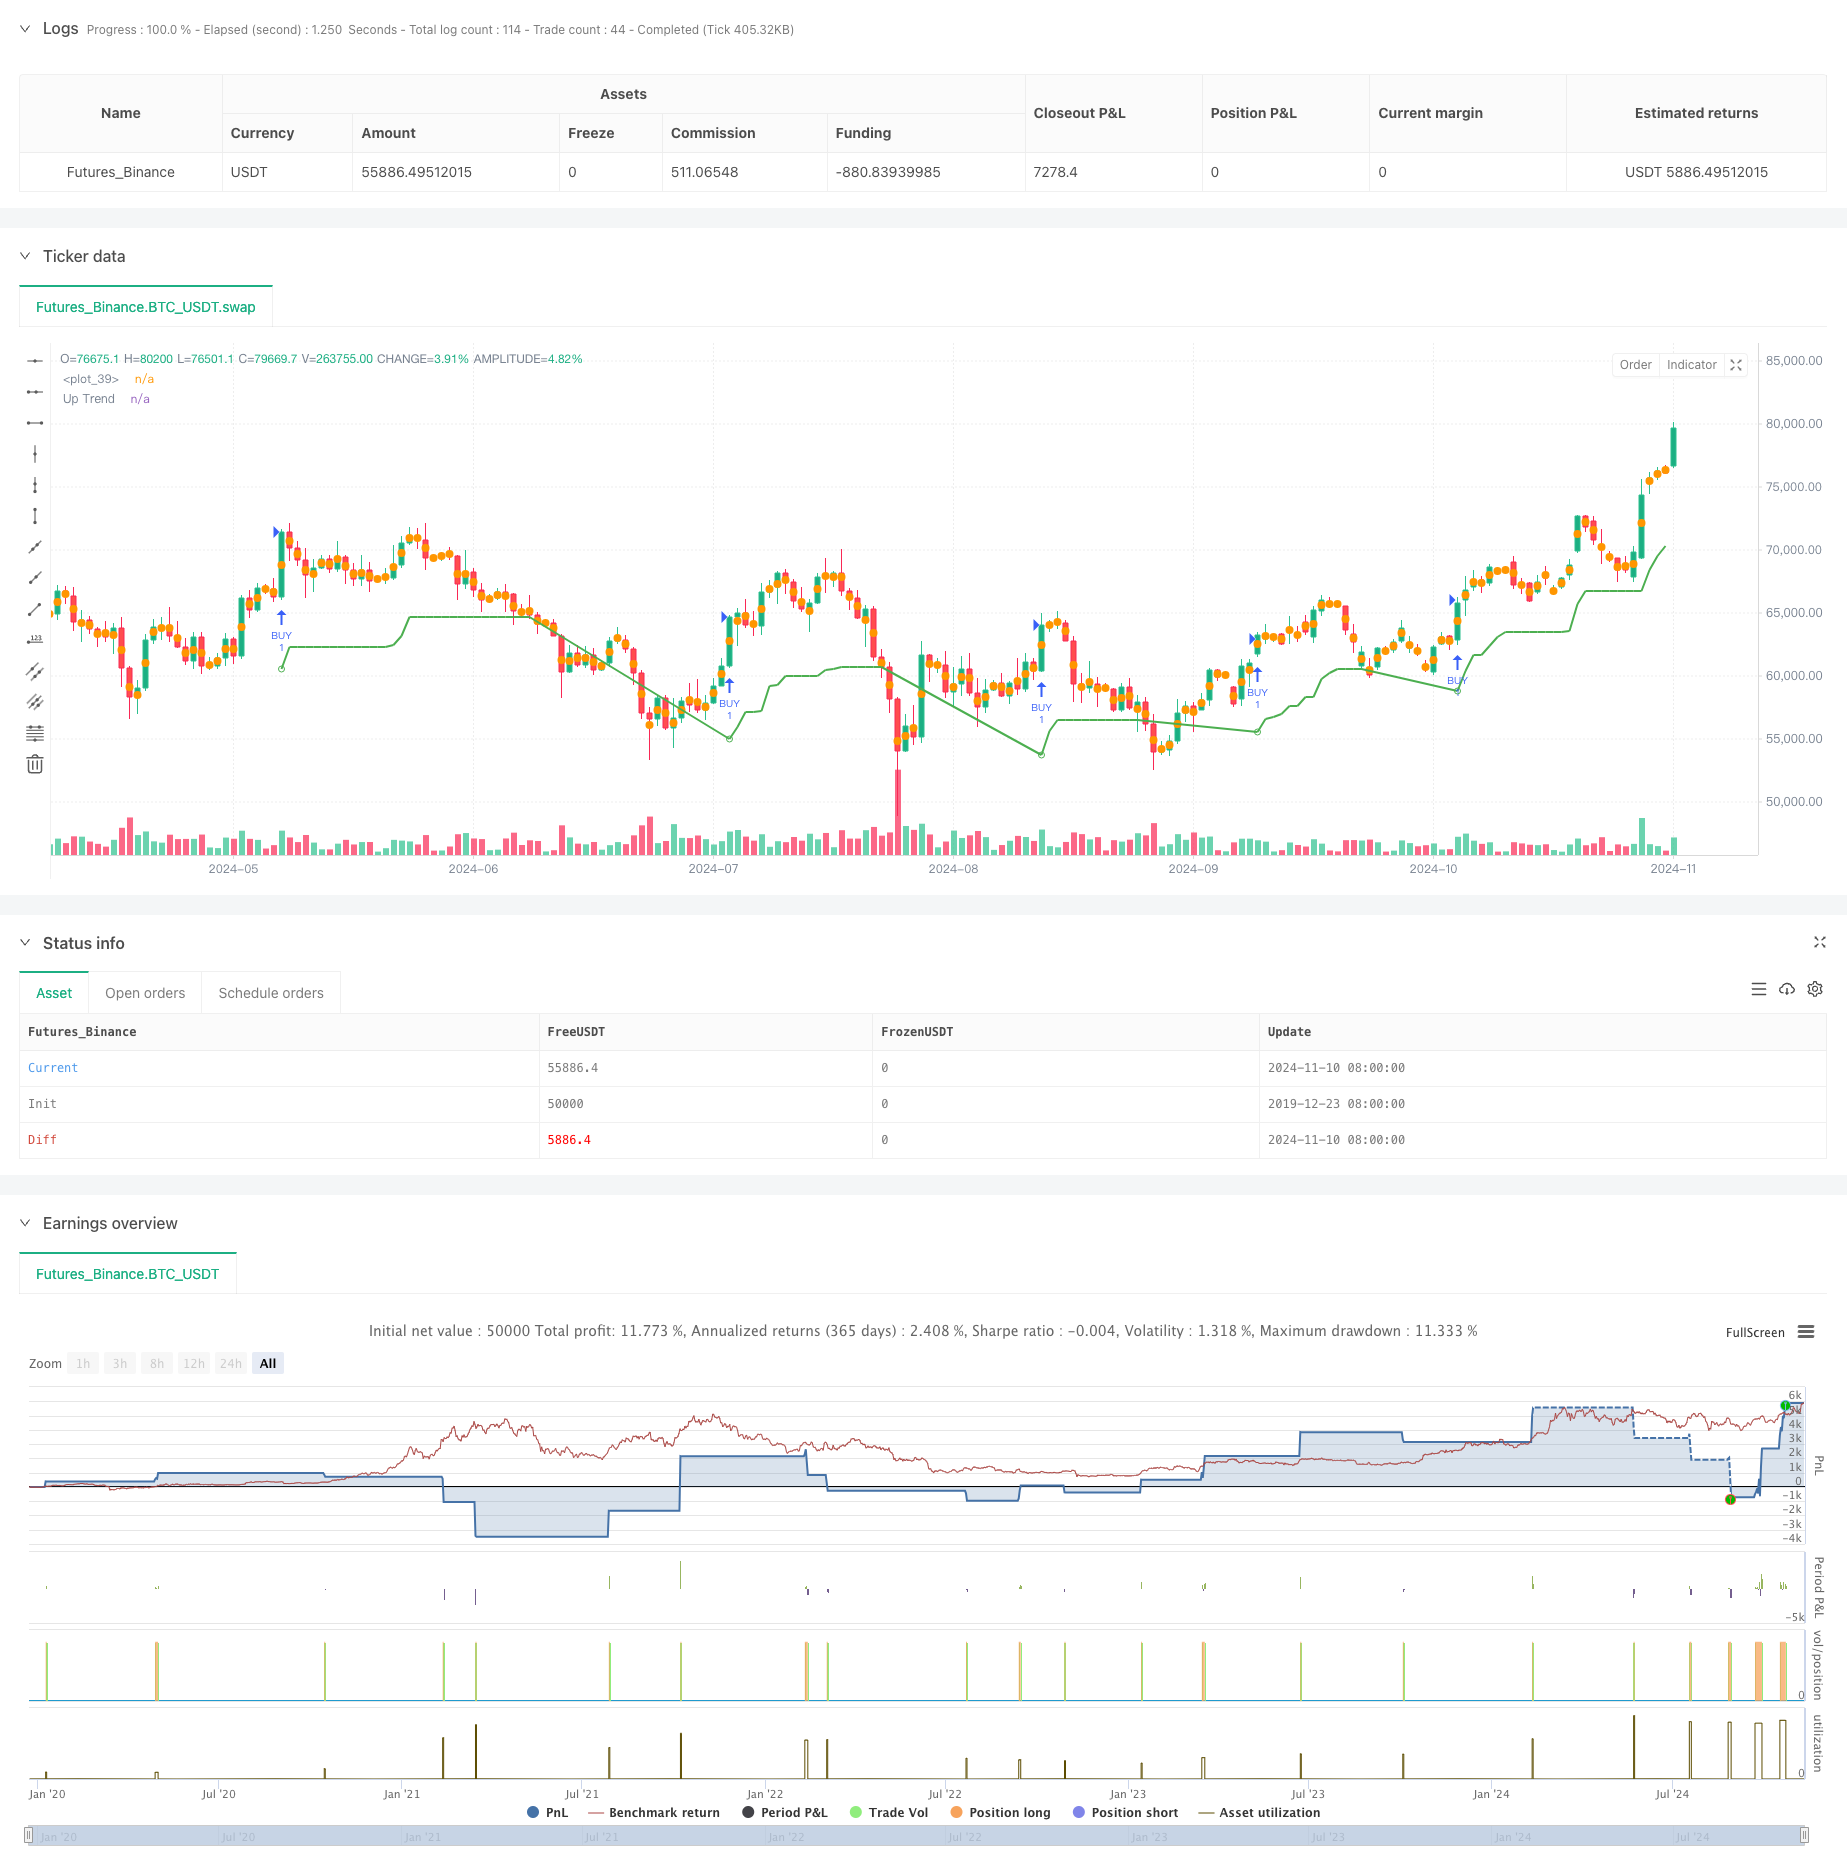
本策略是一个基于平均真实波幅(ATR)指标的趋势跟踪交易系统,通过动态计算价格波动范围来识别市场趋势,并结合自适应的止盈止损机制进行风险管理。策略采用多周期分析方法,通过ATR乘数动态调整交易信号的触发条件,实现对市场波动的精确跟踪。
|
|
|
|
#### 策略原理
|
|
策略核心基于ATR指标的动态计算,通过设定的周期参数(默认10期)计算市场真实波幅。使用ATR乘数(默认3.0)构建上下轨道线,当价格突破轨道线时触发交易信号。具体包括:
|
|
1. 使用SMA或标准ATR计算波幅基准
|
|
2. 动态计算上下轨道线作为趋势跟踪基准
|
|
3. 通过价格与轨道线的交叉确定趋势方向
|
|
4. 在趋势转换点位触发交易信号
|
|
5. 实现基于百分比的动态止盈止损系统
|
|
|
|
#### 策略优势
|
|
1. 自适应性强:通过ATR动态调整对市场波动的反应
|
|
2. 风险可控:内置百分比止盈止损机制,有效控制每笔交易风险
|
|
3. 参数灵活:关键参数如ATR周期、乘数等可根据市场特征调整
|
|
4. 视觉清晰:提供完善的图形界面,包括趋势标记和信号提示
|
|
5. 时间管理:支持自定义交易时间窗口,提高策略适用性
|
|
|
|
#### 策略风险
|
|
1. 趋势反转风险:在震荡市场可能产生频繁假信号
|
|
2. 参数敏感性:ATR周期和乘数的选择对策略表现影响较大
|
|
3. 市场环境依赖:在高波动期间可能出现滑点较大的情况
|
|
4. 止损设置:固定百分比止损可能不适合所有市场条件
|
|
|
|
#### 策略优化方向
|
|
1. 引入多重时间框架分析,提高趋势判断准确性
|
|
2. 添加成交量指标确认,增强信号可靠性
|
|
3. 开发自适应止盈止损机制,根据市场波动动态调整
|
|
4. 增加趋势强度过滤器,减少假信号
|
|
5. 结合波动率指标优化入场时机
|
|
|
|
#### 总结
|
|
这是一个设计完善的趋势跟踪策略,通过ATR指标实现对市场波动的精确跟踪,并结合止盈止损机制进行风险管理。策略的优势在于其适应性强、风险可控,但仍需注意市场环境对策略表现的影响。通过建议的优化方向,策略的稳定性和盈利能力有望进一步提升。
|
|
|
|
||
|
|
|
|
#### Overview
|
|
This strategy is a trend-following trading system based on the Average True Range (ATR) indicator, which identifies market trends through dynamic calculation of price volatility ranges and incorporates adaptive take-profit and stop-loss mechanisms for risk management. The strategy employs a multi-period analysis approach, using ATR multiplier to dynamically adjust trade signal triggers for precise market volatility tracking.
|
|
|
|
#### Strategy Principles
|
|
The core strategy is based on dynamic ATR calculations, using a period parameter (default 10) to compute market true range. An ATR multiplier (default 3.0) is used to construct upper and lower channels, triggering trading signals when price breaks through these channels. Specifically:
|
|
1. Uses SMA or standard ATR for volatility baseline calculation
|
|
2. Dynamically computes upper and lower channels as trend-following references
|
|
3. Determines trend direction through price and channel crossovers
|
|
4. Triggers trading signals at trend reversal points
|
|
5. Implements percentage-based dynamic take-profit and stop-loss system
|
|
|
|
#### Strategy Advantages
|
|
1. High Adaptability: Dynamically adjusts to market volatility through ATR
|
|
2. Controlled Risk: Built-in percentage-based take-profit and stop-loss mechanisms effectively control per-trade risk
|
|
3. Parameter Flexibility: Key parameters like ATR period and multiplier can be adjusted based on market characteristics
|
|
4. Visual Clarity: Provides comprehensive graphical interface including trend markers and signal alerts
|
|
5. Time Management: Supports custom trading time windows, improving strategy applicability
|
|
|
|
#### Strategy Risks
|
|
1. Trend Reversal Risk: May generate frequent false signals in ranging markets
|
|
2. Parameter Sensitivity: Choice of ATR period and multiplier significantly impacts strategy performance
|
|
3. Market Environment Dependency: May experience larger slippage during high volatility periods
|
|
4. Stop Loss Settings: Fixed percentage stops may not suit all market conditions
|
|
|
|
#### Strategy Optimization Directions
|
|
1. Introduce multiple timeframe analysis to improve trend identification accuracy
|
|
2. Add volume indicator confirmation to enhance signal reliability
|
|
3. Develop adaptive take-profit and stop-loss mechanisms that adjust dynamically with market volatility
|
|
4. Include trend strength filters to reduce false signals
|
|
5. Integrate volatility indicators to optimize entry timing
|
|
|
|
#### Summary
|
|
This is a well-designed trend-following strategy that achieves precise market volatility tracking through the ATR indicator, combined with take-profit and stop-loss mechanisms for risk management. The strategy's strengths lie in its adaptability and controlled risk, though market environment impact on strategy performance should be noted. Through the suggested optimization directions, the strategy's stability and profitability can be further enhanced.
|
|
[/trans]
|
|
|
|
|
|
|
|
> Source (PineScript)
|
|
|
|
``` pinescript
|
|
/*backtest
|
|
start: 2019-12-23 08:00:00
|
|
end: 2024-11-11 00:00:00
|
|
period: 1d
|
|
basePeriod: 1d
|
|
exchanges: [{"eid":"Futures_Binance","currency":"BTC_USDT"}]
|
|
*/
|
|
|
|
//@version=5
|
|
strategy("Custom Buy BID Strategy", overlay=true, shorttitle="Buy BID by MR.STOCKVN")
|
|
|
|
// Cài đặt chỉ báo
|
|
Periods = input.int(title="ATR Period", defval=10)
|
|
src = input.source(hl2, title="Source")
|
|
Multiplier = input.float(title="ATR Multiplier", step=0.1, defval=3.0)
|
|
changeATR = input.bool(title="Change ATR Calculation Method?", defval=true)
|
|
showsignals = input.bool(title="Show Buy Signals?", defval=false)
|
|
highlighting = input.bool(title="Highlighter On/Off?", defval=true)
|
|
barcoloring = input.bool(title="Bar Coloring On/Off?", defval=true)
|
|
|
|
// Tính toán ATR
|
|
atr2 = ta.sma(ta.tr, Periods)
|
|
atr = changeATR ? ta.atr(Periods) : atr2
|
|
|
|
// Tính toán mức giá mua bán dựa trên ATR
|
|
up = src - (Multiplier * atr)
|
|
up1 = nz(up[1], up)
|
|
up := close[1] > up1 ? math.max(up, up1) : up
|
|
|
|
dn = src + (Multiplier * atr)
|
|
dn1 = nz(dn[1], dn)
|
|
dn := close[1] < dn1 ? math.min(dn, dn1) : dn
|
|
|
|
trend = 1
|
|
trend := nz(trend[1], trend)
|
|
trend := trend == -1 and close > dn1 ? 1 : trend == 1 and close < up1 ? -1 : trend
|
|
|
|
// Vẽ xu hướng
|
|
upPlot = plot(trend == 1 ? up : na, title="Up Trend", style=plot.style_line, linewidth=2, color=color.green)
|
|
buySignal = trend == 1 and trend[1] == -1
|
|
|
|
// Hiển thị tín hiệu mua
|
|
plotshape(buySignal ? up : na, title="UpTrend Begins", location=location.absolute, style=shape.circle, size=size.tiny, color=color.green, transp=0)
|
|
plotshape(buySignal and showsignals ? up : na, title="Buy", text="Buy", location=location.absolute, style=shape.labelup, size=size.tiny, color=color.green, textcolor=color.white, transp=0)
|
|
|
|
// Cài đặt màu cho thanh nến
|
|
mPlot = plot(ohlc4, title="", style=plot.style_circles, linewidth=0)
|
|
longFillColor = highlighting ? (trend == 1 ? color.green : color.white) : color.white
|
|
fill(mPlot, upPlot, title="UpTrend Highlighter", color=longFillColor)
|
|
|
|
// Điều kiện thời gian giao dịch
|
|
FromMonth = input.int(defval=9, title="From Month", minval=1, maxval=12)
|
|
FromDay = input.int(defval=1, title="From Day", minval=1, maxval=31)
|
|
FromYear = input.int(defval=2018, title="From Year", minval=999)
|
|
ToMonth = input.int(defval=1, title="To Month", minval=1, maxval=12)
|
|
ToDay = input.int(defval=1, title="To Day", minval=1, maxval=31)
|
|
ToYear = input.int(defval=9999, title="To Year", minval=999)
|
|
start = timestamp(FromYear, FromMonth, FromDay, 00, 00)
|
|
finish = timestamp(ToYear, ToMonth, ToDay, 23, 59)
|
|
|
|
// Cửa sổ thời gian giao dịch
|
|
window() => (time >= start and time <= finish)
|
|
|
|
// Điều kiện vào lệnh Buy
|
|
longCondition = buySignal
|
|
if (longCondition)
|
|
strategy.entry("BUY", strategy.long, when=window())
|
|
|
|
// Điều kiện chốt lời và cắt lỗ có thể điều chỉnh
|
|
takeProfitPercent = input.float(5, title="Take Profit (%)") / 100
|
|
stopLossPercent = input.float(2, title="Stop Loss (%)") / 100
|
|
|
|
// Tính toán giá trị chốt lời và cắt lỗ dựa trên giá vào lệnh
|
|
if (strategy.position_size > 0)
|
|
strategy.exit("Take Profit", "BUY", limit=strategy.position_avg_price * (1 + takeProfitPercent), stop=strategy.position_avg_price * (1 - stopLossPercent))
|
|
|
|
// Màu nến theo xu hướng
|
|
buy1 = ta.barssince(buySignal)
|
|
color1 = buy1[1] < na ? color.green : na
|
|
barcolor(barcoloring ? color1 : na)
|
|
|
|
```
|
|
|
|
> Detail
|
|
|
|
https://www.fmz.com/strategy/471713
|
|
|
|
> Last Modified
|
|
|
|
2024-11-12 16:14:11
|