
12 KiB
Name
基于ATR双重跟踪止损的动态止盈止损策略Dynamic-Stop-Loss-and-Take-Profit-Strategy-Based-on-Dual-ATR-Trailing-Stop
Author
ChaoZhang
Strategy Description
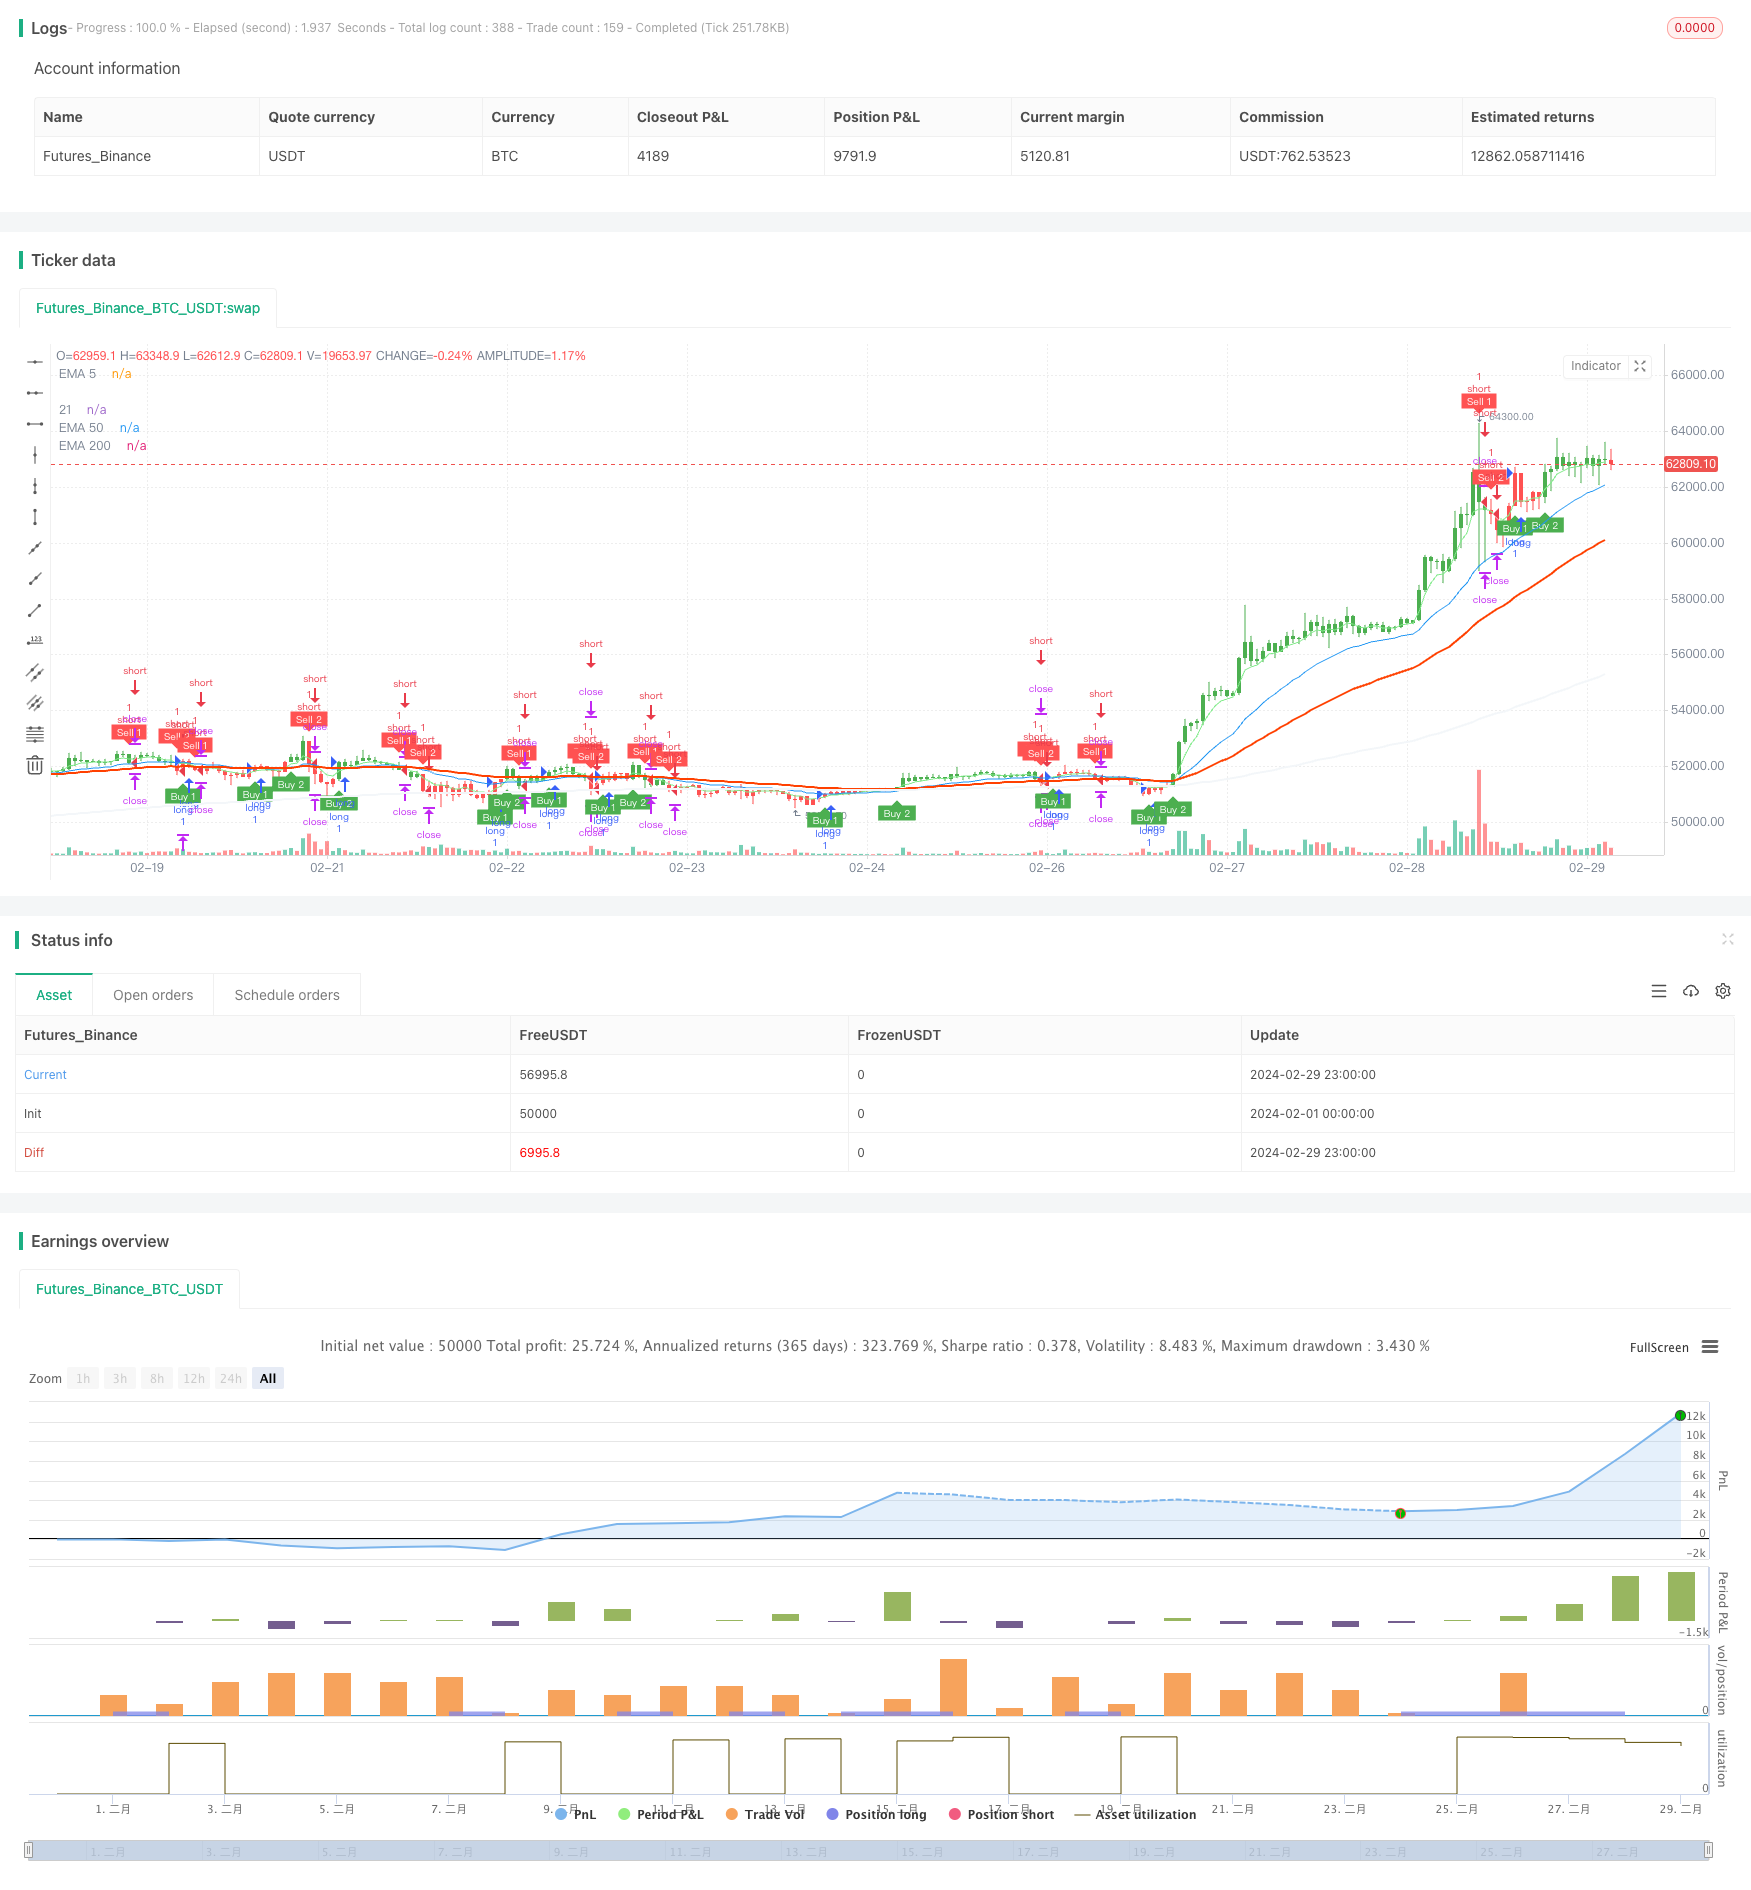 [trans]
概述
该策略通过使用两个不同周期的ATR(Average True Range)指标,构建双重动态跟踪止损线,在价格突破止损线时产生交易信号。同时利用蜡烛线实体长度动态设置止盈价位,以实现动态止盈止损。策略还结合了EMA指标来辅助判断趋势。
策略原理
- 计算两个不同周期(默认为10和20)的ATR指标值,再乘以各自的敏感系数(默认为1和2)得到两个止损宽度。
- 根据价格在两个止损线上方或下方的位置以及突破情况,产生多头或空头信号。
- 止盈价位根据当前蜡烛线实体长度的1.65倍(可调整)动态计算。
- 在开仓后,如果价格触及止盈价位,则平仓获利了结。
- 使用EMA等指标辅助判断当前趋势,为进场提供参考。
该策略利用ATR指标的特性,构建双重动态止损,可以较好地适应不同市场波动率,同时也能快速应对市场突变。动态止盈的设置使得策略能够在趋势行情中获取更多利润。综合来看,该策略在趋势性市场中表现较好,但在震荡市可能出现较多次数的盈亏抵消。
优势分析
- 双重动态止损线能够适应不同的市场波动率,灵活性较高。
- 止盈价位根据当前蜡烛线实体长度动态计算,可以在趋势行情中获取更多利润。
- 使用EMA等指标辅助判断趋势,为进场提供参考,增强了策略的可靠性。
- 代码逻辑清晰,可读性强,便于理解和优化。
风险分析
- 在震荡市场中,频繁的交易可能导致较高的手续费成本,影响收益。
- 止损线参数和止盈倍数的设置需要根据不同市场和产品特性进行优化,不当的参数可能导致策略表现欠佳。
- 策略主要依赖于价格突破动态止损线产生信号,对于一些大波动的假突破行情,可能产生错误信号。
优化方向
- 对于震荡市场,可以考虑引入更多指标或条件来过滤交易信号,如RSI、MACD等。
- 对不同的产品和市场,可以通过历史回测和参数优化来寻找最佳的止损线参数和止盈倍数。
- 可以考虑引入仓位管理和风险控制模块,根据市场波动率和账户风险动态调整仓位大小。
- 增加更多的趋势判断指标,提高信号的可靠性和准确性。
总结
该策略通过双重动态止损线和动态止盈的设计,能够较好地适应不同市场环境,在趋势行情中表现出色。但是在震荡市场中,可能面临频繁交易和盈亏抵消的问题。因此,该策略更适合在趋势性市场中使用,同时需要结合产品特性和市场环境,对参数进行优化和调整。此外,仍有进一步优化的空间,如引入更多过滤条件、仓位管理和风险控制等模块,以提高策略的稳健性和盈利能力。总的来说,该策略思路清晰,逻辑简单易懂,具有一定的实用价值和可优化空间,值得进一步研究和应用。
||
Overview
This strategy constructs dual dynamic trailing stop-loss lines using two Average True Range (ATR) indicators with different periods, generating trading signals when the price breaks through the stop-loss lines. It also dynamically sets the take-profit level based on the current candle body length to achieve dynamic stop-loss and take-profit. The strategy also incorporates EMA indicators to assist in judging the trend.
Strategy Principles
- Calculate the ATR indicator values for two different periods (default 10 and 20), then multiply them by their respective sensitivity coefficients (default 1 and 2) to obtain two stop-loss widths.
- Generate long or short signals based on the price position above or below the two stop-loss lines and the breakout situation.
- The take-profit level is dynamically calculated based on 1.65 times (adjustable) the current candle body length.
- After opening a position, if the price reaches the take-profit level, the position is closed to take profits.
- Use indicators such as EMA to assist in judging the current trend and provide reference for entry.
This strategy utilizes the characteristics of the ATR indicator to construct dual dynamic stop-losses, which can adapt well to different market volatilities and quickly respond to market changes. The dynamic take-profit setting allows the strategy to capture more profits in trending markets. Overall, the strategy performs well in trending markets but may experience frequent profit and loss offsets in range-bound markets.
Advantage Analysis
- The dual dynamic stop-loss lines can adapt to different market volatilities and have high flexibility.
- The take-profit level is dynamically calculated based on the current candle body length, allowing for more profits to be captured in trending markets.
- The use of EMA and other indicators to assist in trend judgment provides a reference for entry and enhances the reliability of the strategy.
- The code logic is clear and readable, making it easy to understand and optimize.
Risk Analysis
- In range-bound markets, frequent trading may lead to high transaction costs and affect profitability.
- The settings of stop-loss line parameters and take-profit multipliers need to be optimized according to different market and product characteristics; improper parameters may result in poor strategy performance.
- The strategy mainly relies on price breakouts of dynamic stop-loss lines to generate signals, which may produce false signals in some large fluctuation fake breakouts.
Optimization Directions
- For range-bound markets, consider introducing more indicators or conditions to filter trading signals, such as RSI and MACD.
- For different products and markets, historical backtesting and parameter optimization can be used to find the optimal stop-loss line parameters and take-profit multipliers.
- Consider introducing position management and risk control modules to dynamically adjust position size based on market volatility and account risk.
- Add more trend judgment indicators to improve the reliability and accuracy of signals.
Summary
This strategy, with its design of dual dynamic stop-loss lines and dynamic take-profit, can adapt well to different market environments and perform well in trending markets. However, in range-bound markets, it may face the problem of frequent trading and profit and loss offsets. Therefore, this strategy is more suitable for use in trending markets and needs to be optimized and adjusted based on product characteristics and market conditions. Moreover, there is still room for further optimization, such as introducing more filtering conditions, position management, and risk control modules to improve the robustness and profitability of the strategy. Overall, the strategy has a clear idea, simple and easy-to-understand logic, and has certain practical value and room for optimization, which is worthy of further research and application.
[/trans]
Strategy Arguments
| Argument | Default | Description |
|---|---|---|
| v_input_1 | true | Key Value 1 ('This changes the sensitivity') |
| v_input_2 | 10 | ATR Period 1 |
| v_input_3 | 2 | Key Value 2 ('This changes the sensitivity') |
| v_input_4 | 20 | ATR Period 2 |
| v_input_5 | false | Signals from Heikin Ashi Candles |
| v_input_6 | true | From Day |
| v_input_7 | true | From Month |
| v_input_8 | 2019 | From Year |
| v_input_9 | true | To Day |
| v_input_10 | true | To Month |
| v_input_11 | 2100 | To Year |
Source (PineScript)
/*backtest
start: 2024-02-01 00:00:00
end: 2024-02-29 23:59:59
period: 1h
basePeriod: 15m
exchanges: [{"eid":"Futures_Binance","currency":"BTC_USDT"}]
*/

//@version=4
strategy(title="UT Bot Strategy", overlay=true)

// Inputs
a1 = input(1, title="Key Value 1 ('This changes the sensitivity')")
c1 = input(10, title="ATR Period 1")
a2 = input(2, title="Key Value 2 ('This changes the sensitivity')")
c2 = input(20, title="ATR Period 2")
h = input(false, title="Signals from Heikin Ashi Candles")

////////////////////////////////////////////////////////////////////////////////
// BACKTESTING RANGE

// From Date Inputs
fromDay = input(defval=1, title="From Day", minval=1, maxval=31)
fromMonth = input(defval=1, title="From Month", minval=1, maxval=12)
fromYear = input(defval=2019, title="From Year", minval=1970)

// To Date Inputs
toDay = input(defval=1, title="To Day", minval=1, maxval=31)
toMonth = input(defval=1, title="To Month", minval=1, maxval=12)
toYear = input(defval=2100, title="To Year", minval=1970)

// Calculate start/end date and time condition
startDate = timestamp(fromYear, fromMonth, fromDay, 00, 00)
finishDate = timestamp(toYear, toMonth, toDay, 00, 00)
time_cond = time >= startDate and time <= finishDate

////////////////////////////////////////////////////////////////////////////////

xATR1 = atr(c1)
nLoss1 = a1 * xATR1
xATR2 = atr(c2)
nLoss2 = a2 * xATR2

src = h ? security(heikinashi(syminfo.tickerid), timeframe.period, close, lookahead=false) : close

xATRTrailingStop1 = 0.0
xATRTrailingStop1 := iff(src > nz(xATRTrailingStop1[1], 0) and src[1] > nz(xATRTrailingStop1[1], 0), max(nz(xATRTrailingStop1[1]), src - nLoss1),
   iff(src < nz(xATRTrailingStop1[1], 0) and src[1] < nz(xATRTrailingStop1[1], 0), min(nz(xATRTrailingStop1[1]), src + nLoss1),
   iff(src > nz(xATRTrailingStop1[1], 0), src - nLoss1, src + nLoss1)))

xATRTrailingStop2 = 0.0
xATRTrailingStop2 := iff(src > nz(xATRTrailingStop2[1], 0) and src[1] > nz(xATRTrailingStop2[1], 0), max(nz(xATRTrailingStop2[1]), src - nLoss2),
   iff(src < nz(xATRTrailingStop2[1], 0) and src[1] < nz(xATRTrailingStop2[1], 0), min(nz(xATRTrailingStop2[1]), src + nLoss2),
   iff(src > nz(xATRTrailingStop2[1], 0), src - nLoss2, src + nLoss2)))

pos = 0
pos := iff(src[1] < nz(xATRTrailingStop1[1], 0) and src > nz(xATRTrailingStop1[1], 0), 1,
   iff(src[1] > nz(xATRTrailingStop1[1], 0) and src < nz(xATRTrailingStop1[1], 0), -1, nz(pos[1], 0)))

xcolor = pos == -1 ? color.red: pos == 1 ? color.green : color.blue

ema1 = ema(src, 1)
above1 = crossover(ema1, xATRTrailingStop1)
below1 = crossover(xATRTrailingStop1, ema1)
buy1 = src > xATRTrailingStop1 and above1
sell1 = src < xATRTrailingStop1 and below1
barbuy1 = src > xATRTrailingStop1
barsell1 = src < xATRTrailingStop1

ema2 = ema(src, 1)
above2 = crossover(ema2, xATRTrailingStop2)
below2 = crossover(xATRTrailingStop2, ema2)
buy2 = src > xATRTrailingStop2 and above2
sell2 = src < xATRTrailingStop2 and below2
barbuy2 = src > xATRTrailingStop2
barsell2 = src < xATRTrailingStop2

plotshape(buy1,  title="Buy 1",  text='Buy 1',  style=shape.labelup,   location=location.belowbar, color=color.green, textcolor=color.white, transp=0, size=size.tiny)
plotshape(sell1, title="Sell 1", text='Sell 1', style=shape.labeldown, location=location.abovebar, color=color.red,   textcolor=color.white, transp=0, size=size.tiny)
plotshape(buy2,  title="Buy 2",  text='Buy 2',  style=shape.labelup,   location=location.belowbar, color=color.green, textcolor=color.white, transp=0, size=size.tiny)
plotshape(sell2, title="Sell 2", text='Sell 2', style=shape.labeldown, location=location.abovebar, color=color.red,   textcolor=color.white, transp=0, size=size.tiny)

barcolor(barbuy1  ? color.green : na)
barcolor(barsell1 ? color.red   : na)
barcolor(barbuy2  ? color.green : na)
barcolor(barsell2 ? color.red   : na)

// Calculate SL and TP levels
candle_size = abs(open - close)
tp_level = close + candle_size *65

// Close long positions if TP is hit
strategy.exit("TP Long", "long", limit=tp_level)

// Close short positions if TP is hit
strategy.exit("TP Short", "short", limit=tp_level)

// Enter long position
strategy.entry("long", strategy.long, when=(buy1 or buy2) and time_cond)

// Enter short position
strategy.entry("short", strategy.short, when=(sell1 or sell2) and time_cond)

//adding ema with width
// Calculate EMA and SMA
ema5 = ema(close, 5)
ema200 = ema(close, 200)
ema21 = ema(close, 21)
ema50 = ema(close, 50)
sma50 = sma(close, 50)

// Plot EMA and SMA with width
plot(ema5, color=color.rgb(130, 235, 139), title="EMA 5", linewidth=1)
plot(ema200, color=color.rgb(243, 246, 249), title="EMA 200", linewidth=2)
plot(ema21, color=color.blue, title="21", linewidth=1)
plot(ema50, color=color.rgb(255, 64, 0), title="EMA 50", linewidth=2)
//plot(sma50, color=color.purple, title="SMA 20", linewidth=2)
Detail
https://www.fmz.com/strategy/445802
Last Modified
2024-03-22 13:52:59