
178 lines
9.7 KiB
Markdown
178 lines
9.7 KiB
Markdown
|
|
> Name
|
|
|
|
基于随机慢速指标的交易策略KRK-ADA-1H-Stochastic-Slow-Strategy-with-More-Entries-and-AI
|
|
|
|
> Author
|
|
|
|
ChaoZhang
|
|
|
|
> Strategy Description
|
|
|
|
|
|
|
|
[trans]
|
|
#### 概述
|
|
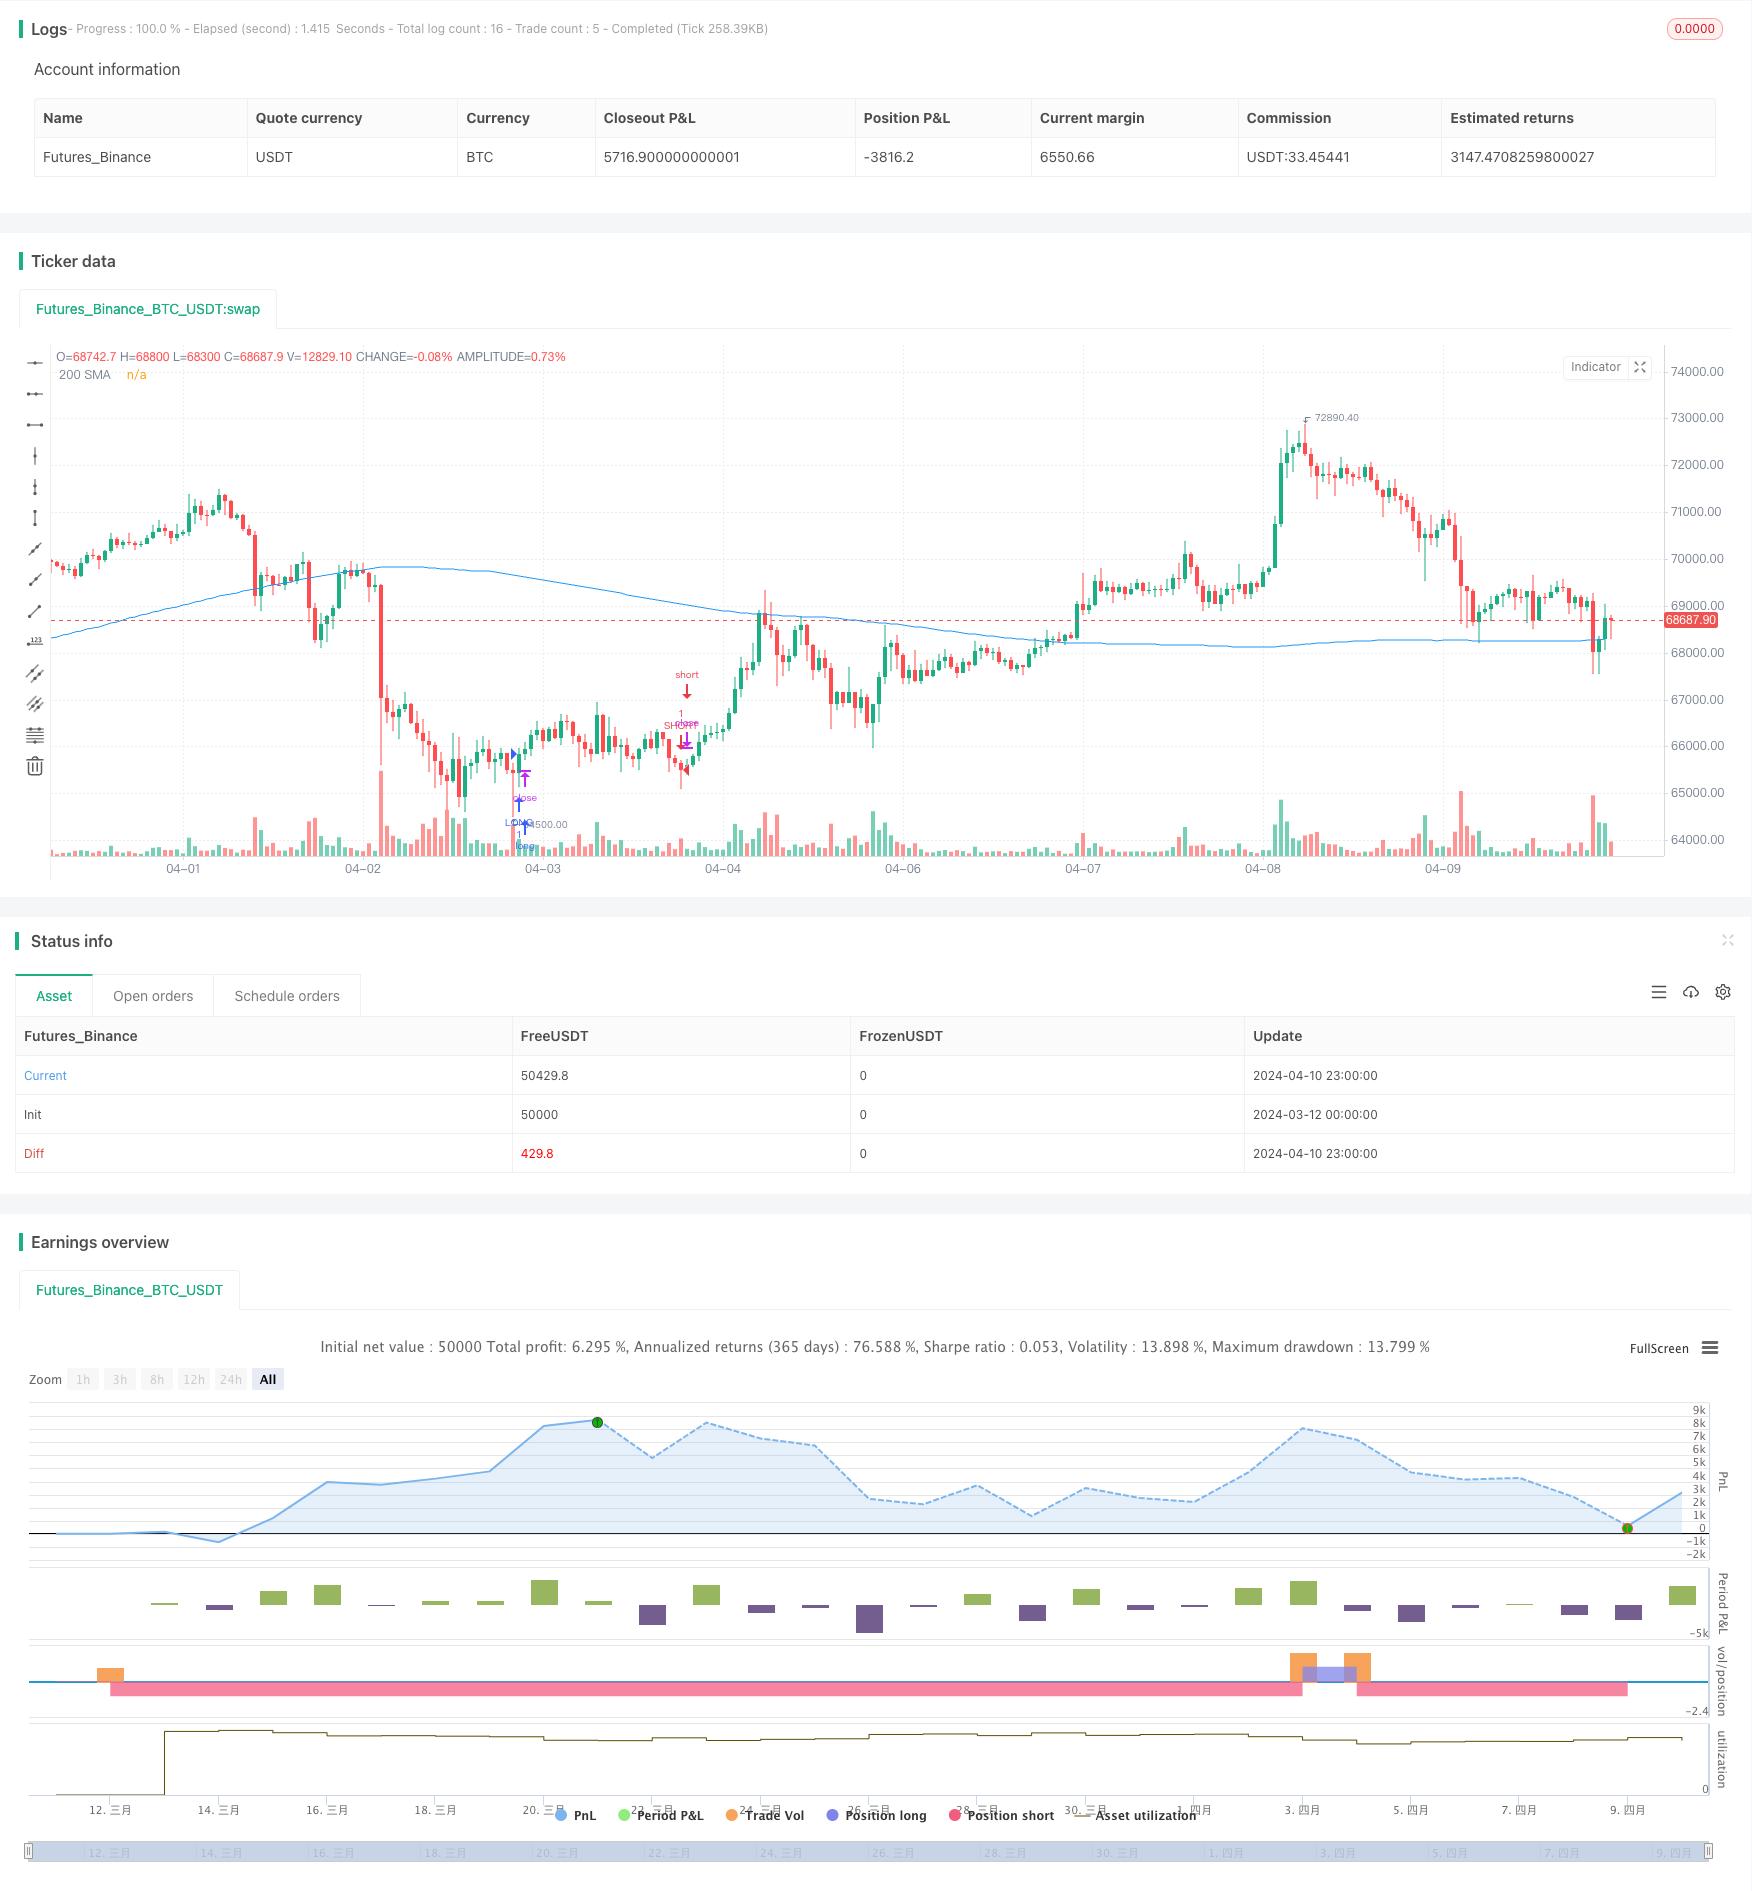
这个策略是一个基于随机慢速指标(Stochastic Slow Oscillator)的交易策略,同时结合了移动平均线(Moving Average)、相对强弱指数(RSI)和人工智能(AI)技术。该策略通过对随机慢速指标的交叉信号进行判断,同时考虑价格相对于200日移动平均线的位置,以及人工智能模型生成的信号,来确定买卖信号。策略还设置了止盈和止损位,以控制风险。
|
|
|
|
#### 策略原理
|
|
1. 计算30周期的随机慢速指标,其中K值的平滑周期为18,D值的平滑周期为7。
|
|
2. 确定超买和超卖的阈值分别为40和19,同时设置最小的K值为12。
|
|
3. 计算200日简单移动平均线作为趋势过滤器。
|
|
4. 使用递归神经网络(RNN)模型生成买卖信号。
|
|
5. 多头进场条件:价格上穿200日移动平均线,K值小于超卖阈值且大于最小K值,AI信号为1。
|
|
6. 空头进场条件:价格下穿200日移动平均线,K值大于超买阈值且大于最小K值,AI信号为-1。
|
|
7. 当随机指标出现交叉且满足超买超卖条件时,也会产生买卖信号。
|
|
8. 设置止盈位为当前价格上下500个点,止损位为当前价格上下200个点。
|
|
|
|
#### 策略优势
|
|
1. 结合了多个技术指标和人工智能技术,提高了策略的稳健性和适应性。
|
|
2. 使用随机慢速指标作为主要的买卖信号,有效捕捉市场超买超卖状态。
|
|
3. 引入200日移动平均线作为趋势过滤器,避免在逆趋势中交易。
|
|
4. 运用人工智能模型生成买卖信号,增强了策略的智能化程度。
|
|
5. 设置了明确的止盈止损位,有效控制风险。
|
|
|
|
#### 策略风险
|
|
1. 随机指标在某些市场状况下可能会产生较多的虚假信号。
|
|
2. 人工智能模型的有效性取决于训练数据的质量和模型的设计,存在一定的不确定性。
|
|
3. 固定的止盈止损位可能无法适应不同的市场波动状况。
|
|
4. 策略缺乏对市场突发事件和异常波动的应对机制。
|
|
|
|
#### 策略优化方向
|
|
1. 对随机指标的参数进行优化,如调整K值和D值的平滑周期,以提高指标的有效性。
|
|
2. 改进人工智能模型的设计,引入更多的市场特征和数据,提高模型的预测准确性。
|
|
3. 采用动态止盈止损机制,根据市场波动性和风险水平自适应调整止盈止损位。
|
|
4. 引入市场情绪分析和事件驱动因素,增强策略对市场突发事件的应对能力。
|
|
5. 考虑加入仓位管理和资金管理模块,优化策略的资金利用效率和风险控制。
|
|
|
|
#### 总结
|
|
该策略通过结合随机慢速指标、移动平均线、相对强弱指数和人工智能技术,构建了一个多因子交易策略。策略利用随机指标捕捉超买超卖信号,同时使用趋势过滤器和智能化信号生成,提高了策略的稳健性和适应性。尽管策略存在一定的风险,如指标失效和模型不确定性,但通过优化指标参数、改进人工智能模型、采用动态风控措施等方法,可以进一步提升策略的性能和风险控制能力。
|
|
|
|
||
|
|
|
|
#### Overview
|
|
This strategy is a trading strategy based on the Stochastic Slow Oscillator, combined with Moving Average, Relative Strength Index (RSI), and Artificial Intelligence (AI) techniques. The strategy determines buy and sell signals by analyzing the crossover signals of the Stochastic Slow Oscillator, considering the position of the price relative to the 200-day moving average, and incorporating signals generated by an AI model. The strategy also sets take-profit and stop-loss levels to manage risk.
|
|
|
|
#### Strategy Principles
|
|
1. Calculate the Stochastic Slow Oscillator with a period of 30, where the smoothing period for the K value is 18 and the smoothing period for the D value is 7.
|
|
2. Determine the overbought and oversold thresholds as 40 and 19, respectively, and set the minimum K value as 12.
|
|
3. Calculate the 200-day simple moving average as a trend filter.
|
|
4. Use a Recurrent Neural Network (RNN) model to generate buy and sell signals.
|
|
5. Long entry condition: Price crosses above the 200-day moving average, K value is below the oversold threshold and above the minimum K value, and the AI signal is 1.
|
|
6. Short entry condition: Price crosses below the 200-day moving average, K value is above the overbought threshold and above the minimum K value, and the AI signal is -1.
|
|
7. Buy and sell signals are also generated when the Stochastic Oscillator shows a crossover and meets the overbought or oversold conditions.
|
|
8. Set the take-profit level at 500 points above or below the current price, and the stop-loss level at 200 points above or below the current price.
|
|
|
|
#### Strategy Advantages
|
|
1. Combines multiple technical indicators and AI techniques, improving the robustness and adaptability of the strategy.
|
|
2. Uses the Stochastic Slow Oscillator as the primary buy and sell signal, effectively capturing overbought and oversold market conditions.
|
|
3. Introduces the 200-day moving average as a trend filter to avoid trading against the trend.
|
|
4. Employs an AI model to generate buy and sell signals, enhancing the strategy's intelligence.
|
|
5. Sets clear take-profit and stop-loss levels to effectively manage risk.
|
|
|
|
#### Strategy Risks
|
|
1. The Stochastic Oscillator may generate false signals under certain market conditions.
|
|
2. The effectiveness of the AI model depends on the quality of training data and model design, introducing uncertainty.
|
|
3. Fixed take-profit and stop-loss levels may not adapt well to different market volatility conditions.
|
|
4. The strategy lacks a mechanism to respond to sudden market events and abnormal fluctuations.
|
|
|
|
#### Strategy Optimization Directions
|
|
1. Optimize the parameters of the Stochastic Oscillator, such as adjusting the smoothing periods for the K and D values, to improve the effectiveness of the indicator.
|
|
2. Enhance the design of the AI model by incorporating more market features and data to improve its predictive accuracy.
|
|
3. Implement a dynamic take-profit and stop-loss mechanism that adapts to market volatility and risk levels.
|
|
4. Introduce market sentiment analysis and event-driven factors to enhance the strategy's ability to respond to sudden market events.
|
|
5. Consider adding position sizing and money management modules to optimize the strategy's capital utilization efficiency and risk control.
|
|
|
|
#### Summary
|
|
This strategy combines the Stochastic Slow Oscillator, Moving Average, Relative Strength Index, and AI techniques to construct a multi-factor trading strategy. The strategy utilizes the Stochastic Oscillator to capture overbought and oversold signals while using a trend filter and intelligent signal generation to improve its robustness and adaptability. Although the strategy has certain risks, such as indicator failure and model uncertainty, these can be mitigated by optimizing indicator parameters, enhancing the AI model, implementing dynamic risk control measures, and incorporating additional modules for position sizing and money management.
|
|
[/trans]
|
|
|
|
> Strategy Arguments
|
|
|
|
|
|
|
|
|Argument|Default|Description|
|
|
|----|----|----|
|
|
|v_input_int_1|30|length|
|
|
|v_input_1|40|OverBought|
|
|
|v_input_2|19|OverSold|
|
|
|v_input_int_2|18|smoothK|
|
|
|v_input_int_3|7|smoothD|
|
|
|v_input_3|12|Minimum K Value|
|
|
|
|
|
|
> Source (PineScript)
|
|
|
|
``` pinescript
|
|
/*backtest
|
|
start: 2024-03-12 00:00:00
|
|
end: 2024-04-11 00:00:00
|
|
period: 1h
|
|
basePeriod: 15m
|
|
exchanges: [{"eid":"Futures_Binance","currency":"BTC_USDT"}]
|
|
*/
|
|
|
|
//@version=5
|
|
strategy("Stochastic Slow Strategy with More Entries and AI", overlay=true)
|
|
|
|
length = input.int(30, minval=1)
|
|
OverBought = input(40)
|
|
OverSold = input(19)
|
|
smoothK = input.int(18, minval=1)
|
|
smoothD = input.int(7, minval=1)
|
|
minKValue = input(12, title="Minimum K Value")
|
|
|
|
// Stochastic calculations
|
|
k = ta.sma(ta.stoch(close, high, low, length), smoothK)
|
|
d = ta.sma(k, smoothD)
|
|
co = ta.crossover(k, d)
|
|
cu = ta.crossunder(k, d)
|
|
|
|
// Trend filter (200-period simple moving average)
|
|
ema200 = ta.sma(close, 200)
|
|
|
|
// Define la función para calcular la señal de la red neuronal recurrente
|
|
rnn_signal(price_series) =>
|
|
// Aquí implementa tu modelo de red neuronal recurrente para generar la señal
|
|
// Puedes usar bibliotecas externas o implementar tu propio modelo aquí
|
|
|
|
// Ejemplo de señal aleatoria
|
|
signal = ta.rsi(price_series, 14) > 50 ? 1 : -1
|
|
|
|
// Devuelve la señal generada por la red neuronal recurrente
|
|
signal
|
|
|
|
// Calcula la señal utilizando la función definida anteriormente
|
|
ai_signal = rnn_signal(close)
|
|
|
|
// Entry conditions
|
|
longCondition = ta.crossover(close, ema200) and k < OverSold and k > minKValue and ai_signal == 1
|
|
shortCondition = ta.crossunder(close, ema200) and k > OverBought and k > minKValue and ai_signal == -1
|
|
|
|
if (not na(k) and not na(d))
|
|
if (co and k < OverSold and k > minKValue)
|
|
strategy.entry("LONG", strategy.long, comment="LONG")
|
|
strategy.exit("ExitLong", "LONG", profit = close * 500, loss = close * 200)
|
|
if (cu and k > OverBought and k > minKValue)
|
|
strategy.entry("SHORT", strategy.short, comment="SHORT")
|
|
strategy.exit("ExitShort", "SHORT", profit = close * 500, loss = close * 200)
|
|
|
|
if (longCondition)
|
|
strategy.entry("LongEntry", strategy.long, comment="LongEntry")
|
|
strategy.exit("ExitLongEntry", "LongEntry", profit = close * 500, loss = close * 200)
|
|
if (shortCondition)
|
|
strategy.entry("ShortEntry", strategy.short, comment="ShortEntry")
|
|
strategy.exit("ExitShortEntry", "ShortEntry", profit = close * 500, loss = close * 200)
|
|
|
|
// Plotting
|
|
plot(ema200, color=color.blue, title="200 SMA")
|
|
```
|
|
|
|
> Detail
|
|
|
|
https://www.fmz.com/strategy/448059
|
|
|
|
> Last Modified
|
|
|
|
2024-04-12 16:26:06
|