
209 lines
7.0 KiB
Markdown
209 lines
7.0 KiB
Markdown
|
|
> Name
|
|
|
|
基于重叠差额的反转交易策略Reverse-Trading-Strategy-Based-on-Overlapping-Price-Differentials
|
|
|
|
> Author
|
|
|
|
ChaoZhang
|
|
|
|
> Strategy Description
|
|
|
|
|
|
[trans]
|
|
|
|
## 概述
|
|
|
|
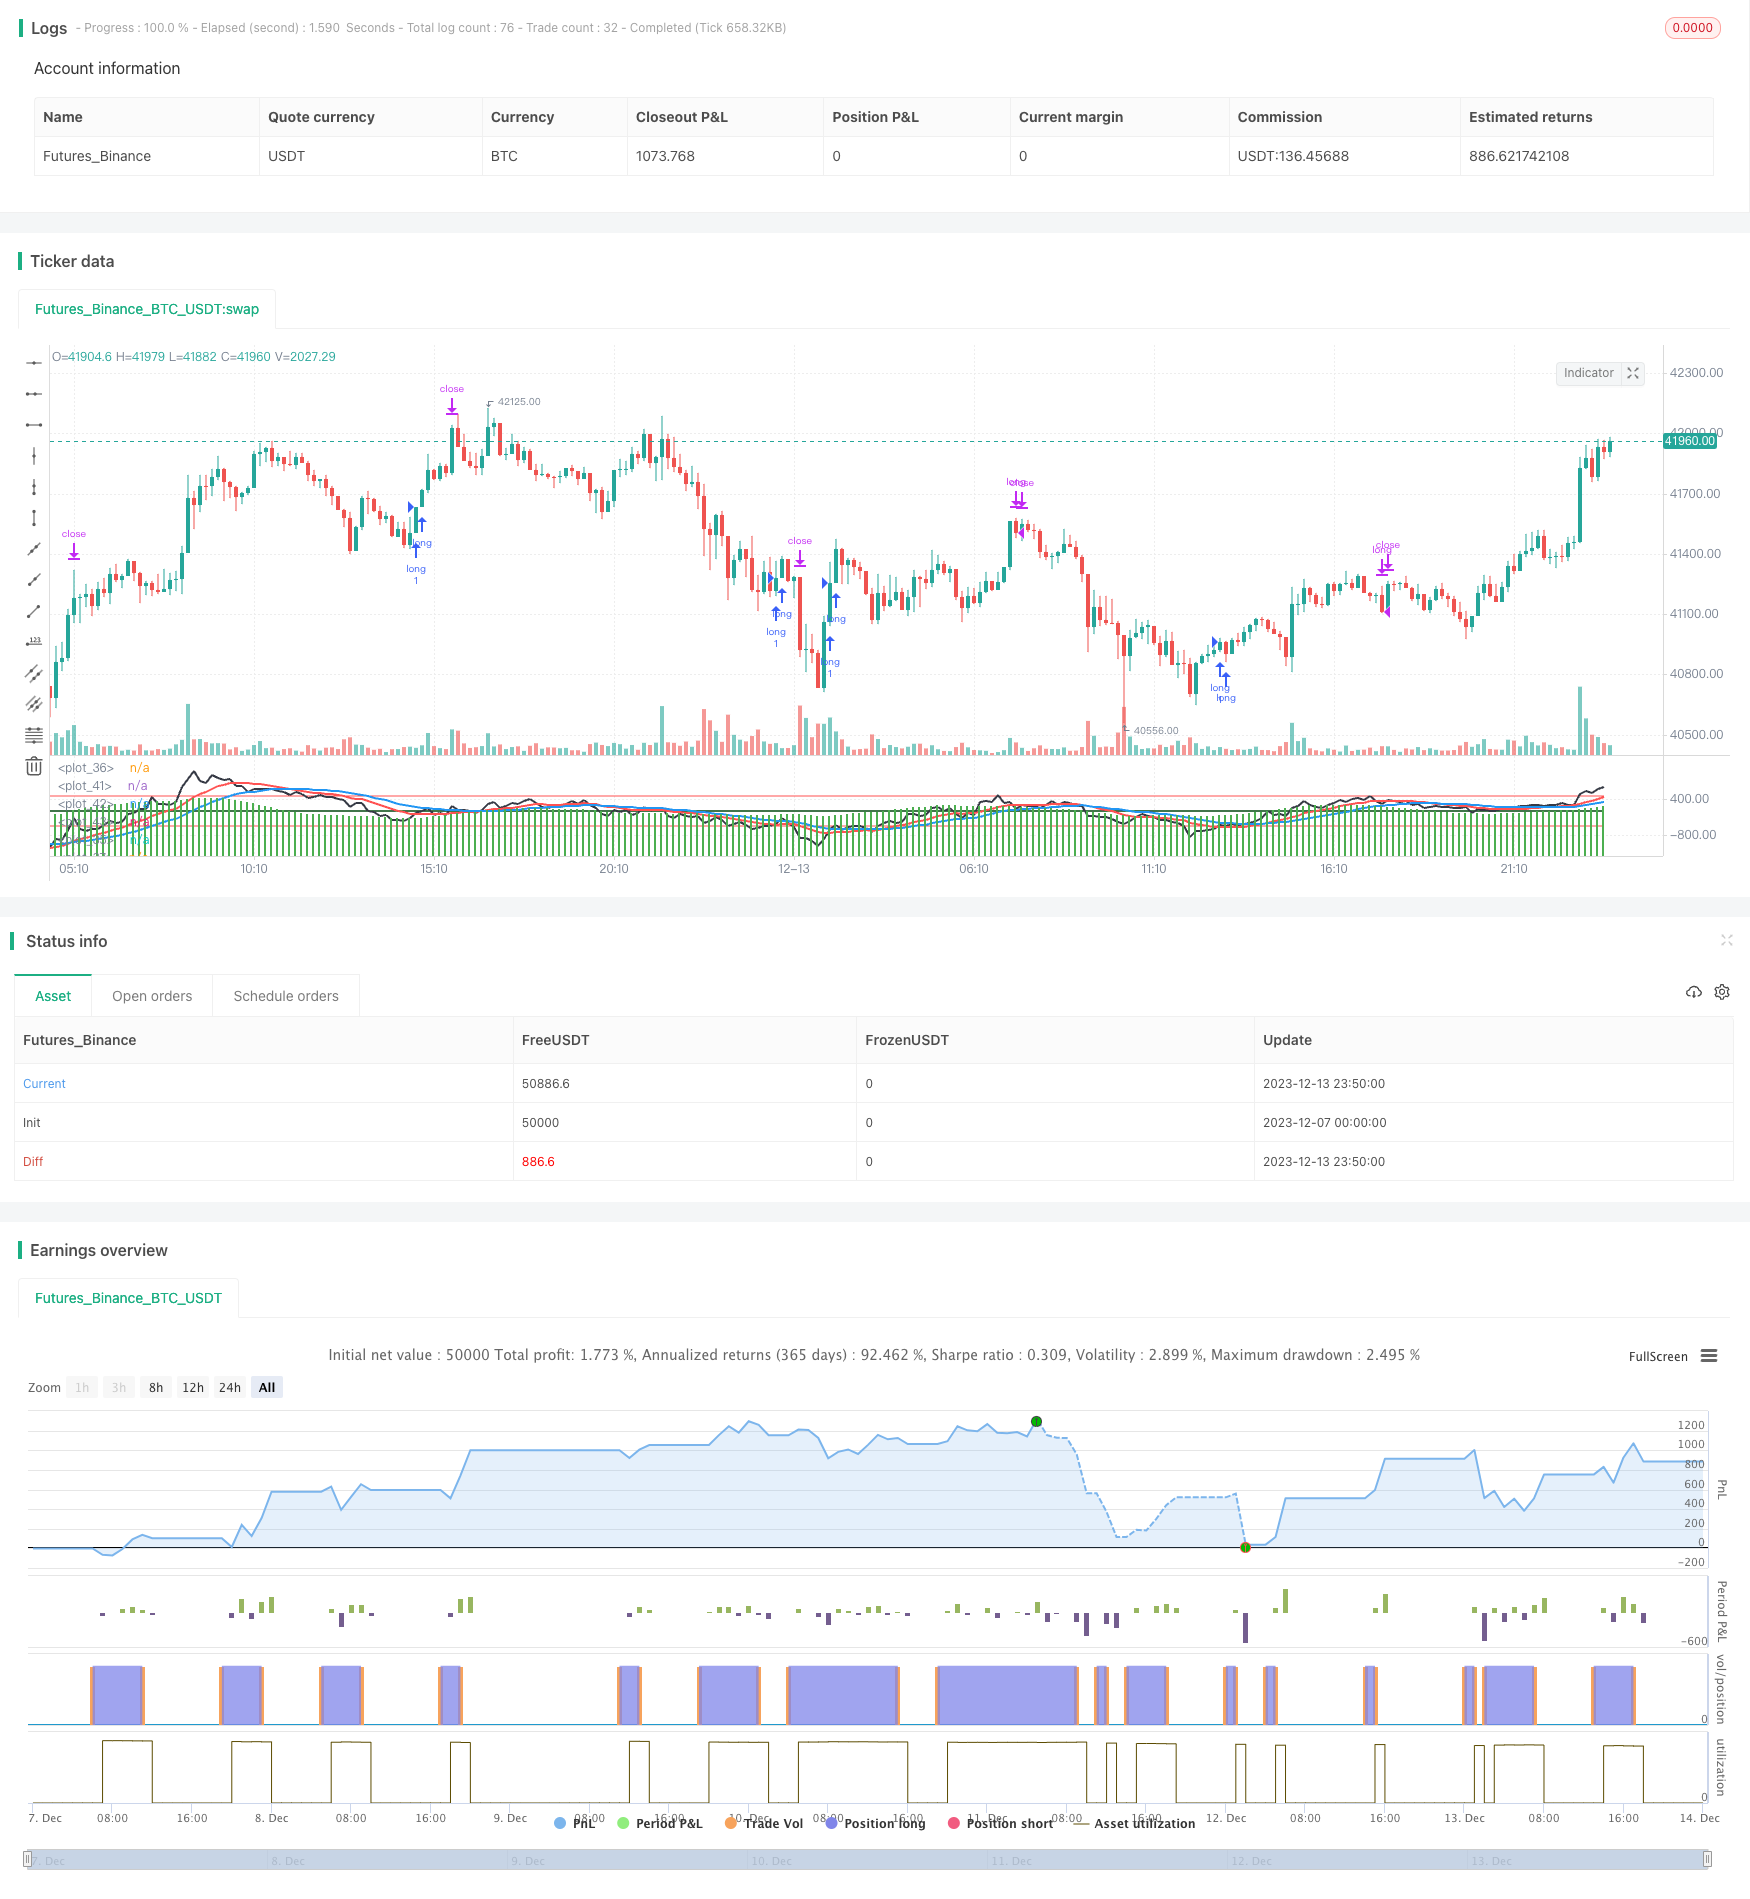
本策略主要思想是利用价格的重叠差额来判断市场趋势,当差额从负数反转到正数时做多,从正数反转到负数时做空,属于反转交易策略。
|
|
|
|
## 原理
|
|
|
|
该策略首先计算价格的重叠差额(Close-Close[1]),即今天的收盘价减去昨天的收盘价,然后计算最近30天内差额的总和。当总和从负数反转到正数时产生做多信号,当总和从正数反转到负数时产生做空信号,属于典型的反转交易策略。
|
|
|
|
具体来说,策略维护三个指标:
|
|
|
|
1. ff:最近30天内差额的总和
|
|
2. dd1: ff的15日加权移动平均线
|
|
3. dd2: ff的30日加权移动平均线
|
|
|
|
当ff从负数反转到正数,即小于0变大于0,并且dd1也从负数反转到正数时,产生做多信号。
|
|
|
|
当ff从正数反转到负数,即大于0变小于0,并且dd1也从正数反转到负数时,产生做空信号。
|
|
|
|
做多做空后会设置止盈止损线。
|
|
|
|
## 优势
|
|
|
|
该策略具有以下优势:
|
|
|
|
1. 思路清晰,容易理解和实现。
|
|
2. 利用价格反转特征,在市场转折点能够获得较好入场时机。
|
|
3. 结合双重确认机制,可以过滤假突破。
|
|
4. 可自定义参数,适应不同市场环境。
|
|
|
|
## 风险
|
|
|
|
该策略也存在一些风险:
|
|
|
|
1. 反转失败的概率较大,区间震荡市场中容易止损。
|
|
2. 参数设置不当可能导致交易频繁,增大交易成本。
|
|
3. 需要联合其他指标过滤性入场,避免追顶和接底。
|
|
|
|
对应解决方法如下:
|
|
|
|
1. 合理设置止损比例,控制单笔损失。
|
|
2. 优化参数,找到最佳参数组合。
|
|
3. 增加过滤条件,避免不必要入场。
|
|
|
|
## 优化方向
|
|
|
|
该策略可以从以下方面进行优化:
|
|
|
|
1. 增加成交量的过滤,例如突破时需成交量放大。
|
|
2. 结合趋势指标过滤,避免逆势操作。
|
|
3. 动态调整参数,让参数能根据市场状态变化。
|
|
4. 优化止损机制,例如随价格移动止损。
|
|
|
|
## 总结
|
|
|
|
本策略通过计算价格差额的反转来判断市场转折点,是一种典型的反转交易策略。策略思路清晰,易于实现,有一定的实用价值。但也存在一些风险,需要进一步优化以适应市场的变化。总的来说,本策略为量化交易提供了一个基础框架,可在此基础上进行扩展。
|
|
|
|
||
|
|
|
|
## Overview
|
|
|
|
The main idea of this strategy is to use the overlapping price differentials to judge market trends. It goes long when the differential reverses from negative to positive, and goes short when the differential reverses from positive to negative. It belongs to reverse trading strategies.
|
|
|
|
## Principle
|
|
|
|
The strategy first calculates the overlapping price differential (Close-Close[1]), which is today's close price minus yesterday's close price, and then calculates the sum of the differentials over the past 30 days. It generates a long signal when the sum reverses from negative to positive, and generates a short signal when the sum reverses from positive to negative. It is a typical reverse trading strategy.
|
|
|
|
Specifically, the strategy maintains three indicators:
|
|
|
|
1. ff: Sum of price differentials over the past 30 days
|
|
2. dd1: 15-day weighted moving average of ff
|
|
3. dd2: 30-day weighted moving average of ff
|
|
|
|
It generates a long signal when ff changes from negative to positive, i.e. from less than 0 to greater than 0, and dd1 also changes from negative to positive.
|
|
|
|
It generates a short signal when ff changes from positive to negative, i.e. from greater than 0 to less than 0, and dd1 also changes from positive to negative.
|
|
|
|
After going long or short, take profit and stop loss lines will be set.
|
|
|
|
## Advantages
|
|
|
|
The strategy has the following advantages:
|
|
|
|
1. The logic is clear and easy to understand and implement.
|
|
2. It captures good entry timing at market turning points by utilizing price reversal features.
|
|
3. False breakouts can be filtered out with the dual confirmation mechanism.
|
|
4. Customizable parameters adapt to different market environments.
|
|
|
|
## Risks
|
|
|
|
There are also some risks for the strategy:
|
|
|
|
1. High probability of reversal failure, likely to be stopped out in range-bound markets.
|
|
2. Improper parameter settings may lead to frequent trading and increased transaction costs.
|
|
3. Other indicators should be incorporated to filter entries, avoiding chasing tops and bottoms.
|
|
|
|
The corresponding solutions are:
|
|
|
|
1. Set proper stop loss percentage to control single loss.
|
|
2. Optimize parameters to find the best combination.
|
|
3. Add filtering conditions to avoid unnecessary entries.
|
|
|
|
## Optimization Directions
|
|
|
|
The strategy can be optimized in the following aspects:
|
|
|
|
1. Add volume filter, requiring enlarged volume on breakouts.
|
|
2. Incorporate trend indicators to avoid countertrend operations.
|
|
3. Dynamically adjust parameters to adapt to changing market conditions.
|
|
4. Optimize stop loss mechanism, such as trailing stop loss.
|
|
|
|
|
|
## Summary
|
|
|
|
The strategy judges market turning points by calculating price differential reversals. It is a typical reverse trading strategy. The logic is clear and easy to implement with some practical value. But there are also risks that need to be further optimized to adapt to market changes. Overall, the strategy provides a basic framework for quantitative trading, which can be built upon and extended.
|
|
|
|
[/trans]
|
|
|
|
> Strategy Arguments
|
|
|
|
|
|
|
|
|Argument|Default|Description|
|
|
|----|----|----|
|
|
|v_input_1|30|SUMM|
|
|
|v_input_2|15|Signalperiod|
|
|
|v_input_3|30|Info|
|
|
|v_input_4|95|profit|
|
|
|v_input_5|95|loss|
|
|
|
|
|
|
> Source (PineScript)
|
|
|
|
``` pinescript
|
|
/*backtest
|
|
start: 2023-12-07 00:00:00
|
|
end: 2023-12-14 00:00:00
|
|
period: 10m
|
|
basePeriod: 1m
|
|
exchanges: [{"eid":"Futures_Binance","currency":"BTC_USDT"}]
|
|
*/
|
|
|
|
//@version=3
|
|
strategy(title="Fst",currency="USD",initial_capital=100000)
|
|
|
|
//Length0 = input(30, title="fastperiod", minval=1)
|
|
Length = input(30, title="SUMM")
|
|
Length1 = input(15, title="Signalperiod", minval=1)
|
|
Length2= input(30, title="Info", minval=1)
|
|
profit=input(95, title="profit", minval=1)
|
|
loss=input(95, title="loss", minval=1)
|
|
//f=iff(close>open,close-open,iff(close>open[1],close[1]-open[1],0))
|
|
f=0.0
|
|
dd1=0.0
|
|
dd2=0.0
|
|
ff=0.0
|
|
ff0=0.0
|
|
f:=close-close[1]
|
|
ff:=sum(f,Length)
|
|
//ff0:=sum(f,Length0)
|
|
dd1:=wma(ff,Length1)
|
|
dd2:=wma(ff,Length2)
|
|
|
|
bull=ff<0 and dd1<0 and ff[1]<dd1 and ff>dd1 and abs(ff)>20
|
|
bear=ff>0 and dd1>0 and ff[1]>dd1 and ff<dd1 and abs(ff)>20
|
|
if(bull)
|
|
|
|
strategy.entry("long", strategy.long)
|
|
strategy.exit("exit", "long", profit = close*profit/1000, loss=close*loss/1000)
|
|
|
|
strategy.close("long", when = bear)
|
|
|
|
|
|
|
|
|
|
plotchar(bull,size=size.small,location=location.bottom)
|
|
plot(ff,color=black,linewidth=2)
|
|
plot(ff0,color=green,linewidth=2)
|
|
plot(wma(ff,Length1),color=red,linewidth=2)
|
|
plot(wma(ff,Length2),color=blue,linewidth=2)
|
|
plot(wma(ff,Length1)-wma(ff,Length2),color=green,style=columns)
|
|
|
|
plot(0,linewidth=1,color=black)
|
|
plot(500,linewidth=1,color=red)
|
|
plot(-500,linewidth=1,color=red)
|
|
|
|
```
|
|
|
|
> Detail
|
|
|
|
https://www.fmz.com/strategy/435506
|
|
|
|
> Last Modified
|
|
|
|
2023-12-15 15:47:23
|