
268 lines
9.2 KiB
Markdown
268 lines
9.2 KiB
Markdown
|
|
> Name
|
|
|
|
基于趋势和均线交叉的多功能量化交易策略Trend-and-Moving-Average-Crossover-Based-Multi-Functional-Algorithmic-Trading-Strategy
|
|
|
|
> Author
|
|
|
|
ChaoZhang
|
|
|
|
> Strategy Description
|
|
|
|
|
|
[trans]
|
|
|
|
## 概述
|
|
|
|
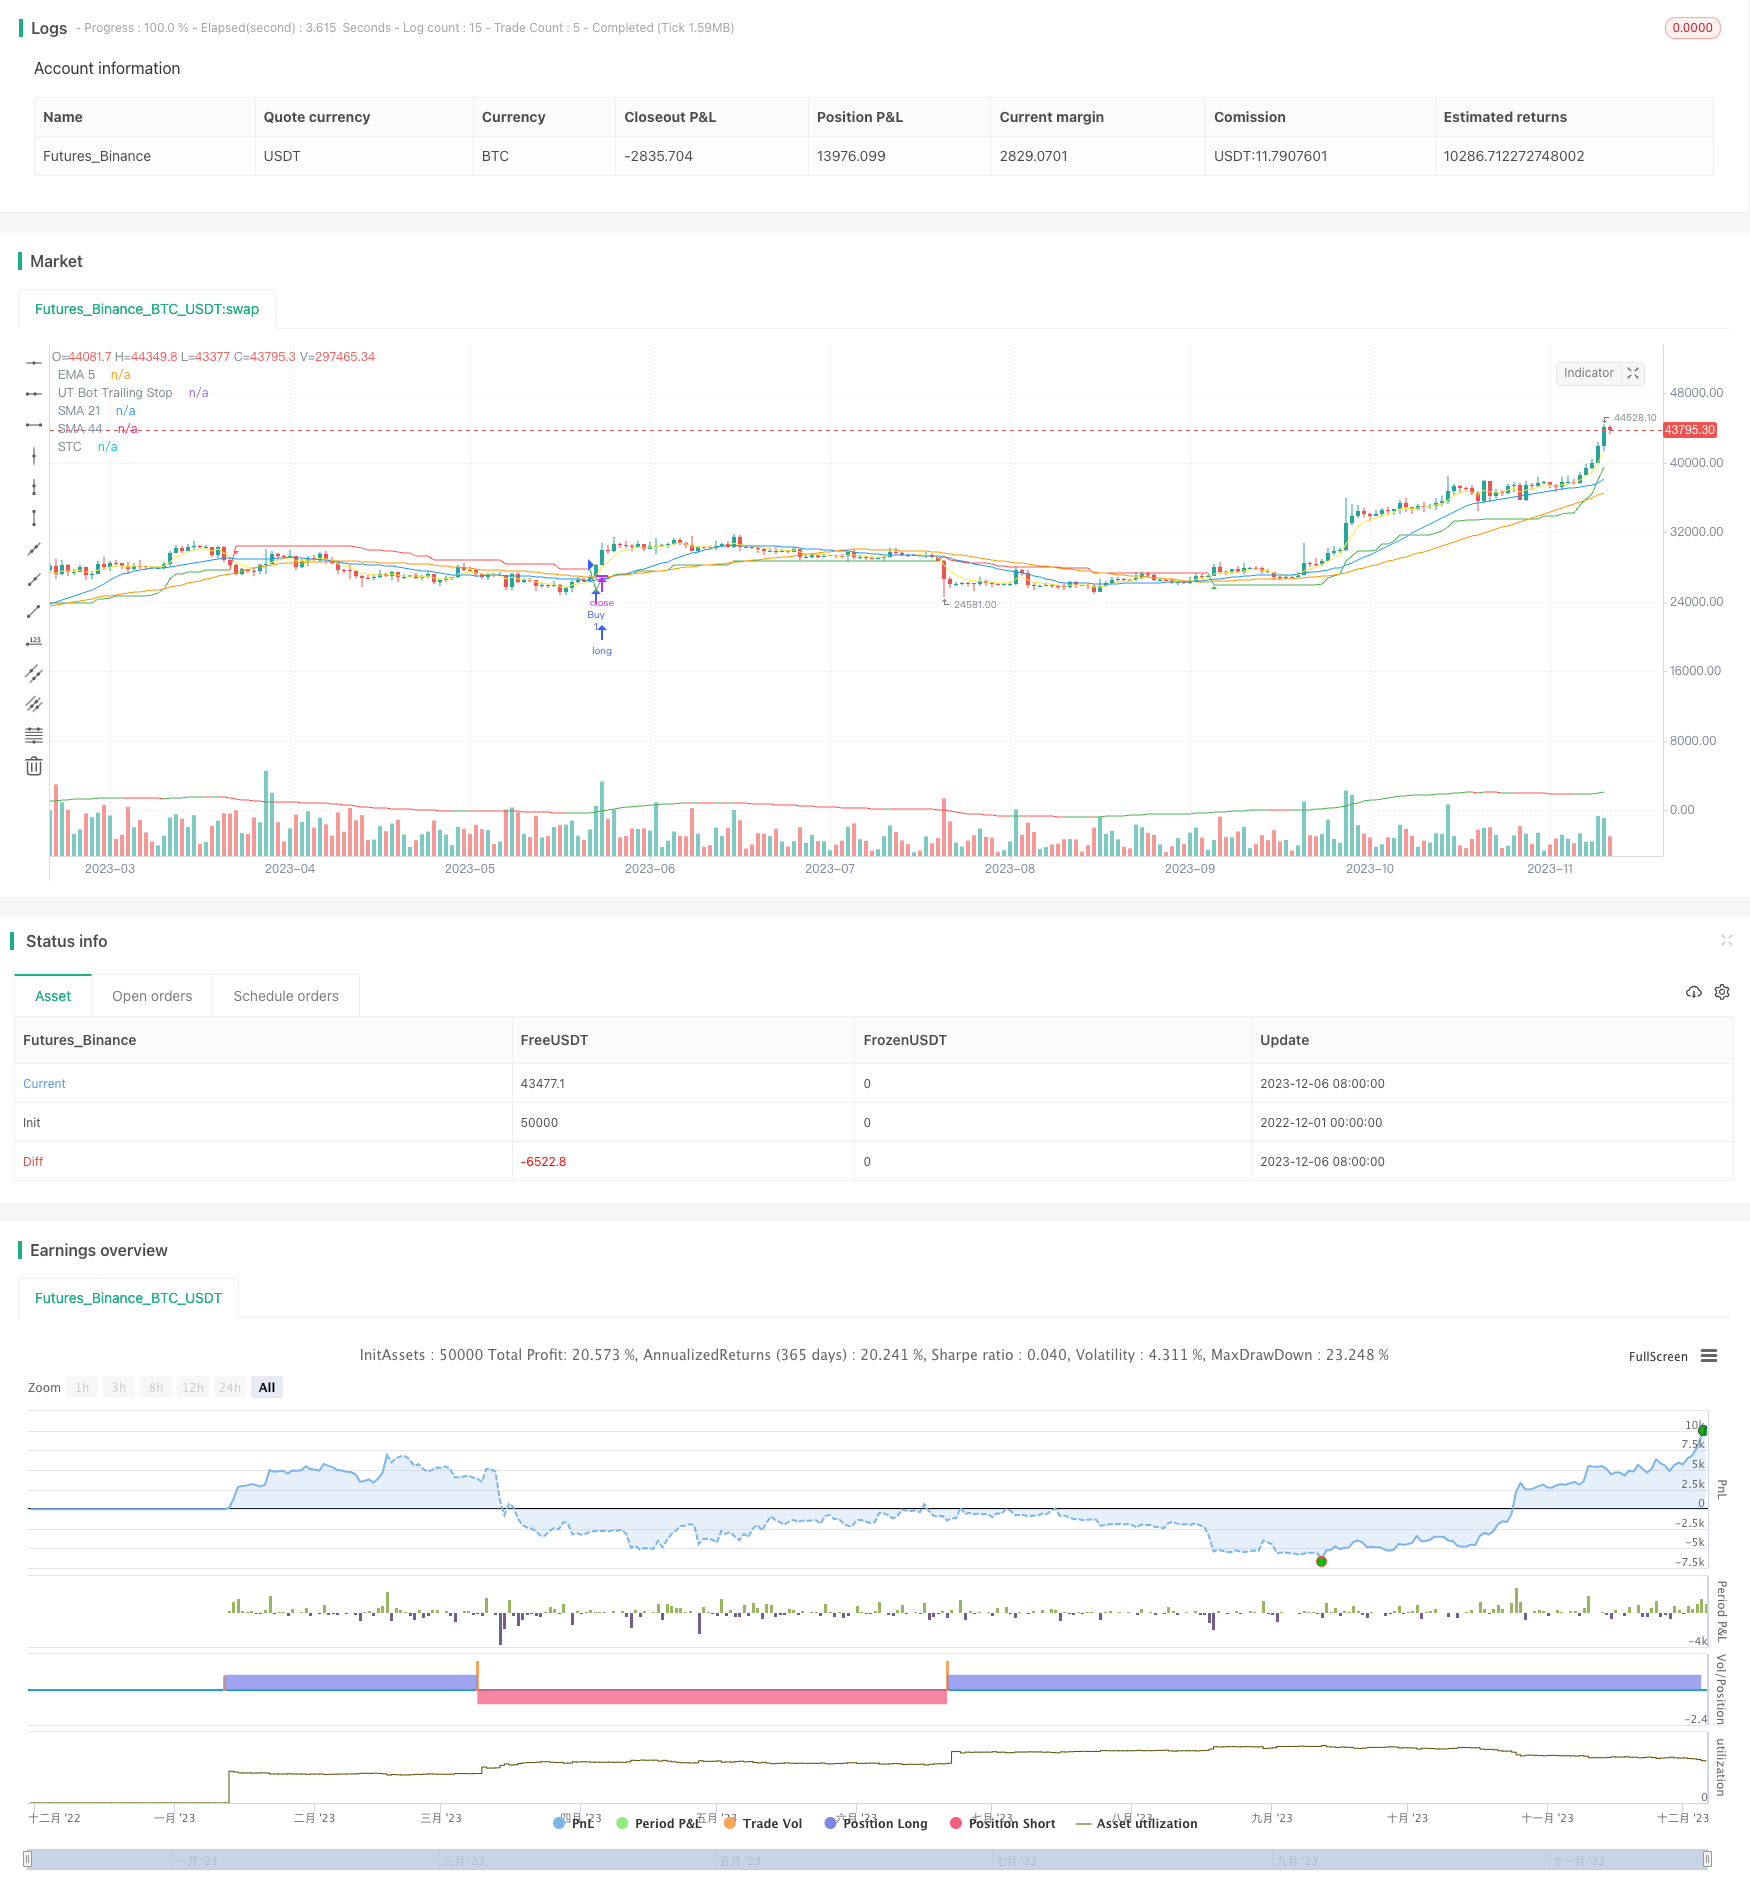
该策略集成了多种技术指标和交易概念,可用于自动生成买入和卖出信号。主要特点是结合趋势分析指标实现优化止损,同时利用均线交叉产生交易信号。
|
|
|
|
## 策略原理
|
|
|
|
### 技术指标
|
|
|
|
- 定制UTSTC指标:基于平均真实波幅实现了一个自适应追踪止损指标,可根据市场波动性调整止损范围。
|
|
|
|
- STC指标:快速简单移动平均线和慢速简单移动平均线的差值,用于判断市场趋势方向和潜在反转点。
|
|
|
|
- 简单移动平均线(SMA)和指数移动平均线(EMA):计算不同周期的移动平均线并绘画,提供额外的趋势判断信息。
|
|
|
|
### 交易信号
|
|
|
|
- 买入信号:当收盘价上穿UTSTC指标并且STC指标处于看涨状态时产生。
|
|
|
|
- 卖出信号:当收盘价下穿UTSTC指标并且STC指标处于看跌状态时产生。
|
|
|
|
## 策略优势
|
|
|
|
- 整合多种指标判断市场趋势,可提高信号准确率。
|
|
|
|
- UTSTC指标根据真实波幅自动调整止损范围,可有效控制每单亏损。
|
|
|
|
- 利用均线交叉产生简单有效的交易信号。
|
|
|
|
- 不同参数设置组合可以适应更多市场环境。
|
|
|
|
## 策略风险
|
|
|
|
- STC等趋势判断指标存在滞后,可能错过短期反转机会。
|
|
|
|
- 均线交叉信号可能产生假信号。
|
|
|
|
- 需要仔细评估各个参数设置,不当组合可能降低盈利或增加亏损。
|
|
|
|
- 止损范围过大可能增加亏损风险,过小可能过早止损。
|
|
|
|
## 优化方向
|
|
|
|
- 测试不同长度周期的STC指标参数,寻找对策略影响最小的设置。
|
|
|
|
- 尝试结合其他指标过滤假信号,如KDJ、MACD等。
|
|
|
|
- 根据回测结果调整止损参数,找到最优参数组合。
|
|
|
|
- 评估不同持仓时间设置,寻找最优持仓周期。
|
|
|
|
## 总结
|
|
|
|
该策略整合趋势判断、自动止损管理和交易信号判断多个模块,形成一个较为全面的量化交易方案。通过参数调优和功能扩展,可望获得稳定的收益。但任何策略都无法完全规避亏损,需要谨慎验证效果并做好风险控制。
|
|
|
|
||
|
|
|
|
## Overview
|
|
|
|
This strategy integrates multiple technical indicators and trading concepts to automatically generate buy and sell signals. The key features are optimizing stops based on trend indicators and triggering trades from moving average crossovers.
|
|
|
|
## Strategy Logic
|
|
|
|
### Technical Indicators
|
|
|
|
- Custom UTSTC indicator: An adaptive trailing stop based on Average True Range to adjust stop loss range according to market volatility.
|
|
|
|
- STC indicator: The difference between fast and slow simple moving averages to determine market trend direction and potential reversal points.
|
|
|
|
- Simple Moving Averages (SMA) and Exponential Moving Averages (EMA): Plotting moving averages of different periods to provide additional trend information.
|
|
|
|
### Trading Signals
|
|
|
|
- Buy signal: Generated when close price crosses above UTSTC line and STC is in bullish state.
|
|
|
|
- Sell signal: Generated when close price crosses below UTSTC line and STC is in bearish state.
|
|
|
|
## Advantages
|
|
|
|
- Integrates multiple indicators to determine market trend, improving signal accuracy.
|
|
|
|
- UTSTC adjusts stops automatically based on true volatility, effectively controlling loss per trade.
|
|
|
|
- Simple and effective trading signals from moving average crosses.
|
|
|
|
- Different parameter combinations accommodate more market environments.
|
|
|
|
|
|
## Risks
|
|
|
|
- Trend indicators like STC may lag and miss short-term reversals.
|
|
|
|
- Moving average crosses may generate false signals.
|
|
|
|
- Careful assessment of parameters required, improper combinations may reduce profits or increase losses.
|
|
|
|
- Stop loss range too wide may increase losses, too tight may stop out early.
|
|
|
|
|
|
## Enhancement Opportunities
|
|
|
|
- Test different STC lengths to find settings with minimal strategy impact.
|
|
|
|
- Incorporate additional filters to reduce false signals e.g. KDJ, MACD.
|
|
|
|
- Optimize stops based on backtest results to find best parameter mix.
|
|
|
|
- Evaluate different holding periods to determine optimal.
|
|
|
|
|
|
## Conclusion
|
|
|
|
This strategy combines trend, automated stops and signal modules into a rather complete algorithmic trading framework. With parameter tuning and feature expansion, stable profits may be achieved but no strategy can fully avoid losses. Proper validation and risk control is still essential.
|
|
|
|
[/trans]
|
|
|
|
> Strategy Arguments
|
|
|
|
|
|
|
|
|Argument|Default|Description|
|
|
|----|----|----|
|
|
|v_input_1|14|Pivot Lookback|
|
|
|v_input_2|3|Bullish OB Extension|
|
|
|v_input_3|3|Bearish OB Extension|
|
|
|v_input_4|5|Swing Length|
|
|
|v_input_5|0|Swing Area: Wick Extremity|Full Range|
|
|
|v_input_6|0.5|Minimum Profit Target|
|
|
|v_input_7|0.5|Maximum Loss Stop|
|
|
|v_input_8|3|UT Bot Key Value|
|
|
|v_input_9|10|UT Bot ATR Period|
|
|
|v_input_10|12|STC Length|
|
|
|v_input_11|26|STC Fast Length|
|
|
|v_input_12|50|STC Slow Length|
|
|
|
|
|
|
> Source (PineScript)
|
|
|
|
``` pinescript
|
|
/*backtest
|
|
start: 2022-12-01 00:00:00
|
|
end: 2023-12-07 00:00:00
|
|
period: 1d
|
|
basePeriod: 1h
|
|
exchanges: [{"eid":"Futures_Binance","currency":"BTC_USDT"}]
|
|
*/
|
|
|
|
//@version=4
|
|
strategy("OB+LQ+UTSTC+SMA+EMA-NORA-MIP21-Jashore-Bangladesh-OneMinuteTF", shorttitle="OB+LS+UTSTC-MIP21-Jashore-Bangladesh-OneMinuteTF", overlay=true)
|
|
|
|
// Order Block + Liquidity Swings [NORA] Settings
|
|
pivot_length = input(14, title="Pivot Lookback")
|
|
bull_ext_last = input(3, title="Bullish OB Extension")
|
|
bear_ext_last = input(3, title="Bearish OB Extension")
|
|
swing_length = input(5, title="Swing Length")
|
|
area = input("Wick Extremity", title="Swing Area", options=["Wick Extremity", "Full Range"])
|
|
min_profit = input(0.5, title="Minimum Profit Target")
|
|
max_loss = input(0.5, title="Maximum Loss Stop")
|
|
|
|
// Variables
|
|
var float bull_ob_price = na
|
|
var float bear_ob_price = na
|
|
var float swing_high = na
|
|
var float swing_low = na
|
|
|
|
// Calculate Order Block Prices
|
|
var float low_lowest = na
|
|
var float high_highest = na
|
|
if bar_index >= pivot_length
|
|
low_lowest := lowest(low, pivot_length)
|
|
high_highest := highest(high, pivot_length)
|
|
bull_ob_price := low_lowest
|
|
bear_ob_price := high_highest
|
|
|
|
// Calculate Swing High/Low Prices
|
|
var float low_lowest_swing = na
|
|
var float high_highest_swing = na
|
|
|
|
if area == "Wick Extremity"
|
|
low_lowest_swing := lowest(low, swing_length)
|
|
high_highest_swing := highest(high, swing_length)
|
|
else
|
|
low_lowest_swing := lowest(high - low, swing_length)
|
|
high_highest_swing := highest(high - low, swing_length)
|
|
|
|
swing_low := low_lowest_swing
|
|
swing_high := high_highest_swing
|
|
|
|
// Trading Logic for Order Block + Liquidity Swings
|
|
buy_liquidity = crossover(close, bull_ob_price) and close > swing_low
|
|
sell_liquidity = crossunder(close, bear_ob_price) and close < swing_high
|
|
|
|
// Plot Buy/Sell Signals for Order Block + Liquidity Swings
|
|
plotshape(series=buy_liquidity, style=shape.labelup, location=location.belowbar, color=color.rgb(39, 166, 175), size=size.small, title="Bullish LQ")
|
|
plotshape(series=sell_liquidity, style=shape.labeldown, location=location.abovebar, color=color.rgb(248, 95, 215), size=size.small, title="Bearish LQ")
|
|
|
|
// UTSTC-SMA-EMA-NORA-New Settings
|
|
keyvalue = input(3, title="UT Bot Key Value", step=0.5)
|
|
atrperiod = input(10, title="UT Bot ATR Period")
|
|
src = close
|
|
|
|
xATR = atr(atrperiod)
|
|
nLoss = keyvalue * xATR
|
|
xATRTrailingStop = 0.0
|
|
xATRTrailingStop := iff(src > nz(xATRTrailingStop[1], 0) and src[1] > nz(xATRTrailingStop[1], 0), max(nz(xATRTrailingStop[1]), src - nLoss),
|
|
iff(src < nz(xATRTrailingStop[1], 0) and src[1] < nz(xATRTrailingStop[1], 0), min(nz(xATRTrailingStop[1]), src + nLoss),
|
|
iff(src > nz(xATRTrailingStop[1], 0), src - nLoss, src + nLoss)))
|
|
pos = 0
|
|
pos := iff(src[1] < nz(xATRTrailingStop[1], 0) and src > nz(xATRTrailingStop[1], 0), 1,
|
|
iff(src[1] > nz(xATRTrailingStop[1], 0) and src < nz(xATRTrailingStop[1], 0), -1, nz(pos[1], 0)))
|
|
xcolor = pos == -1 ? color.red: pos == 1 ? color.green : color.blue
|
|
plot(xATRTrailingStop, color=xcolor, title="UT Bot Trailing Stop")
|
|
|
|
// STC Settings
|
|
stc_length = input(12, title="STC Length")
|
|
fastLength = input(26, title="STC Fast Length")
|
|
slowLength = input(50, title="STC Slow Length")
|
|
fastMA = ema(close, fastLength)
|
|
slowMA = ema(close, slowLength)
|
|
STC = fastMA - slowMA
|
|
STCColor = STC > STC[1] ? color.green : color.red
|
|
plot(STC, color=STCColor, title="STC")
|
|
|
|
// Add SMAs
|
|
sma21 = sma(close, 21)
|
|
sma44 = sma(close, 44)
|
|
plot(sma21, color=color.blue, title="SMA 21")
|
|
plot(sma44, color=color.orange, title="SMA 44")
|
|
|
|
// Add EMA
|
|
ema5 = ema(close, 5)
|
|
plot(ema5, color=color.yellow, title="EMA 5")
|
|
|
|
// Combined Strategy
|
|
buySignal = crossover(src, xATRTrailingStop) and STC < 25 and STCColor == color.green
|
|
sellSignal = crossunder(src, xATRTrailingStop) and STC > 75 and STCColor == color.red
|
|
|
|
// Plot Buy and Sell signals as triangles
|
|
plotshape(series=buySignal, title="Buy Signal", location=location.belowbar, color=color.green, style=shape.triangleup, size=size.small)
|
|
plotshape(series=sellSignal, title="Sell Signal", location=location.abovebar, color=color.red, style=shape.triangledown, size=size.small)
|
|
|
|
strategy.entry("Buy", strategy.long, when=buySignal)
|
|
strategy.entry("Sell", strategy.short, when=sellSignal)
|
|
|
|
|
|
```
|
|
|
|
> Detail
|
|
|
|
https://www.fmz.com/strategy/434687
|
|
|
|
> Last Modified
|
|
|
|
2023-12-08 12:14:50
|