
6.6 KiB
Name
基于趋势分析指数的量化交易策略Quantitative-Trading-Strategy-Based-on-Trend-Analysis-Index
Author
ChaoZhang
Strategy Description
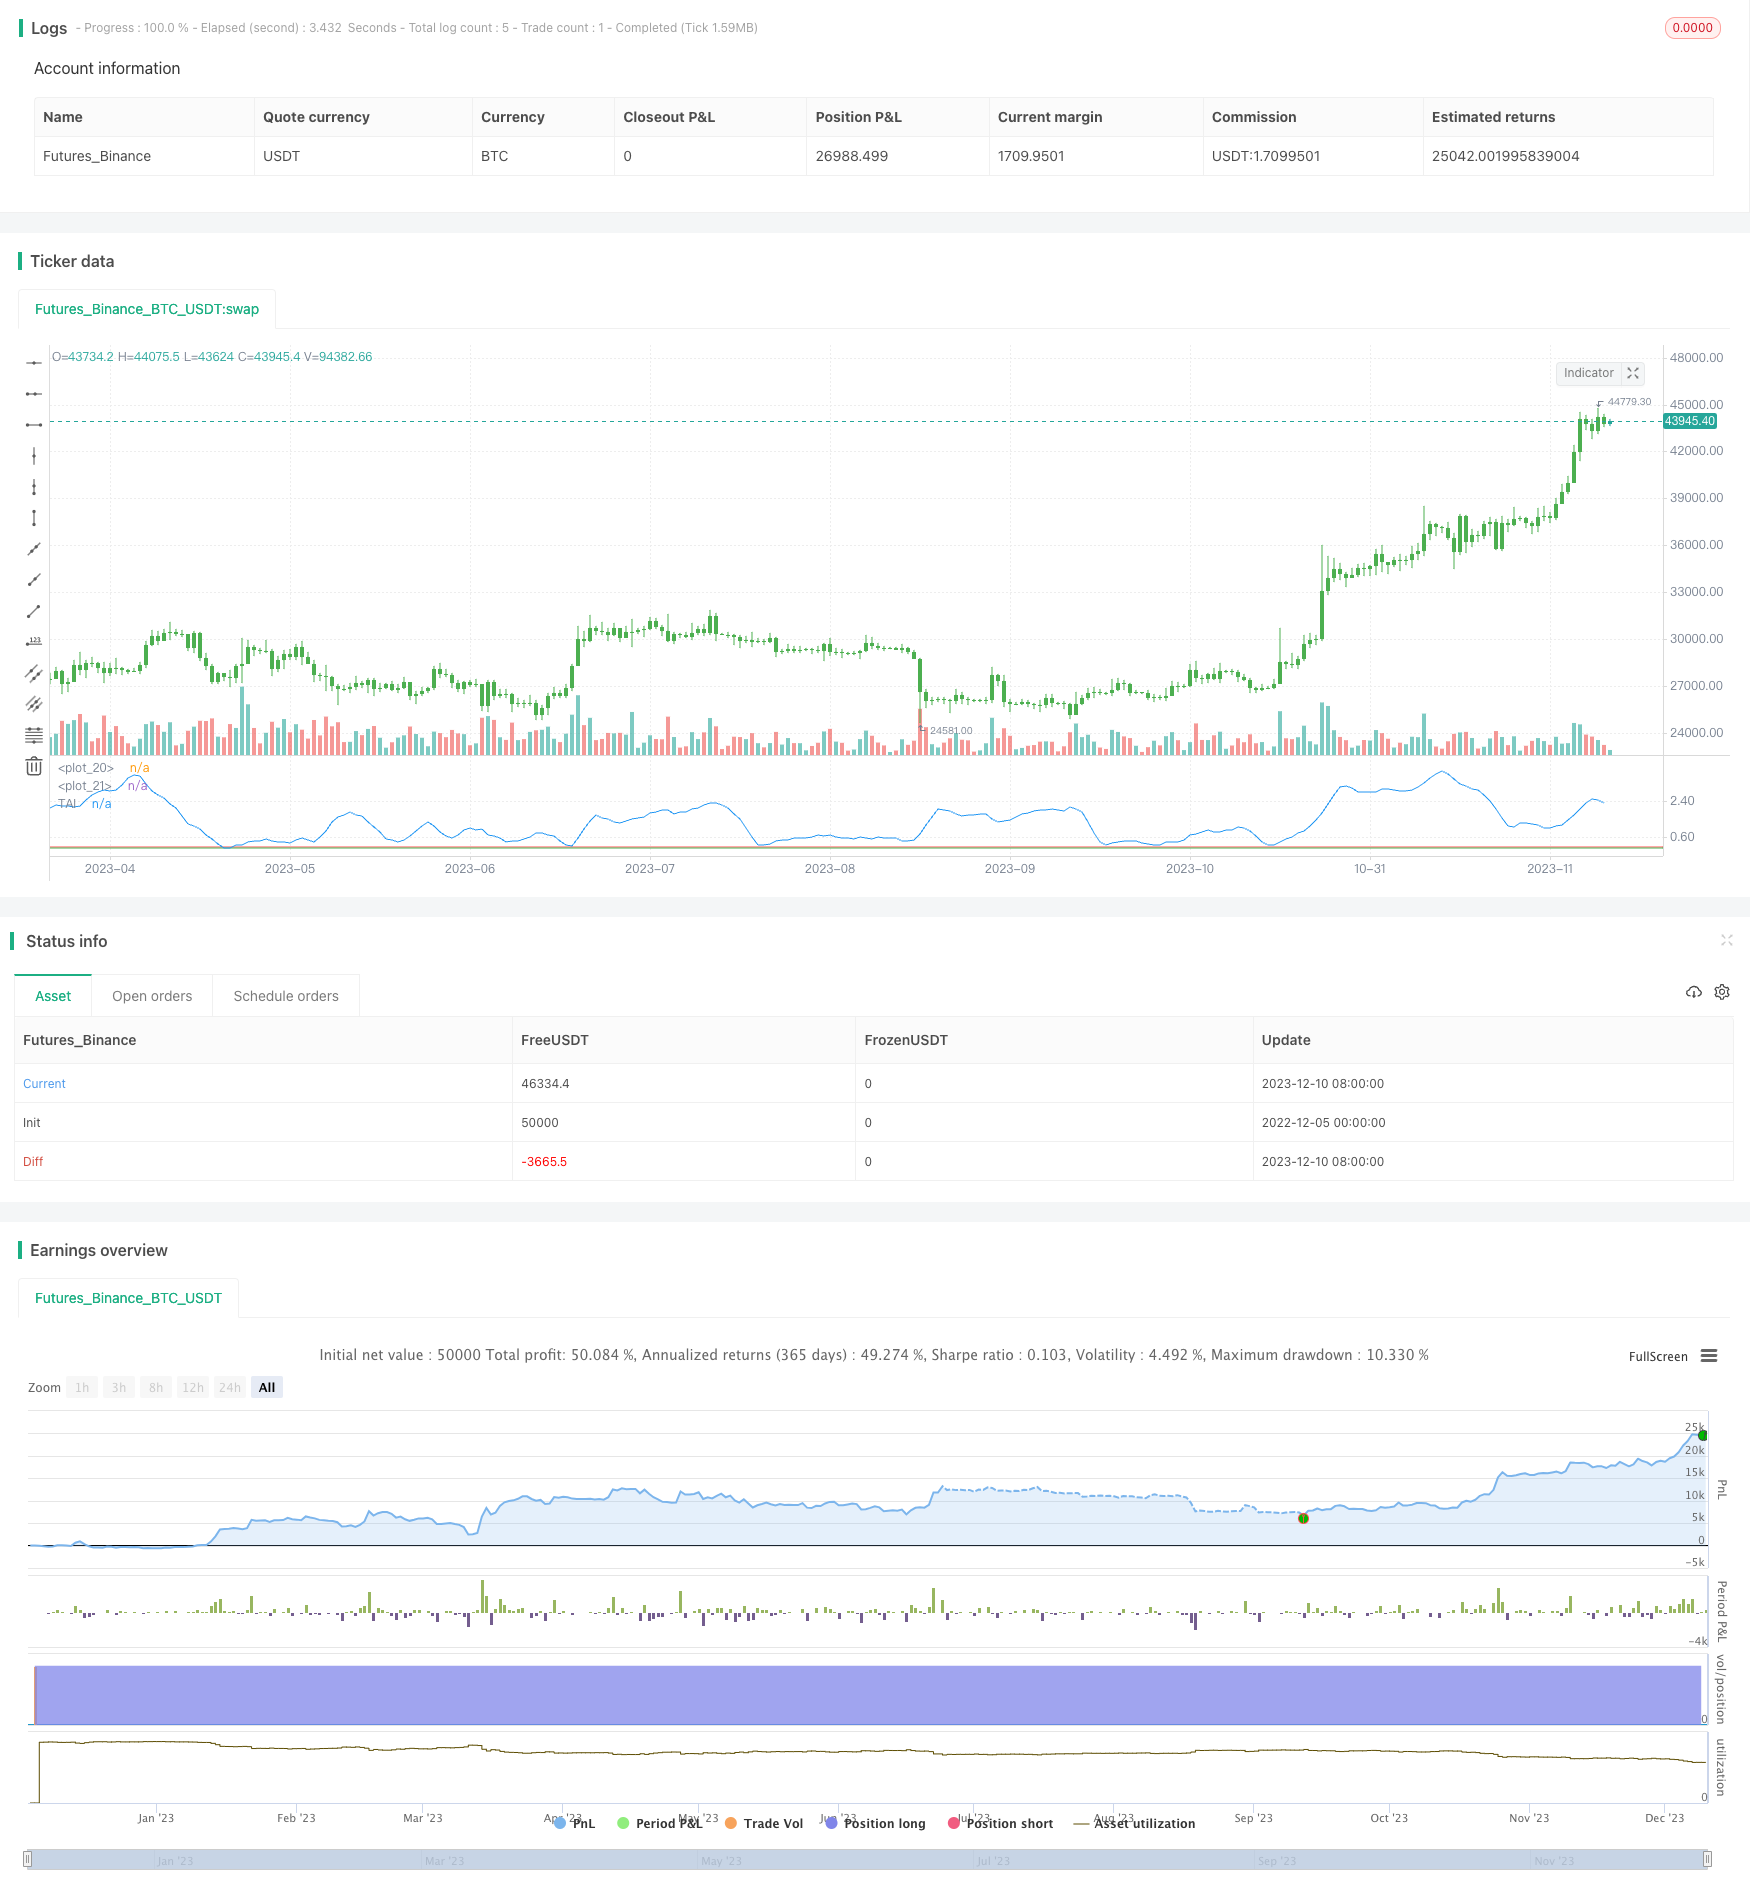 [trans]
概述
该策略的核心思想是利用移动平均线的斜率判断市场趋势,构建趋势分析指数(Trend Analysis Index,TAI)作为交易信号。当价格在趋势中运行时,移动平均线斜率增大;当价格在无明确趋势的区间内震荡时,移动平均线斜率减小。趋势分析指数增大表明进入趋势,减小表示趋势结束。
策略原理
该策略首先计算价格的简单移动平均线(X日移动平均线)。然后计算该移动平均线过去Y日的最高值和最低值,通过这两个extrema值计算移动平均线在过去Y日的波动范围。最后,通过将该Y日波动范围与价格比较,转换为0-1之间的标准化指标,即构建趋势分析指数。当指数高于某阈值时做多,低于某阈值时做空。
优势分析
该策略具有如下优势:
- 通过移动平均线斜率判断趋势运行情况,可有效捕捉中长线趋势
- 结合波动范围标准化,构建指数化指标,使交易信号更清晰
- 可自定义移动平均线参数及趋势判断的参数,适应不同市场环境
- 可选择反向交易,可用于跟踪或对冲其他策略
风险分析
该策略也存在一定风险:
- 在震荡盘整中,容易产生错误信号
- 移动平均线参数设置不当可能错过趋势转换点
- 标准化参数设置不当可能错过较弱的趋势
- 反向交易时,亏损可能加大
对应解决方法:
- 结合其他指标过滤信号
- 优化参数,找到最佳参数组合
- 调整标准化参数的上下阈值
- 谨慎使用反向交易功能
优化方向
该策略可从以下几个方面进行优化:
- 结合其他指标判断趋势,如BOLL通道等,使交易信号更可靠
- 添加止损策略,以控制单笔亏损
- 优化移动平均线的日数参数,使其更符合不同周期下的市场特征
- 训练最优的标准化参数,找到最佳的参数阈值
- 添加机器学习模型预测趋势概率,辅助交易
总结
该策略整体来说是通过移动平均线斜率判断趋势的中长线策略,可有效捕捉趋势,但也存在一定的假信号风险。通过与其他指标组合使用、加入止损、参数优化等手段可以使策略更加稳健可靠,本质上仍是一个比较简单的趋势跟踪策略。
||
Overview
The core idea of this strategy is to use the slope of moving average to judge market trend and construct a Trend Analysis Index (TAI) as trading signal. When price is trending, the slope of moving average increases. When price is ranging in a trendless zone, the slope of moving average decreases. The increase of Trend Analysis Index indicates the start of a trend while the decrease means the end of the trend.
Strategy Logic
The strategy first calculates the Simple Moving Average (X-day MA) of price. Then it computes the highest and lowest value of this moving average in the last Y days to get the fluctuation range. Finally, by comparing this Y-day range with price, it converts to a standardized indicator between 0-1, namely the Trend Analysis Index. Taking long position when index is above a threshold and short position when below another threshold.
Advantage Analysis
The advantages of this strategy are:
- Effectively catching mid- to long-term trends by judging slope of MA
- Constructing standardized index for clearer trading signal
- Customizable MA and trend judgment parameters for different market environments
- Choosable reverse trading for tracking or hedging other strategies
Risk Analysis
There are also some risks:
- Prone to wrong signals during range-bound market
- Missing trend reversal points if MA parameters set inappropriately
- Missing weak trends if standardization parameters set inappropriately
- Increased loss on reverse trading
Solutions:
- Filter signals with other indicators
- Optimize parameters to find best combination
- Adjust threshold of standardization parameters
- Carefully use reverse trading
Optimization Directions
The strategy can be optimized in following aspects:
- Combine other indicators like BOLL to make signals more reliable
- Add stop loss to control single loss
- Optimize MA days to fit characteristics in different timeframes
- Train optimal threshold parameters
- Add ML model for trend probability to assist trading
Conclusion
In summary, this is a mid- to long-term trend following strategy based on the slope of moving average. It can effectively capture trends but also has some false signal risks. By combining with other indicators, adding stop loss, parameter optimization etc, the strategy can be more robust. Essentially it is still a simple trend tracking strategy.
[/trans]
Strategy Arguments
| Argument | Default | Description |
|---|---|---|
| v_input_1 | 28 | AvgLen |
| v_input_2 | 5 | TAILen |
| v_input_3 | 0.11 | TopBand |
| v_input_4 | 0.02 | LowBand |
| v_input_5 | false | Trade reverse |
Source (PineScript)
//@version=2
////////////////////////////////////////////////////////////
//  Copyright by HPotter v1.0 21/12/2017
// In essence, it is simply the standard deviation of the last x bars of a
// y-bar moving average. Thus, the TAI is a simple trend indicator when prices
// trend with authority, the slope of the moving average increases, and when
// prices meander in a trendless range, the slope of the moving average decreases.
//
// You can change long to short in the Input Settings
// WARNING:
// - For purpose educate only
// - This script to change bars colors.
////////////////////////////////////////////////////////////
strategy(title="Trend Analysis Index", shorttitle="TAI")
AvgLen = input(28, minval=1)
TAILen = input(5, minval=1)
TopBand = input(0.11, step=0.01)
LowBand = input(0.02, step=0.01)
reverse = input(false, title="Trade reverse")
hline(TopBand, color=red, linestyle=line)
hline(LowBand, color=green, linestyle=line)
xPrice = close
xSMA = sma(xPrice, AvgLen)
xHH = highest(xSMA, TAILen)
xLL = lowest(xSMA, TAILen)
nRes = (xHH - xLL) * 100 / xPrice
pos = iff(nRes > TopBand, 1,
       iff(nRes < LowBand, -1, nz(pos[1], 0)))
possig = iff(reverse and pos == 1, -1,
          iff(reverse and pos == -1, 1, pos))
if (possig == 1)
    strategy.entry("Long", strategy.long)
if (possig == -1)
    strategy.entry("Short", strategy.short)
barcolor(possig == -1 ? red: possig == 1 ? green : blue )
plot(nRes, color=blue, title="TAI")
Detail
https://www.fmz.com/strategy/435084
Last Modified
2023-12-12 10:40:52