
12 KiB
Name
基于相对强弱指标RSI策略Momentum-Reversal-RSI-Strategy
Author
ChaoZhang
Strategy Description
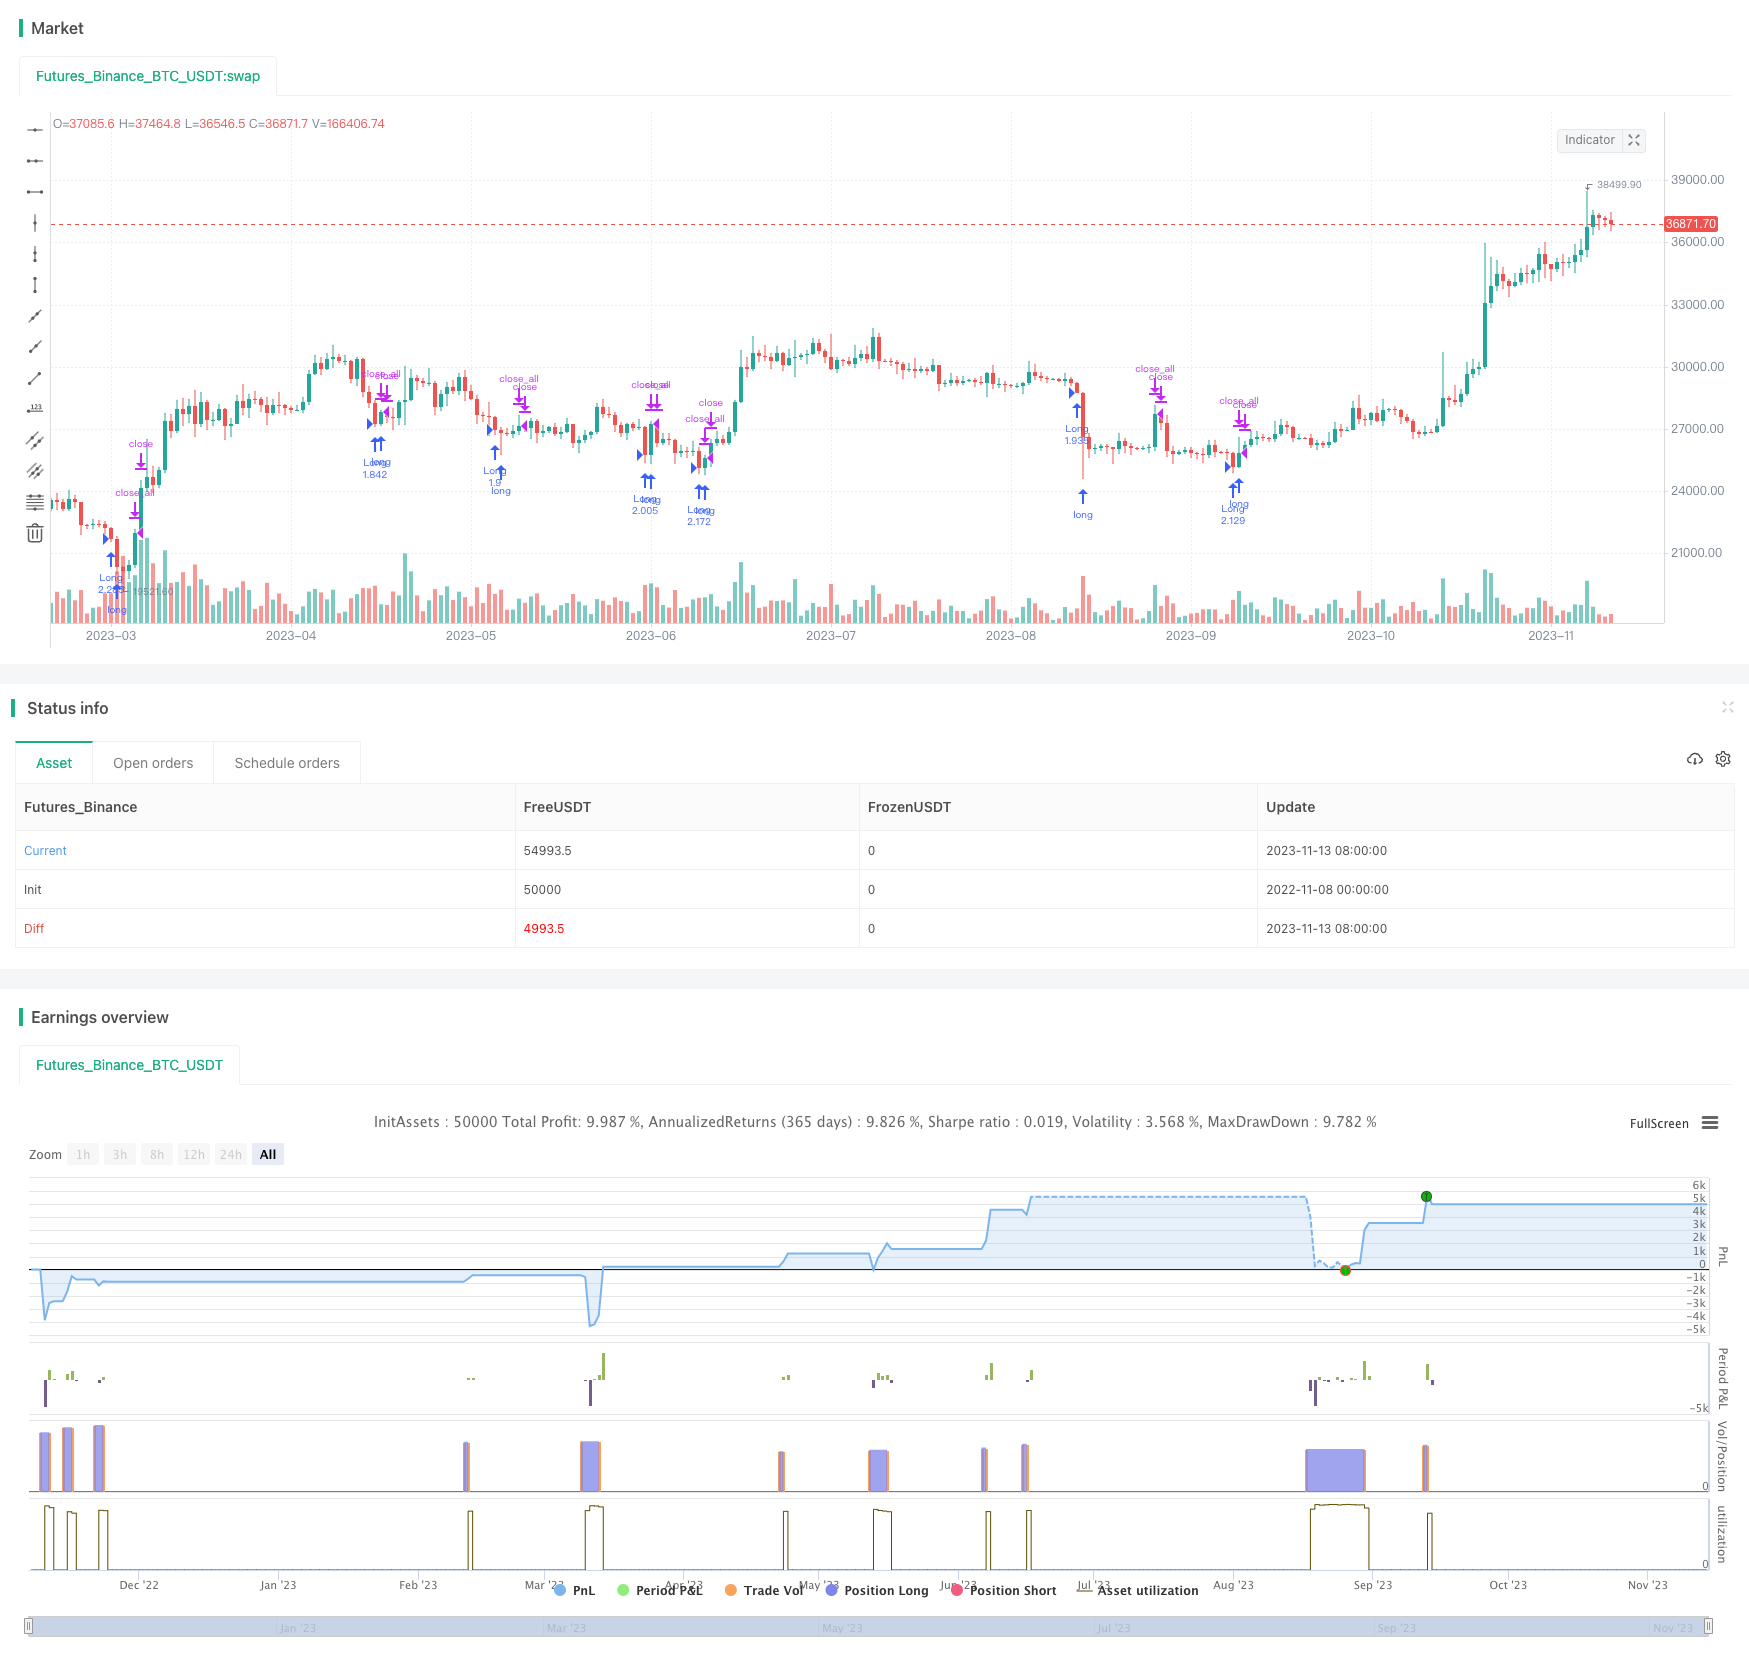 [trans]
概述
该策略是一个基于相对强弱指标(RSI)的短线交易策略。它利用RSI指标识别超买超卖区间,并结合K线实体过滤虚假信号,在反转点进行买入和卖出操作。策略追求捕捉极端超买超卖状态后的反弹机会。
策略详解
原理
首先计算RSI指标,选取收盘价作为计算数据源,周期设定为7日。然后设置超买线为30和超卖区间为70。当RSI上穿30线时产生买入信号,下穿70线时产生卖出信号。
为了过滤虚假信号,要求K线实体放大为常规的1-3倍大小时才会触发交易信号。这里使用RSI 1-5根K线连续处于超买超卖区间来确认信号,实体放大倍数设定为4倍。
当RSI连续5根K线低于30时产生买入信号,若随后K线收阳线,实体放大超过4倍,则执行买入操作。当RSI连续5根K线高于70时产生卖出信号,若随后K线收阴线,实体放大超过4倍,则执行卖出操作。
为锁定利润,当持仓方向与当前K线方向一致时,在实体放大2倍的情况下平仓止损。
优势
- 捕捉超买超卖后的反弹机会
RSI指标能较好地识别超买超卖状态。当股票处于超买超卖区间时,短期内存在回落概率较大,而超卖区间往往预示着即将出现的反弹行情。该策略能在反转前夕捕捉机会。
- 实体过滤减少虚假信号
单纯RSI指标交易时可能存在较多假信号。该策略加入K线实体放大作为过滤条件,在反转拐点前夕出现放大实体K线时加入仓位,避免被震荡市场的假信号误导。
- 连续N根K线确认提高可靠性
要求RSI持续1-5根K线处于超买超卖区间进行确认,避免被个别异动K线误导,提高信号的可靠性。
- 实体放大倍数可调节
实体放大倍数可根据不同品种调整,对于大涨大跌型品种可以适当放宽条件,而对于波动平缓品种则可适当收紧,可自由调整适合自己的交易品种。
风险
- 可能存在过拟合问题
该策略参数设置具有一定程度的局限性,不同品种和不同时期需要调整参数。如果固定使用一个参数设置,则可能导致过拟合问题。
- 买卖点识别准确率不高
RSI指标本身存在一定程度滞后性,结合实体放大作为过滤条件也会提前一定幅度退出仓位。所以买卖点识别准确率一般情况下不会特别高。
- 震荡行情中可能持仓时间过长
在震荡行情中,RSI指标可能频繁触发买卖信号从而造成持仓时间过长。这时需要调整参数或暂停策略运行。
- 需适当调整持仓策略
该策略为短线交易策略,需要配合适当的持仓策略,如移除均线、止损止盈等方法,来锁定利润和控制风险。
优化思路
- 测试不同参数设置
可以测试不同的RSI参数组合,如周期、超买超卖线、以及K线实体过滤参数,优化参数以适应不同品种。
- 增加止损止盈策略
可以设置移动止损或百分比止损来锁定利润,也可以根据ATR值设置止损点,或者结合Donchain通道进行止损。
- 结合其他指标过滤
可以加入MACD,KDJ等其他指标的过滤条件,避免在无效突破时产生错误信号。也可以利用波动率指标来识别趋势中的反转信号。
- 增加趋势判断
采用均线判断趋势方向,只在趋势方向一致时考虑交易信号,在震荡行情时可以选择暂停策略。也可以结合趋势强弱指标过滤信号。
总结
该RSI反转策略整体是一个典型的短线交易策略,具有一定的优势和风险。主要优势在于能够捕捉超买超卖后的反弹,而风险主要来自信号精确度不高以及震荡行情下持仓时间过长。我们可以通过调整参数组合、增加过滤条件、优化止损策略等方式来对策略进行改进,使之能够适应更多不同的品种和行情环境,从而获得更稳定的策略收益。
||
Overview
This is a short-term trading strategy based on the Relative Strength Index (RSI) indicator. It utilizes RSI to identify overbought and oversold levels and combines candlestick filtering to avoid false signals, entering long and short positions at reversal points. The strategy aims to capture mean-reversion opportunities after extreme overbought or oversold conditions.
Strategy Explanation
Logic
Firstly, the RSI indicator is calculated based on the closing price with a period set to 7. The overbought level is set at 70 and the oversold level is set at 30. Buy signals are generated when RSI crosses above 30 and sell signals are generated when RSI crosses below 70.
To filter out false signals, the candlestick body size needs to expand to 1-3 times of the normal range when a trading signal is triggered. Here the strategy requires 1-5 consecutive RSI bars staying in overbought or oversold levels to confirm the signal, with body expansion set to 4 times.
When RSI stays below 30 for 5 consecutive bars, a long signal is generated. If the next candle shows a bullish body expanded more than 4 times, a long position will be executed. When RSI stays above 70 for 5 consecutive bars, a short signal is generated. If the next candle shows a bearish body expanded more than 4 times, a short position will be executed.
To lock in profits, positions will be closed when the current candle direction is consistent with the position direction and the body expands 2 times.
Advantages
- Capturing mean-reversion after extreme levels
RSI is good at identifying overbought and oversold conditions. When a stock reaches extreme levels, there is high probability of a pullback, and extreme levels often imply an impending reversal. This strategy is able to capture such opportunities at turning points.
- Candlestick filtering decreases false signals
Trading purely based on RSI signals may result in many false signals. This strategy incorporates candlestick body expansion as a filter, entering positions when an enlarged body appears around reversal points, avoiding whipsaws from chaotic markets.
- Consecutive RSI bars increase reliability
Requiring 1-5 consecutive RSI bars in overbought or oversold zone acts as a confirmation, avoiding false signals from occasional aberrant bars and improving signal reliability.
- Flexible body expansion multiplier
The body expansion multiplier can be adjusted for different products. For stocks with large swings, the criteria can be relaxed, while for stocks with narrow ranges, it can be tightened. This allows flexible adjustments for different trading products.
Risks
- Potential overfitting
The parameter settings have some inherent limitations. Different products and time periods may require parameter tuning. Using fixed settings may lead to overfitting issues.
- Low accuracy in identifying turns
RSI itself has some lagging properties. Combining with body expansion exits positions prematurely. So the accuracy of catching exact bottoms or tops is generally not very high.
- Potentially long holding period in ranging markets
In ranging markets, RSI may trigger frequent buy and sell signals, resulting in long holding periods. Parameters should be adjusted or the strategy should be temporarily stopped in such cases.
- Need proper position sizing strategies
As a short-term trading strategy, proper position sizing strategies should be combined, such as moving stop loss, take profit, etc, to lock in profits and control risks.
Improvement Ideas
- Test different parameter sets
Different combinations of RSI parameters can be tested, such as period, overbought/oversold levels, and candlestick filters, to find optimized parameters for different products.
- Add stop loss and take profit
Moving or percentage stop loss can be added to lock in profits. Or set stop loss based on ATR values or Donchain channels etc.
- Combine other indicators as filters
Conditions based on MACD, KDJ and other indicators can be added to avoid wrong signals from invalid breakouts. Volatility indicators can also help identify reversal signals in trends.
- Add trend bias
Use moving averages to gauge trend bias. Only consider trading signals that align with the trend. The strategy can be paused during range-bound markets. Trend strength indicators can also be used as filters.
Conclusion
In summary, this RSI reversal strategy is a typical short-term trading strategy with its own pros and cons. The main advantage lies in capturing pullbacks after extremes while the main risk comes from low signal precision and long holding periods in ranges. We can improve the strategy by adjusting parameters, adding filters, optimizing stops, etc, to adapt to more products and market conditions, and achieve more steady results.
[/trans]
Strategy Arguments
| Argument | Default | Description |
|---|---|---|
| v_input_1 | 7 | RSI Period |
| v_input_2 | 30 | RSI limit |
| v_input_3_close | 0 | RSI Price: close |
| v_input_4 | true | RSI Bars |
| v_input_5 | 2018 | From Year |
| v_input_6 | 2038 | To Year |
| v_input_7 | true | From Month |
| v_input_8 | 12 | To Month |
| v_input_9 | true | From day |
| v_input_10 | 31 | To day |
Source (PineScript)
/*backtest
start: 2022-11-08 00:00:00
end: 2023-11-14 00:00:00
period: 1d
basePeriod: 1h
exchanges: [{"eid":"Futures_Binance","currency":"BTC_USDT"}]
*/

//@version=3
strategy(title = "Noro's FRSI Strategy v1.21", shorttitle = "FRSI str 1.21", overlay = true, default_qty_type = strategy.percent_of_equity, default_qty_value = 100, pyramiding = 0, commission_type = strategy.commission.percent, commission_value = 0.0)

//Settings
rsiperiod = input(7, defval = 7, minval = 2, maxval = 50, title = "RSI Period")
limit = input(30, defval = 30, minval = 1, maxval = 100, title = "RSI limit")
rsisrc = input(close, defval = close, title = "RSI Price")
rb = input(1, defval = 1, minval = 1, maxval = 5, title = "RSI Bars")
sps = 0
fromyear = input(2018, defval = 2018, minval = 1900, maxval = 2100, title = "From Year")
toyear = input(2038, defval = 2018, minval = 1900, maxval = 2100, title = "To Year")
frommonth = input(01, defval = 01, minval = 01, maxval = 12, title = "From Month")
tomonth = input(12, defval = 12, minval = 01, maxval = 12, title = "To Month")
fromday = input(01, defval = 01, minval = 01, maxval = 31, title = "From day")
today = input(31, defval = 31, minval = 01, maxval = 31, title = "To day")

//Fast RSI
fastup = rma(max(change(rsisrc), 0), rsiperiod)
fastdown = rma(-min(change(rsisrc), 0), rsiperiod)
fastrsi = fastdown == 0 ? 100 : fastup == 0 ? 0 : 100 - (100 / (1 + fastup / fastdown))

//Limits
bar = close > open ? 1 : close < open ? -1 : 0
uplimit = 100 - limit
dnlimit = limit

//RSI Bars
ur = fastrsi > uplimit
dr = fastrsi < dnlimit
uprsi = rb == 1 and ur ? 1 : rb == 2 and ur and ur[1] ? 1 : rb == 3 and ur and ur[1] and ur[2] ? 1 : rb == 4 and ur and ur[1] and ur[2] and ur[3] ? 1 : rb == 5 and ur and ur[1] and ur[2] and ur[3] and ur[4] ? 1 : 0
dnrsi = rb == 1 and dr ? 1 : rb == 2 and dr and dr[1] ? 1 : rb == 3 and dr and dr[1] and dr[2] ? 1 : rb == 4 and dr and dr[1] and dr[2] and dr[3] ? 1 : rb == 5 and dr and dr[1] and dr[2] and dr[3] and dr[4] ? 1 : 0

//Body
body = abs(close - open)
emabody = ema(body, 30)

//Signals
up = bar == -1 and sps == 0 and dnrsi and body > emabody / 4
dn = bar == 1 and sps == 0 and uprsi and body > emabody / 4
exit = bar == 1 and fastrsi > dnlimit and body > emabody / 2

//Trading
if up
    strategy.entry("Long", strategy.long, when=(time > timestamp(fromyear, frommonth, fromday, 00, 00) and time < timestamp(toyear, tomonth, today, 00, 00)))
    sps := 1

if time > timestamp(toyear, tomonth, today, 00, 00) or exit
    strategy.close_all()
    sps := 0
Detail
https://www.fmz.com/strategy/432219
Last Modified
2023-11-15 16:29:25