
204 lines
11 KiB
Markdown
204 lines
11 KiB
Markdown
|
|
> Name
|
|
|
|
基于玻林格带与蜡烛图形态的高级趋势交易策略-Advanced-Trend-Trading-Strategy-Based-on-Bollinger-Bands-and-Candlestick-Patterns
|
|
|
|
> Author
|
|
|
|
ChaoZhang
|
|
|
|
> Strategy Description
|
|
|
|
|
|
|
|
[trans]
|
|
#### 概述
|
|
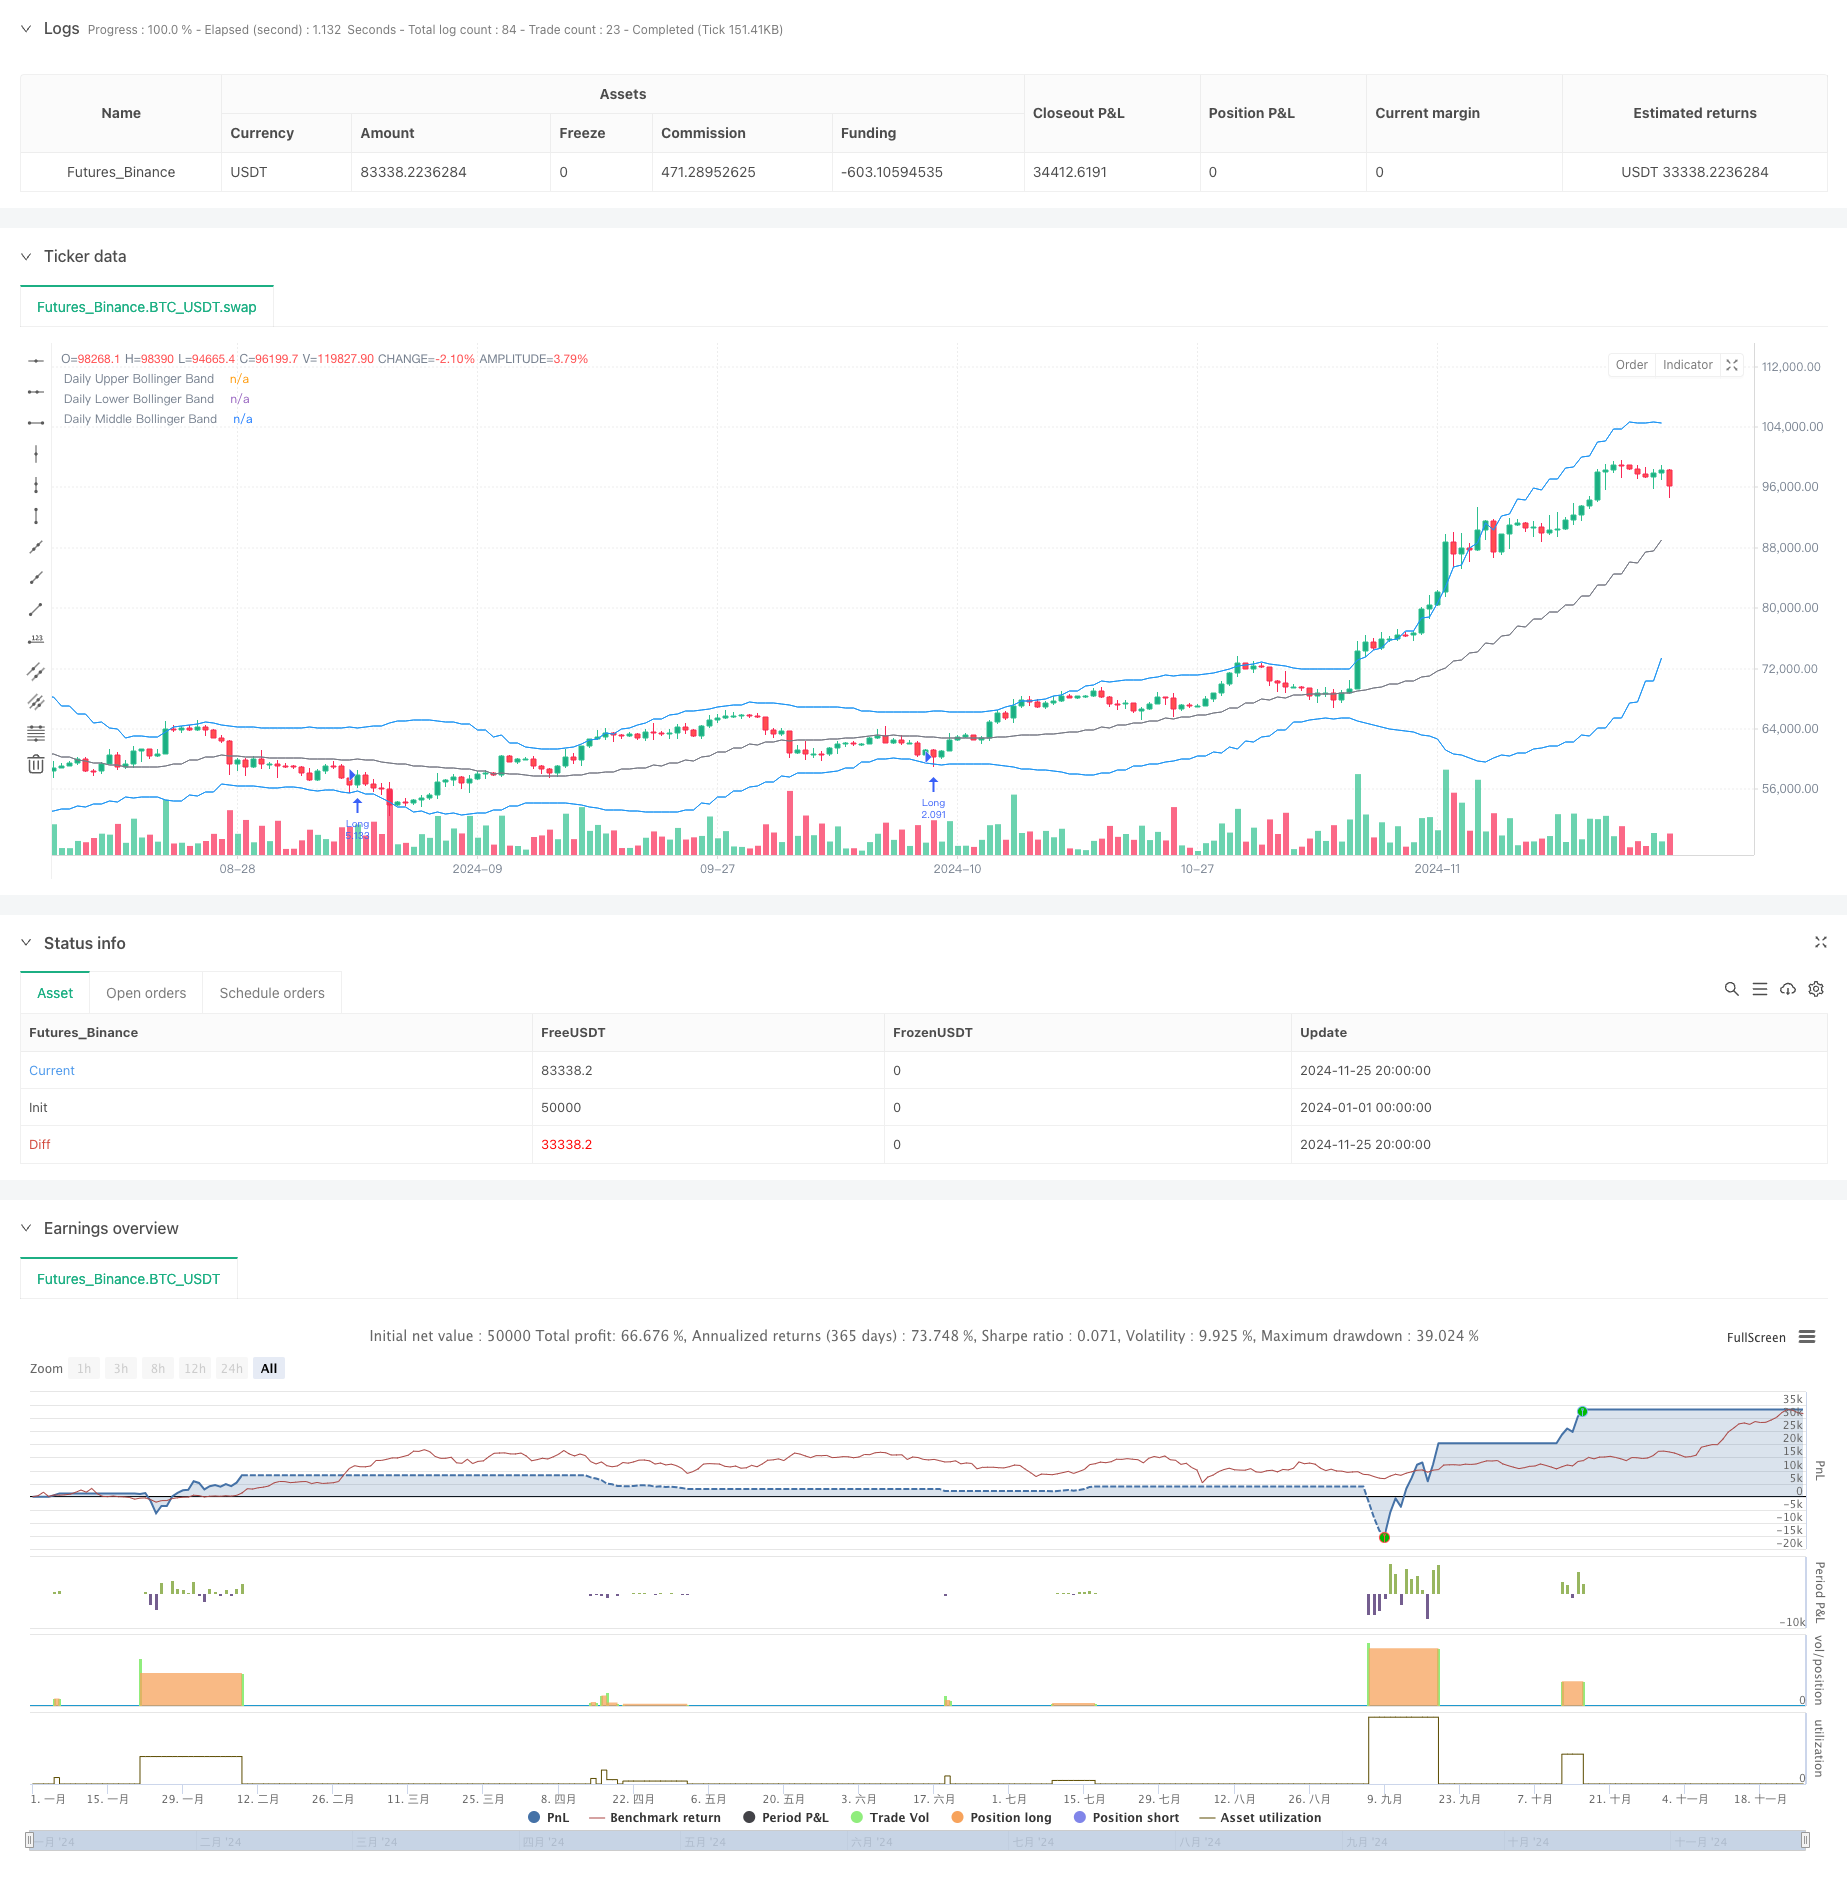
这是一个基于玻林格带与蜡烛图形态分析的趋势跟踪策略。策略主要通过观察价格触及玻林格带时的蜡烛图形态特征,结合上下引线与实体的比率关系来判断市场可能的反转点。同时,策略采用了固定风险模型来控制每笔交易的风险敞口,并通过多重时间周期分析来提高交易的准确性。
|
|
|
|
#### 策略原理
|
|
策略的核心逻辑基于以下几个关键要素:首先,通过计算20周期的玻林格带来确定价格波动的范围;其次,在价格触及玻林格带时,分析蜡烛图的上下引线与实体的比率,当比率超过设定阈值时,视为潜在的反转信号;第三,通过计算关键支撑位和阻力位来设置止损点位;最后,根据账户总额的固定比例(1%)来计算每笔交易的持仓量,实现风险的动态管理。该策略还提供了多种入场时机选择,包括收盘价、开盘价、日内最高价和最低价等。
|
|
|
|
#### 策略优势
|
|
1. 风险控制精确:采用固定比例风险管理模型,确保每笔交易的风险敞口都在可控范围内
|
|
2. 入场点位灵活:提供多种入场价格选择,能够适应不同的交易风格
|
|
3. 技术指标结合:将玻林格带与蜡烛图形态分析相结合,提高信号的可靠性
|
|
4. 止损设置合理:通过关键支撑阻力位设置止损,符合市场运行规律
|
|
5. 交易管理完善:包含订单到期机制,避免过期信号带来的误操作
|
|
|
|
#### 策略风险
|
|
1. 市场快速波动风险:在剧烈波动市场中,引线比率可能产生虚假信号
|
|
2. 资金管理风险:固定比例风险模型在连续亏损情况下可能导致仓位过小
|
|
3. 止损设置风险:支撑阻力位的计算可能在某些市场条件下不够准确
|
|
4. 时间周期依赖:策略主要基于日线级别,可能错过更小时间框架的机会
|
|
|
|
#### 策略优化方向
|
|
1. 引入成交量指标:可以通过在信号确认时增加成交量分析,提高信号的可靠性
|
|
2. 优化止损机制:考虑引入动态止损,根据市场波动度自动调整止损距离
|
|
3. 增加市场环境过滤:添加趋势强度指标,在不同市场环境下调整策略参数
|
|
4. 完善仓位管理:考虑引入动态仓位管理机制,根据市场波动性调整风险敞口
|
|
5. 增加时间过滤:可以添加时间过滤器,避免在市场波动较大的时段交易
|
|
|
|
#### 总结
|
|
该策略通过将经典的技术分析工具与现代风险管理方法相结合,构建了一个相对完善的交易系统。策略的核心优势在于其严格的风险控制和灵活的入场机制,但同时也需要在实际应用中注意市场环境的变化和信号的可靠性验证。通过建议的优化方向,策略还有进一步提升的空间,特别是在信号过滤和风险管理方面。 ||
|
|
|
|
#### Overview
|
|
This is a trend-following strategy based on Bollinger Bands and candlestick pattern analysis. The strategy primarily identifies potential market reversal points by observing candlestick patterns when price touches Bollinger Bands, combined with the ratio relationship between wicks and body. Additionally, the strategy employs a fixed risk model to control exposure per trade and utilizes multiple timeframe analysis to enhance trading accuracy.
|
|
|
|
#### Strategy Principles
|
|
The core logic of the strategy is based on several key elements: First, it calculates Bollinger Bands over 20 periods to determine price volatility range; Second, when price touches the Bollinger Bands, it analyzes the ratio between upper/lower wicks and body of the candlestick, considering it as a potential reversal signal when the ratio exceeds the set threshold; Third, it calculates key support and resistance levels for stop-loss placement; Finally, it calculates position size for each trade based on a fixed percentage (1%) of the account balance, implementing dynamic risk management. The strategy also offers various entry timing options, including closing price, opening price, daily high, and daily low.
|
|
|
|
#### Strategy Advantages
|
|
1. Precise risk control: Uses fixed percentage risk management model, ensuring controlled risk exposure per trade
|
|
2. Flexible entry points: Provides multiple entry price options to accommodate different trading styles
|
|
3. Technical indicator combination: Combines Bollinger Bands with candlestick pattern analysis for improved signal reliability
|
|
4. Rational stop-loss placement: Sets stop-losses based on key support and resistance levels, aligning with market dynamics
|
|
5. Comprehensive trade management: Includes order expiration mechanism to avoid false signals
|
|
|
|
#### Strategy Risks
|
|
1. Rapid market fluctuation risk: Wick ratios may generate false signals in volatile markets
|
|
2. Money management risk: Fixed percentage risk model might lead to undersized positions after consecutive losses
|
|
3. Stop-loss placement risk: Support and resistance calculations may not be accurate under certain market conditions
|
|
4. Timeframe dependency: Strategy primarily based on daily timeframe may miss opportunities in smaller timeframes
|
|
|
|
#### Strategy Optimization Directions
|
|
1. Incorporate volume indicators: Add volume analysis for signal confirmation to improve reliability
|
|
2. Optimize stop-loss mechanism: Consider implementing dynamic stop-loss that adjusts based on market volatility
|
|
3. Add market environment filters: Include trend strength indicators to adjust strategy parameters in different market conditions
|
|
4. Improve position management: Consider implementing dynamic position sizing based on market volatility
|
|
5. Add time filters: Include time filters to avoid trading during highly volatile market sessions
|
|
|
|
#### Summary
|
|
This strategy combines classical technical analysis tools with modern risk management methods to build a relatively comprehensive trading system. The core advantages lie in its strict risk control and flexible entry mechanisms, while attention needs to be paid to market environment changes and signal reliability verification in practical applications. Through the suggested optimization directions, there is room for further improvement, particularly in signal filtering and risk management aspects.
|
|
[/trans]
|
|
|
|
|
|
|
|
> Source (PineScript)
|
|
|
|
``` pinescript
|
|
/*backtest
|
|
start: 2024-01-01 00:00:00
|
|
end: 2024-11-26 00:00:00
|
|
period: 12h
|
|
basePeriod: 12h
|
|
exchanges: [{"eid":"Futures_Binance","currency":"BTC_USDT"}]
|
|
*/
|
|
|
|
//@version=5
|
|
strategy("Trade Entry Detector, based on Wick to Body Ratio when price tests Bollinger Bands", overlay=true, default_qty_type=strategy.fixed)
|
|
|
|
// Input for primary analysis time frame
|
|
timeFrame = "D" // Daily time frame
|
|
|
|
// Bollinger Band settings
|
|
length = input.int(20, title="Bollinger Band Length", minval=1)
|
|
mult = input.float(2.0, title="Standard Deviation Multiplier", minval=0.1)
|
|
source = input(close, title="Source")
|
|
|
|
// Entry ratio settings
|
|
wickToBodyRatio = input.float(1.0, title="Minimum Wick-to-Body Ratio", minval=0)
|
|
|
|
// Order Fill Timing Option
|
|
fillOption = input.string("Daily Close", title="Order Fill Timing", options=["Daily Close", "Daily Open", "HOD", "LOD"])
|
|
|
|
// Account and risk settings
|
|
accountBalance = 100000 // Account balance in dollars
|
|
riskPercentage = 1.0 // Risk percentage per trade
|
|
riskAmount = (riskPercentage / 100) * accountBalance // Fixed 1% risk amount
|
|
|
|
// Request daily data for calculations
|
|
dailyHigh = request.security(syminfo.tickerid, timeFrame, high)
|
|
dailyLow = request.security(syminfo.tickerid, timeFrame, low)
|
|
dailyClose = request.security(syminfo.tickerid, timeFrame, close)
|
|
dailyOpen = request.security(syminfo.tickerid, timeFrame, open)
|
|
|
|
// Calculate Bollinger Bands on the daily time frame
|
|
dailyBasis = request.security(syminfo.tickerid, timeFrame, ta.sma(source, length))
|
|
dailyDev = mult * request.security(syminfo.tickerid, timeFrame, ta.stdev(source, length))
|
|
dailyUpperBand = dailyBasis + dailyDev
|
|
dailyLowerBand = dailyBasis - dailyDev
|
|
|
|
// Calculate the body and wick sizes on the daily time frame
|
|
dailyBodySize = math.abs(dailyOpen - dailyClose)
|
|
dailyUpperWickSize = dailyHigh - math.max(dailyOpen, dailyClose)
|
|
dailyLowerWickSize = math.min(dailyOpen, dailyClose) - dailyLow
|
|
|
|
// Conditions for a candle with an upper wick or lower wick that touches the Bollinger Bands
|
|
upperWickCondition = (dailyUpperWickSize / dailyBodySize >= wickToBodyRatio) and (dailyHigh > dailyUpperBand)
|
|
lowerWickCondition = (dailyLowerWickSize / dailyBodySize >= wickToBodyRatio) and (dailyLow < dailyLowerBand)
|
|
|
|
// Define the swing high and swing low for stop loss placement
|
|
var float swingLow = na
|
|
var float swingHigh = na
|
|
|
|
if (ta.pivothigh(dailyHigh, 5, 5))
|
|
swingHigh := dailyHigh[5]
|
|
|
|
if (ta.pivotlow(dailyLow, 5, 5))
|
|
swingLow := dailyLow[5]
|
|
|
|
// Determine entry price based on chosen fill option
|
|
var float longEntryPrice = na
|
|
var float shortEntryPrice = na
|
|
|
|
if lowerWickCondition
|
|
longEntryPrice := fillOption == "Daily Close" ? dailyClose :
|
|
fillOption == "Daily Open" ? dailyOpen :
|
|
fillOption == "HOD" ? dailyHigh : dailyLow
|
|
|
|
if upperWickCondition
|
|
shortEntryPrice := fillOption == "Daily Close" ? dailyClose :
|
|
fillOption == "Daily Open" ? dailyOpen :
|
|
fillOption == "HOD" ? dailyHigh : dailyLow
|
|
|
|
// Execute the long and short entries with expiration
|
|
var int longOrderExpiry = na
|
|
var int shortOrderExpiry = na
|
|
|
|
if not na(longEntryPrice)
|
|
longOrderExpiry := bar_index + 2 // Order expires after 2 days
|
|
|
|
if not na(shortEntryPrice)
|
|
shortOrderExpiry := bar_index + 2 // Order expires after 2 days
|
|
|
|
// Check expiration and execute orders
|
|
if (longEntryPrice and bar_index <= longOrderExpiry and high >= longEntryPrice)
|
|
longStopDistance = close - nz(swingLow, close)
|
|
longPositionSize = longStopDistance > 0 ? riskAmount / longStopDistance : na
|
|
if (not na(longPositionSize))
|
|
strategy.entry("Long", strategy.long, qty=longPositionSize)
|
|
longEntryPrice := na // Reset after entry
|
|
|
|
if (shortEntryPrice and bar_index <= shortOrderExpiry and low <= shortEntryPrice)
|
|
shortStopDistance = nz(swingHigh, close) - close
|
|
shortPositionSize = shortStopDistance > 0 ? riskAmount / shortStopDistance : na
|
|
if (not na(shortPositionSize))
|
|
strategy.entry("Short", strategy.short, qty=shortPositionSize)
|
|
shortEntryPrice := na // Reset after entry
|
|
|
|
// Exit logic: hit the opposing Bollinger Band
|
|
if (strategy.position_size > 0) // Long position
|
|
strategy.exit("Exit Long", "Long", limit=dailyUpperBand)
|
|
else if (strategy.position_size < 0) // Short position
|
|
strategy.exit("Exit Short", "Short", limit=dailyLowerBand)
|
|
|
|
if (strategy.position_size > 0) // Long position
|
|
strategy.exit("Stop Loss Long", "Long", stop=swingLow)
|
|
else if (strategy.position_size < 0) // Short position
|
|
strategy.exit("Stop Loss Short", "Short", stop=swingHigh)
|
|
|
|
// Plot daily Bollinger Bands and levels on the chosen time frame
|
|
plot(dailyUpperBand, color=color.blue, linewidth=1, title="Daily Upper Bollinger Band")
|
|
plot(dailyLowerBand, color=color.blue, linewidth=1, title="Daily Lower Bollinger Band")
|
|
plot(dailyBasis, color=color.gray, linewidth=1, title="Daily Middle Bollinger Band")
|
|
|
|
```
|
|
|
|
> Detail
|
|
|
|
https://www.fmz.com/strategy/473122
|
|
|
|
> Last Modified
|
|
|
|
2024-11-27 14:18:33
|