
274 lines
10 KiB
Markdown
274 lines
10 KiB
Markdown
|
|
> Name
|
|
|
|
基于海龟交易法的突破策略Breakout-Strategy-Based-on-Turtle-Trading
|
|
|
|
> Author
|
|
|
|
ChaoZhang
|
|
|
|
> Strategy Description
|
|
|
|
|
|
|
|
[trans]
|
|
|
|
|
|
## 概述
|
|
|
|
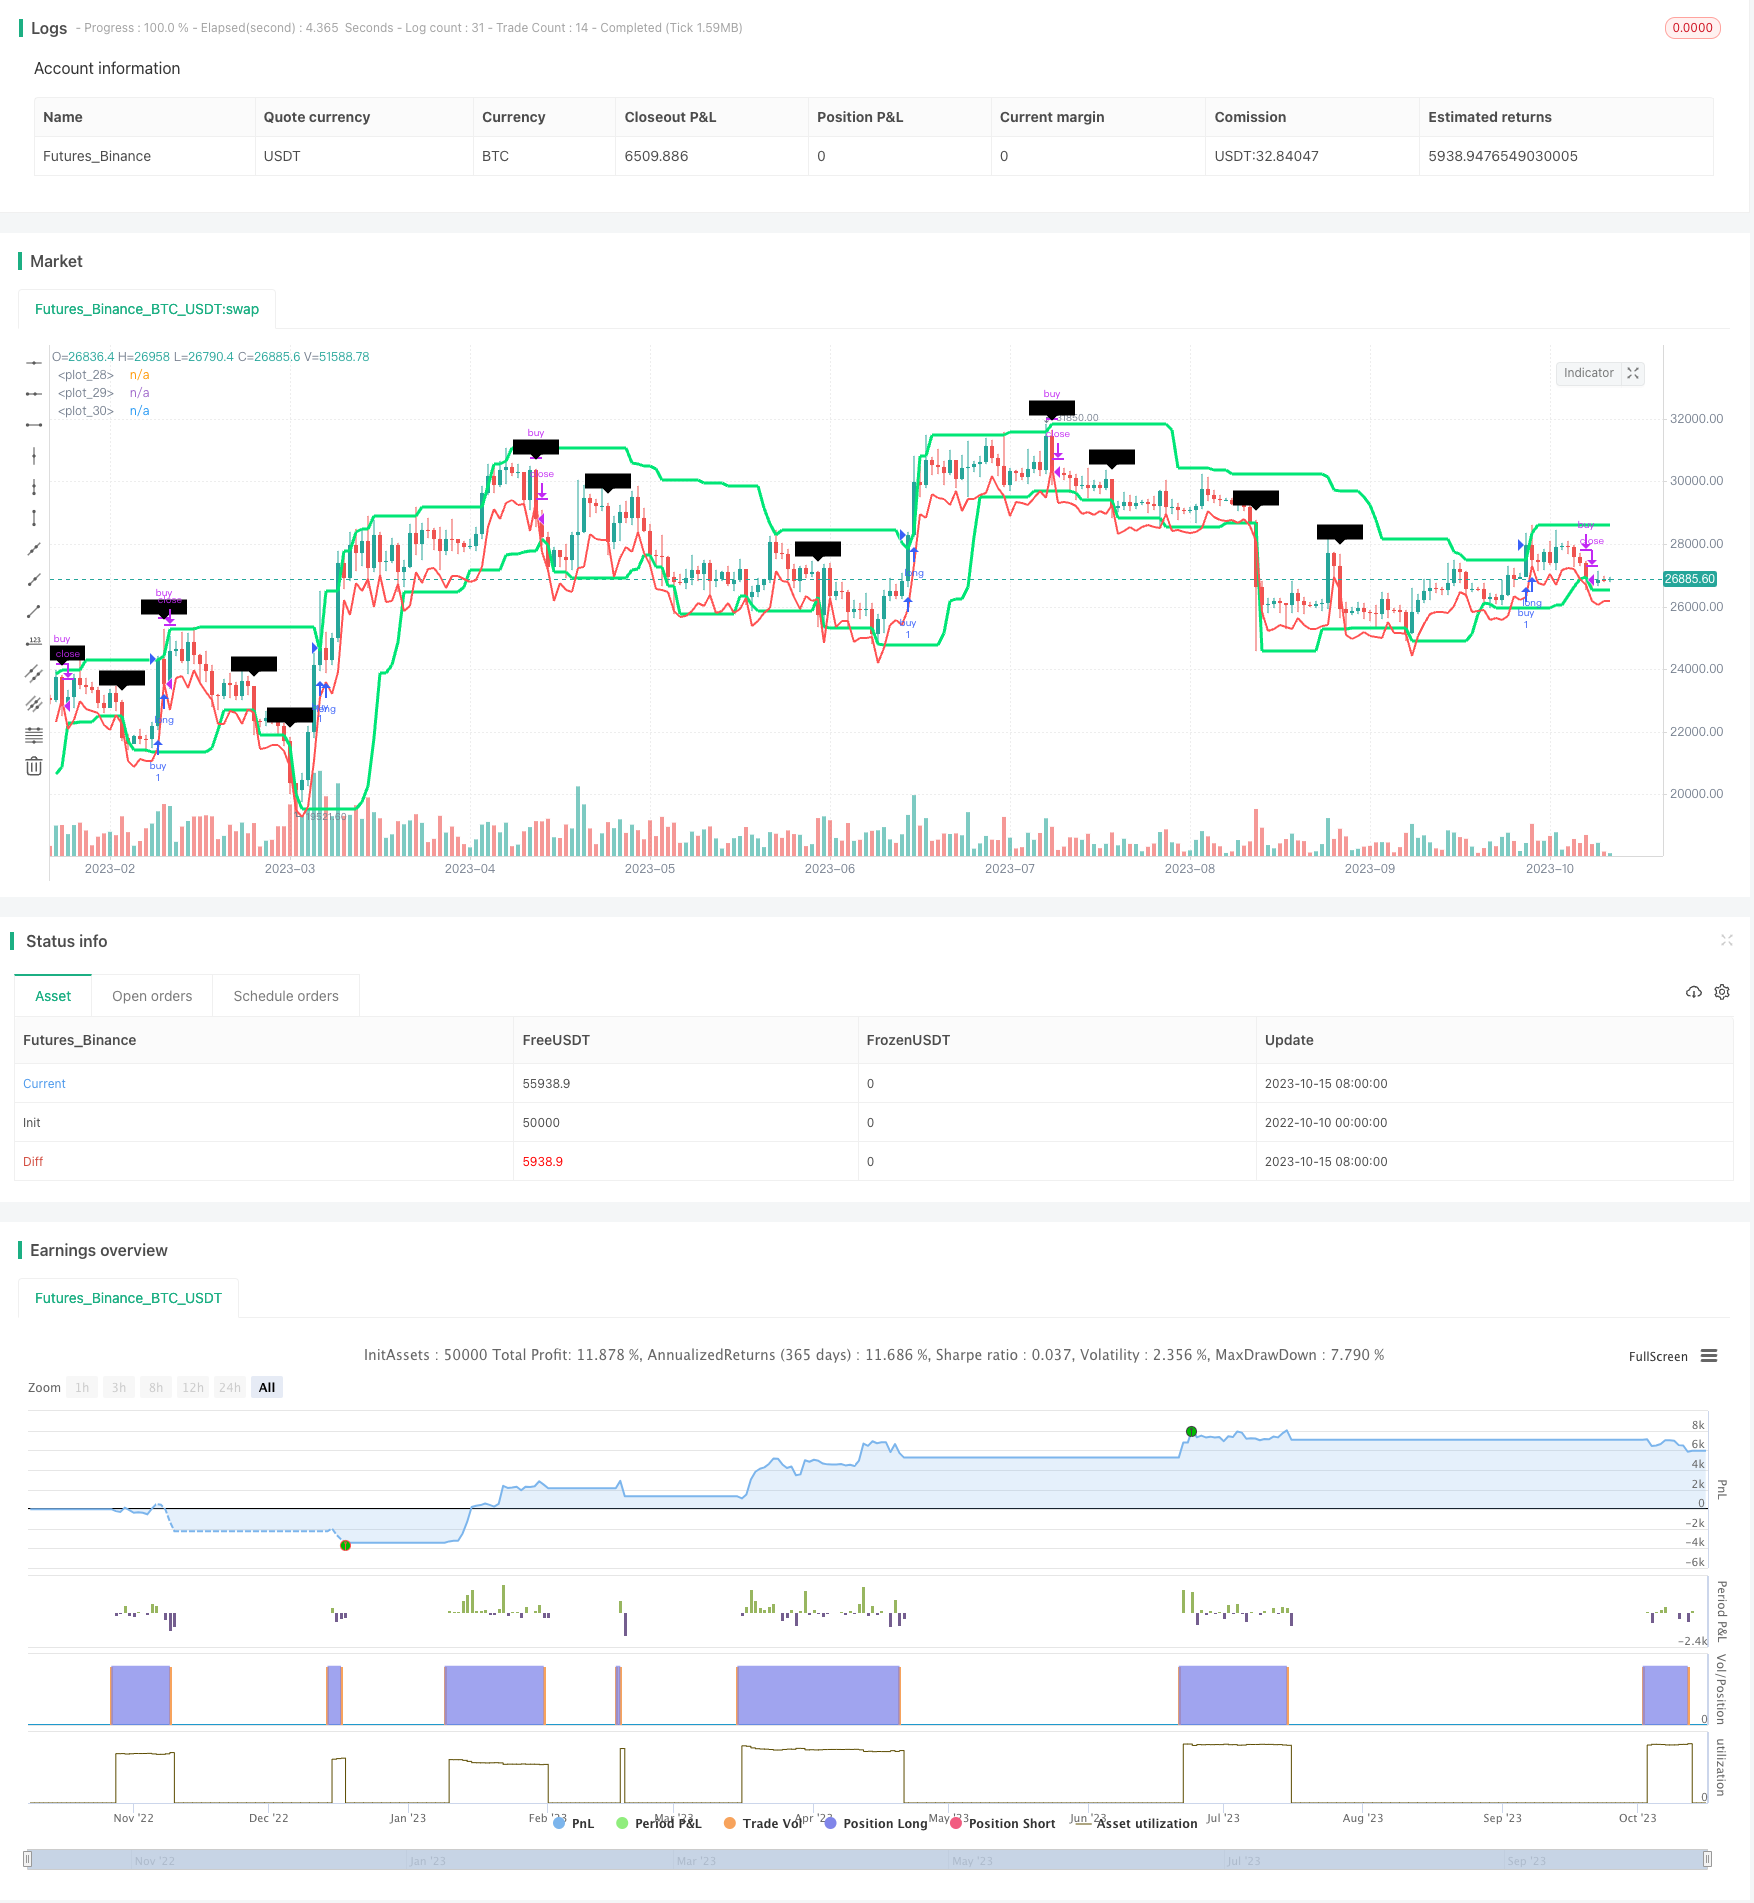
本策略基于著名的海龟交易法,采用Donchian通道指标判断价格突破,并结合ATR指标设置止损位,实现趋势追踪。策略优势是回撤控制能力强,能够有效控制单笔止损,降低连续亏损的概率。但该策略对交易品种的适应性较弱,需要优化通道参数。总体来说,该策略作为海龟交易法的入门版本,可以用来验证海龟交易法的有效性,也可以作为量化交易的基础策略之一。
|
|
|
|
## 原理
|
|
|
|
该策略主要基于两个指标:Donchian通道和ATR。
|
|
|
|
Donchian通道由最高价和最低价计算得到。策略默认设置通道长度为20天,以20天内的最高价和最低价画通道。当价格突破通道上沿时,产生买入信号;当价格突破通道下沿时,产生卖出信号。
|
|
|
|
ATR指标用来测量市场波动程度和设置止损。默认ATR周期设置为20天。策略以ATR的两倍作为止损位。
|
|
|
|
具体交易逻辑是:
|
|
|
|
1. 当价格突破通道上沿时,做多入场。
|
|
|
|
2. 止损点为入场时的低点减去ATR的两倍。
|
|
|
|
3. 当价格突破通道下沿时,平多头仓位。
|
|
|
|
4. 当价格突破通道下沿时,做空入场。
|
|
|
|
5. 止损点为入场时的高点加上ATR的两倍。
|
|
|
|
6. 当价格突破通道上沿时,平空头仓位。
|
|
|
|
综上,该策略依靠Donchian通道判断趋势方向和入场时机,以ATR设置止损来控制风险,实现对趋势的追踪。
|
|
|
|
## 优势分析
|
|
|
|
该策略主要具有以下优势:
|
|
|
|
1. 回撤控制能力强。采用ATR指标来设置止损,可以有效控制单笔亏损。
|
|
|
|
2. 实现了趋势追踪。Donchian通道可以有效判断价格突破,指示趋势转换。
|
|
|
|
3. 适合高波动品种。ATR指标考虑了市场波动率,设置止损更符合不同品种的特性。
|
|
|
|
4. 策略思路简单清晰,容易理解实现。
|
|
|
|
5. 可用Python语言灵活编写和优化策略。
|
|
|
|
## 风险分析
|
|
|
|
该策略也存在一些风险需要关注:
|
|
|
|
1. 通道参数需要优化。不同品种和时间周期下,通道参数需要调整,以适应市场特征。
|
|
|
|
2. 连续止损风险。异常行情下,短期内可能触发多个止损,造成较大亏损。
|
|
|
|
3. ATR参数需要测试。ATR参数直接影响止损效果,不同品种和波动环境下,需要调整。
|
|
|
|
4. 交易频率可能过高。在趋势不明显的震荡市场中,可能产生过多的交叉信号。
|
|
|
|
5. 利润可能有限。策略以止损为主,无法有效捕捉趋势行情的全部涨幅。
|
|
|
|
6. 夸张行情下止损可能不足。部分异常行情下,价格跳空可能直接触发止损。
|
|
|
|
## 优化方向
|
|
|
|
该策略可以从以下方面进行优化:
|
|
|
|
1. 优化通道参数,测试不同的参数对不同品种的适应性。
|
|
|
|
2. 增加过滤条件,避免在震荡行情中产生过多信号。可以考虑突破幅度或交易量过滤。
|
|
|
|
3. 优化ATR周期参数,测试不同的参数对止损效果的影响。
|
|
|
|
4. 增加pyramid进场策略,在趋势行情中追加仓位,扩大获利空间。
|
|
|
|
5. 结合其它指标,提高过滤效果。例如MACD、KD等指标判断趋势态势,避免反向交易。
|
|
|
|
6. 根据滑点、手续费等交易成本优化止损点位。防止止损过于接近。
|
|
|
|
7. 测试不同品种的适应性,调整参数以针对特定品种。
|
|
|
|
## 总结
|
|
|
|
本策略作为海龟交易法的入门版本,总体来说策略思路简单清晰,回撤控制能力强,可以有效验证海龟交易法的原理。但该策略对交易品种的适应性较弱,需要根据不同品种具体优化参数,才能发挥策略效果。随着参数优化、过滤条件增加等改进,该策略可以成为量化交易的基础趋势追踪策略之一。
|
|
|
|
||
|
|
|
|
## Overview
|
|
|
|
This strategy is based on the famous Turtle Trading system, using Donchian Channel to identify breakouts and ATR to set stop loss for trend following. The advantage is strong drawdown control ability by effectively limiting single trade loss. However, adaptiveness across different trading instruments is weak and needs parameter tuning. Overall, as an introductory version of Turtle Trading system, this strategy can be used to validate the effectiveness of Turtle Trading rules and also serve as a basic quantitative trading strategy.
|
|
|
|
## Principles
|
|
|
|
The strategy is mainly based on two indicators: Donchian Channel and ATR.
|
|
|
|
Donchian Channel is constructed by highest high and lowest low. The default channel length is 20 days, plotted with 20-day highest high and lowest low. Buy signal is generated when price breaks out above the upper band, and sell signal when price breaks below the lower band.
|
|
|
|
ATR measures volatility of the market and is used for stop loss setting. The default ATR period is 20 days. The strategy uses 2N ATR as the stop loss level.
|
|
|
|
The specific trading logic is:
|
|
|
|
1. Go long when price breaks out above the upper band.
|
|
|
|
2. Set stop loss at the low price at entry minus 2N ATR.
|
|
|
|
3. Close long position when price breaks below the lower band.
|
|
|
|
4. Go short when price breaks out below the lower band.
|
|
|
|
5. Set stop loss at the high price at entry plus 2N ATR.
|
|
|
|
6. Close short position when price breaks above the upper band.
|
|
|
|
In summary, the strategy identifies trend direction and entry signals with Donchian Channel, and controls risk with ATR based stop loss, to follow trends.
|
|
|
|
## Advantage Analysis
|
|
|
|
The main advantages of this strategy are:
|
|
|
|
1. Strong drawdown control ability. ATR stop loss can effectively limit single trade loss.
|
|
|
|
2. Ability to follow trends. Donchian Channel can effectively identify breakouts and trend changes.
|
|
|
|
3. Applicable for high volatility instruments. ATR considers market volatility in stop loss setting.
|
|
|
|
4. Simple and clear logic, easy to understand and implement.
|
|
|
|
5. Flexibility to optimize with Python language.
|
|
|
|
## Risk Analysis
|
|
|
|
Some risks of this strategy to note:
|
|
|
|
1. Channel parameters need optimization for different instruments and timeframes.
|
|
|
|
2. Consecutive stop loss risk. Multiple stop loss triggers may occur under volatile market conditions.
|
|
|
|
3. ATR parameter needs backtesting. ATR directly affects stop loss and should be adjusted based on volatility.
|
|
|
|
4. Potentially too high trading frequency. Too many whipsaw signals may occur under range-bound market.
|
|
|
|
5. Limited profit potential. The strategy focuses on stop loss and cannot fully capture trend gains.
|
|
|
|
6. Insufficient stop loss during volatile moves. Price gaps may directly trigger stop loss.
|
|
|
|
## Optimization Directions
|
|
|
|
The strategy can be improved in the following aspects:
|
|
|
|
1. Optimize channel parameters for different instruments.
|
|
|
|
2. Add filters to avoid too many signals under range-bound market. Consider breakout magnitude or volume filters.
|
|
|
|
3. Optimize ATR period parameter and test impact on stop loss.
|
|
|
|
4. Add pyramid entry to increase position size to maximize trend gains.
|
|
|
|
5. Incorporate other indicators such as MACD, KD to avoid false signals.
|
|
|
|
6. Adjust stop loss based on slippage and commission costs.
|
|
|
|
7. Test adaptiveness across different instruments and optimize parameters.
|
|
|
|
## Summary
|
|
|
|
As an introductory version of Turtle Trading system, this strategy has simple and clear logic, strong drawdown control ability, and can effectively validate the principles of Turtle Trading. But adaptiveness across instruments is weak and parameters need to be tuned based on specific instruments. With optimizations like parameter tuning, adding filters, this can serve as a basic trend following strategy for quantitative trading.
|
|
|
|
[/trans]
|
|
|
|
> Strategy Arguments
|
|
|
|
|
|
|
|
|Argument|Default|Description|
|
|
|----|----|----|
|
|
|v_input_1|20|Enter Channel|
|
|
|v_input_2|10|Exit Channel|
|
|
|v_input_3|false|Offset Bars|
|
|
|v_input_4|0|Direction: Long|Short|
|
|
|v_input_5|2|ATR multiplier (Stop Loss)|
|
|
|v_input_6|20|ATR Period|
|
|
|
|
|
|
> Source (PineScript)
|
|
|
|
``` pinescript
|
|
/*backtest
|
|
start: 2022-10-10 00:00:00
|
|
end: 2023-10-16 00:00:00
|
|
period: 1d
|
|
basePeriod: 1h
|
|
exchanges: [{"eid":"Futures_Binance","currency":"BTC_USDT"}]
|
|
*/
|
|
|
|
//@version=3
|
|
//Based on Turtle traders strategy: buy/sell on Donchian breakouts and stop loss on ATR 2x
|
|
// initial version considerations :
|
|
//// 1. Does not consider filter for avoiding new entries after winning trades (filtering rule from Turtle Strategy on 20 day breakout strategy)
|
|
//// 2. Does not consider pyramiding (aditional entries after 1N price movements)
|
|
|
|
strategy("Turtle trading strategy (Donchian/ATR)", overlay=true)
|
|
|
|
enter_period = input(20, minval=1, title="Enter Channel")
|
|
exit_period = input(10, minval=1, title="Exit Channel")
|
|
offset_bar = input(0,minval=0, title ="Offset Bars")
|
|
direction = input("Long",options=["Long","Short"],title="Direction")
|
|
max_length = max(enter_period,exit_period)
|
|
atrmult = input(2,title="ATR multiplier (Stop Loss)")
|
|
atrperiod = input(20,title="ATR Period")
|
|
|
|
closed_pos = false
|
|
dir_long = direction == "Long"? true : false
|
|
atr = atr(atrperiod)
|
|
upper = dir_long ? highest(enter_period): highest(exit_period)
|
|
lower = dir_long ? lowest(exit_period): lowest(enter_period)
|
|
atrupper = close + atr
|
|
atrlower = close - atr
|
|
plotted_atr = dir_long ? atrlower : atrupper
|
|
|
|
//basis = avg(upper, lower)
|
|
|
|
l = plot(lower, style=line, linewidth=3, color=lime, offset=1)
|
|
u = plot(upper, style=line, linewidth=3, color=lime, offset=1)
|
|
a = plot(plotted_atr, style=line,linewidth=2,color=red,offset=1)
|
|
//plot(basis, color=yellow, style=line, linewidth=1, title="Mid-Line Average")
|
|
//break upper Donchian (with 1 candle offset) (buy signal)
|
|
break_up = (close >= upper[1])
|
|
//break lower Donchian (with 1 candle offset) (sell signal)
|
|
break_down = (close <= lower[1])
|
|
stop_loss = dir_long ? (close<=plotted_atr[1]) : (close>=plotted_atr[1])
|
|
|
|
if break_up and dir_long
|
|
strategy.entry("buy", strategy.long, 1)
|
|
closed_pos :=false
|
|
if (break_down or stop_loss) and dir_long
|
|
strategy.close("buy")
|
|
|
|
if break_down and not dir_long
|
|
strategy.entry("sell", strategy.short, 1)
|
|
closed_pos :=false
|
|
if (break_up or stop_loss) and not dir_long
|
|
strategy.close("sell")
|
|
closed_pos :=true
|
|
|
|
losing_trade = strategy.equity[0]<strategy.equity[1]
|
|
//plotshape(losing_trade,text="Losing!")
|
|
plotshape(stop_loss,style=dir_long?shape.labeldown:shape.labelup,text="Stop!")
|
|
//plot(strategy.equity)
|
|
|
|
|
|
|
|
|
|
|
|
```
|
|
|
|
> Detail
|
|
|
|
https://www.fmz.com/strategy/429512
|
|
|
|
> Last Modified
|
|
|
|
2023-10-17 17:22:34
|