
179 lines
8.4 KiB
Markdown
179 lines
8.4 KiB
Markdown
|
|
> Name
|
|
|
|
基于波林格带动量突破的自适应趋势跟踪交易策略-Bollinger-Bands-Momentum-Breakout-Adaptive-Trend-Following-Strategy
|
|
|
|
> Author
|
|
|
|
ChaoZhang
|
|
|
|
> Strategy Description
|
|
|
|
|
|
|
|
[trans]
|
|
#### 概述
|
|
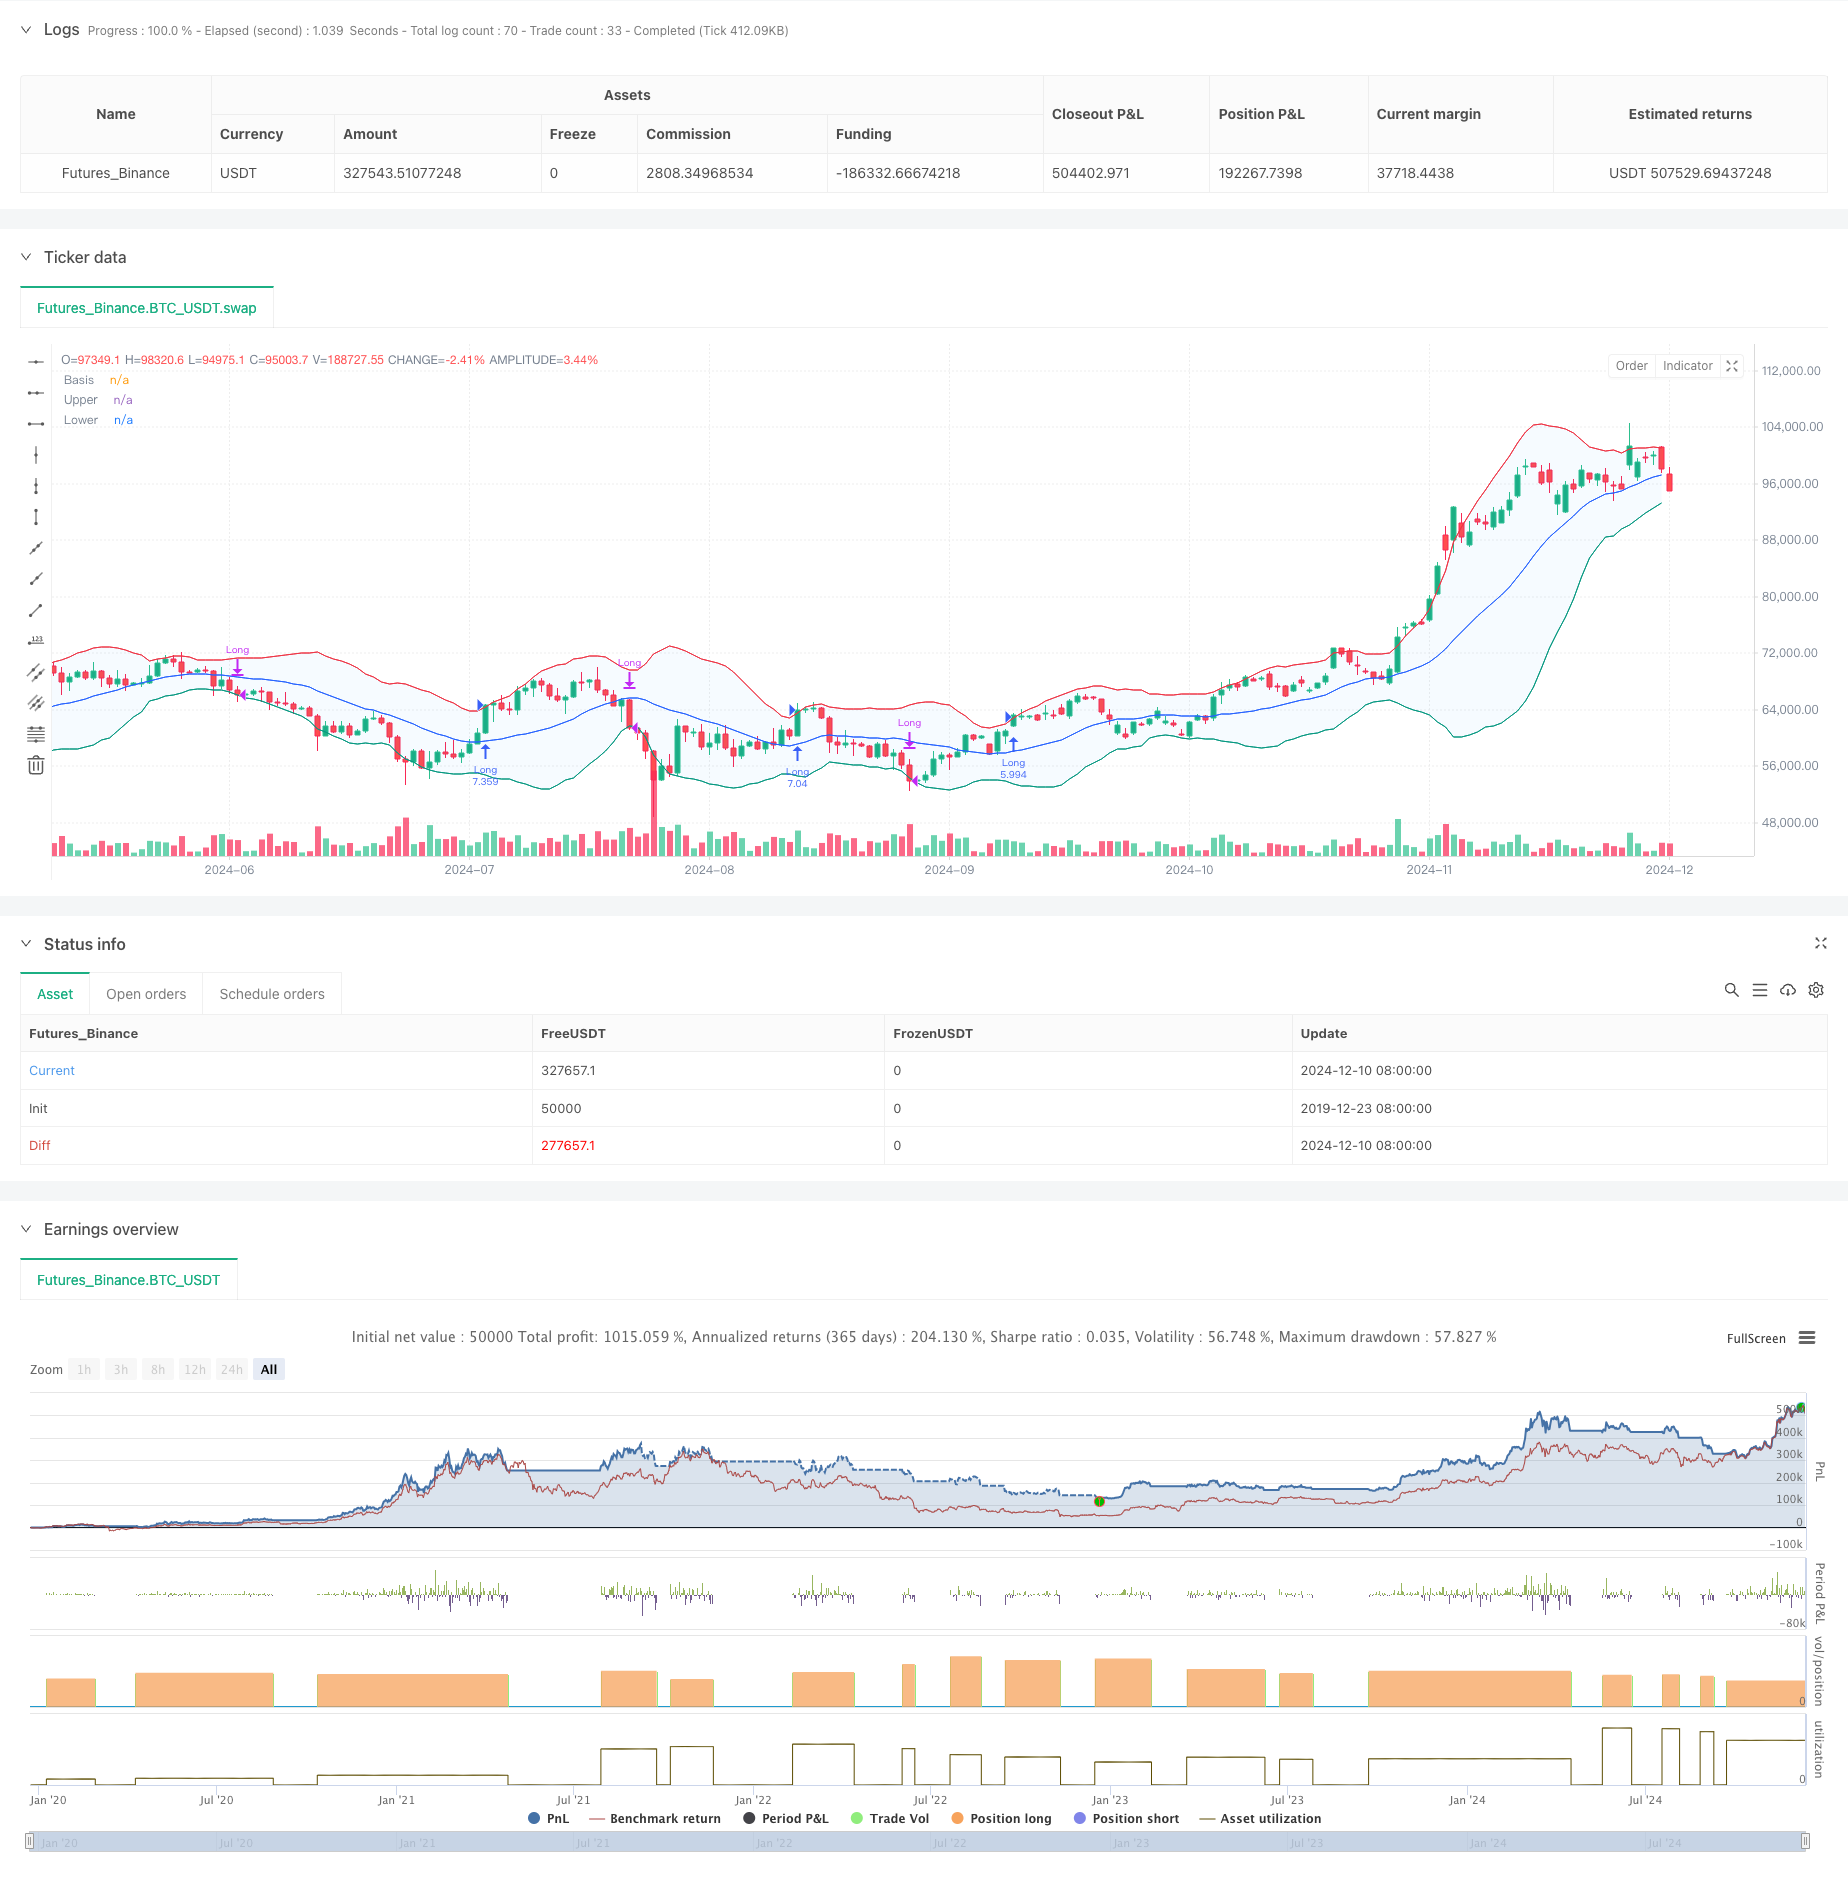
该策略是一个基于波林格带(Bollinger Bands)的动量突破交易系统,主要通过价格与波林格带上轨的关系来捕捉趋势性机会。策略采用了自适应的均线类型选择机制,结合标准差通道来识别市场波动特征,特别适合在波动性较大的市场环境中应用。
|
|
|
|
#### 策略原理
|
|
策略的核心逻辑基于以下几个关键要素:
|
|
1. 使用可自定义的移动平均线(包括SMA、EMA、SMMA、WMA、VWMA)计算波林格带的中轨。
|
|
2. 通过标准差的倍数(默认2.0)动态确定上下轨的位置。
|
|
3. 在价格突破上轨时入场做多,表明强势突破趋势的形成。
|
|
4. 当价格跌破下轨时平仓出场,说明上升趋势可能已经结束。
|
|
5. 系统内置了交易成本(0.1%)和滑点(3个点)的考虑,更符合实际交易环境。
|
|
|
|
#### 策略优势
|
|
1. 适应性强:通过多种均线类型的选择,策略可以适应不同市场条件。
|
|
2. 风险控制完善:通过波林格带下轨作为止损点,提供了明确的风险控制。
|
|
3. 资金管理合理:采用仓位比例管理方式,避免了固定手数带来的风险。
|
|
4. 交易成本考虑充分:包含了佣金和滑点因素,回测结果更接近实际。
|
|
5. 时间框架灵活:可以通过参数设置选择特定的交易时间范围。
|
|
|
|
#### 策略风险
|
|
1. 假突破风险:在震荡市场中可能出现频繁的假突破信号。
|
|
解决方案:可以增加确认指标或延迟进场机制。
|
|
2. 趋势反转风险:在强趋势市场突然反转时可能造成较大损失。
|
|
解决方案:可以添加趋势强度过滤器。
|
|
3. 参数敏感性:不同的参数组合可能导致策略表现差异较大。
|
|
解决方案:需要进行充分的参数优化和稳健性测试。
|
|
|
|
#### 策略优化方向
|
|
1. 引入趋势强度指标:
|
|
- 可以添加ADX或类似指标来过滤弱趋势市场的信号
|
|
- 这样可以减少假突破带来的损失
|
|
2. 优化止损机制:
|
|
- 可以实现动态止损,如跟踪止损
|
|
- 有助于在趋势持续时获得更大收益
|
|
3. 增加交易过滤器:
|
|
- 基于成交量的确认信号
|
|
- 避免在低流动性环境下交易
|
|
4. 完善进场机制:
|
|
- 可以增加回调入场的机制
|
|
- 有助于获得更好的入场价格
|
|
|
|
#### 总结
|
|
这是一个设计合理、逻辑清晰的趋势跟踪策略。它通过波林格带的动态特性捕捉市场动量,并具备良好的风险控制机制。策略的可定制性强,通过参数调整可以适应不同的市场环境。建议在实盘应用时进行充分的参数优化和回测验证,并结合建议的优化方向进行策略改进。 ||
|
|
|
|
#### Overview
|
|
This strategy is a momentum breakout trading system based on Bollinger Bands, primarily capturing trend opportunities through the relationship between price and the upper Bollinger Band. The strategy employs an adaptive moving average type selection mechanism, combined with standard deviation channels to identify market volatility characteristics, particularly suitable for markets with high volatility.
|
|
|
|
#### Strategy Principle
|
|
The core logic of the strategy is based on the following key elements:
|
|
1. Uses customizable moving averages (including SMA, EMA, SMMA, WMA, VWMA) to calculate the middle band of Bollinger Bands.
|
|
2. Dynamically determines upper and lower band positions through standard deviation multiplier (default 2.0).
|
|
3. Enters long positions when price breaks above the upper band, indicating formation of strong breakout trends.
|
|
4. Exits positions when price falls below the lower band, suggesting potential end of uptrend.
|
|
5. Incorporates trading costs (0.1%) and slippage (3 points), better reflecting real trading conditions.
|
|
|
|
#### Strategy Advantages
|
|
1. High Adaptability: Through multiple moving average type options, the strategy can adapt to different market conditions.
|
|
2. Robust Risk Control: Uses Bollinger Bands lower band as stop loss, providing clear risk control.
|
|
3. Rational Money Management: Employs position sizing based on equity percentage, avoiding risks of fixed position sizes.
|
|
4. Comprehensive Cost Consideration: Includes commission and slippage factors, making backtesting results more realistic.
|
|
5. Flexible Time Framework: Allows selection of specific trading time ranges through parameter settings.
|
|
|
|
#### Strategy Risks
|
|
1. False Breakout Risk: Frequent false breakout signals may occur in ranging markets.
|
|
Solution: Add confirmation indicators or delayed entry mechanisms.
|
|
2. Trend Reversal Risk: Sudden reversals in strong trend markets may cause significant losses.
|
|
Solution: Implement trend strength filters.
|
|
3. Parameter Sensitivity: Different parameter combinations may lead to varying strategy performance.
|
|
Solution: Requires thorough parameter optimization and robustness testing.
|
|
|
|
#### Strategy Optimization Directions
|
|
1. Introduce Trend Strength Indicators:
|
|
- Add ADX or similar indicators to filter signals in weak trend markets
|
|
- This can reduce losses from false breakouts
|
|
2. Optimize Stop Loss Mechanism:
|
|
- Implement dynamic stop loss, such as trailing stops
|
|
- Helps capture larger profits in continuing trends
|
|
3. Add Trading Filters:
|
|
- Volume-based confirmation signals
|
|
- Avoid trading in low liquidity environments
|
|
4. Enhance Entry Mechanism:
|
|
- Add pullback entry mechanisms
|
|
- Helps achieve better entry prices
|
|
|
|
#### Summary
|
|
This is a well-designed trend following strategy with clear logic. It captures market momentum through the dynamic nature of Bollinger Bands and includes good risk control mechanisms. The strategy is highly customizable and can adapt to different market environments through parameter adjustments. For live trading implementation, it is recommended to conduct thorough parameter optimization and backtesting validation, while incorporating the suggested optimization directions for strategy improvement.[/trans]
|
|
|
|
|
|
|
|
> Source (PineScript)
|
|
|
|
``` pinescript
|
|
/*backtest
|
|
start: 2019-12-23 08:00:00
|
|
end: 2024-12-11 08:00:00
|
|
period: 1d
|
|
basePeriod: 1d
|
|
exchanges: [{"eid":"Futures_Binance","currency":"BTC_USDT"}]
|
|
*/
|
|
|
|
//@version=5
|
|
strategy("Demo GPT - Bollinger Bands", overlay=true, initial_capital=10000, commission_type=strategy.commission.percent, commission_value=0.1, slippage=3, default_qty_type=strategy.percent_of_equity, default_qty_value=100)
|
|
|
|
// Inputs
|
|
length = input.int(20, minval=1, title="Length")
|
|
maType = input.string("SMA", "Basis MA Type", options = ["SMA", "EMA", "SMMA (RMA)", "WMA", "VWMA"])
|
|
src = input(close, title="Source")
|
|
mult = input.float(2.0, minval=0.001, maxval=50, title="StdDev")
|
|
offset = input.int(0, "Offset", minval=-500, maxval=500)
|
|
|
|
// Date range inputs
|
|
startYear = input.int(2018, "Start Year", minval=1970, maxval=2100)
|
|
startMonth = input.int(1, "Start Month", minval=1, maxval=12)
|
|
startDay = input.int(1, "Start Day", minval=1, maxval=31)
|
|
endYear = input.int(2069, "End Year", minval=1970, maxval=2100)
|
|
endMonth = input.int(12, "End Month", minval=1, maxval=12)
|
|
endDay = input.int(31, "End Day", minval=1, maxval=31)
|
|
|
|
// Time range
|
|
startTime = timestamp("GMT+0", startYear, startMonth, startDay, 0, 0)
|
|
endTime = timestamp("GMT+0", endYear, endMonth, endDay, 23, 59)
|
|
|
|
// Moving average function
|
|
ma(source, length, _type) =>
|
|
switch _type
|
|
"SMA" => ta.sma(source, length)
|
|
"EMA" => ta.ema(source, length)
|
|
"SMMA (RMA)" => ta.rma(source, length)
|
|
"WMA" => ta.wma(source, length)
|
|
"VWMA" => ta.vwma(source, length)
|
|
|
|
// Calculate Bollinger Bands
|
|
basis = ma(src, length, maType)
|
|
dev = mult * ta.stdev(src, length)
|
|
upper = basis + dev
|
|
lower = basis - dev
|
|
|
|
// Plot
|
|
plot(basis, "Basis", color=#2962FF, offset=offset)
|
|
p1 = plot(upper, "Upper", color=#F23645, offset=offset)
|
|
p2 = plot(lower, "Lower", color=#089981, offset=offset)
|
|
fill(p1, p2, title="Background", color=color.rgb(33, 150, 243, 95))
|
|
|
|
// Strategy logic: Only go long and flat
|
|
inDateRange = time >= startTime and time <= endTime
|
|
noPosition = strategy.position_size == 0
|
|
longPosition = strategy.position_size > 0
|
|
|
|
// Buy if close is above upper band
|
|
if inDateRange and noPosition and close > upper
|
|
strategy.entry("Long", strategy.long)
|
|
|
|
// Sell/Exit if close is below lower band
|
|
if inDateRange and longPosition and close < lower
|
|
strategy.close("Long")
|
|
|
|
```
|
|
|
|
> Detail
|
|
|
|
https://www.fmz.com/strategy/474977
|
|
|
|
> Last Modified
|
|
|
|
2024-12-13 11:43:10
|