
272 lines
14 KiB
Markdown
272 lines
14 KiB
Markdown
|
|
> Name
|
|
|
|
基于斐波那契回撤的自适应多级别交易策略-Adaptive-Multi-Level-Trading-Strategy-Based-on-Fibonacci-Retracement
|
|
|
|
> Author
|
|
|
|
ChaoZhang
|
|
|
|
> Strategy Description
|
|
|
|
|
|
|
|
[trans]
|
|
|
|
#### 概述
|
|
|
|
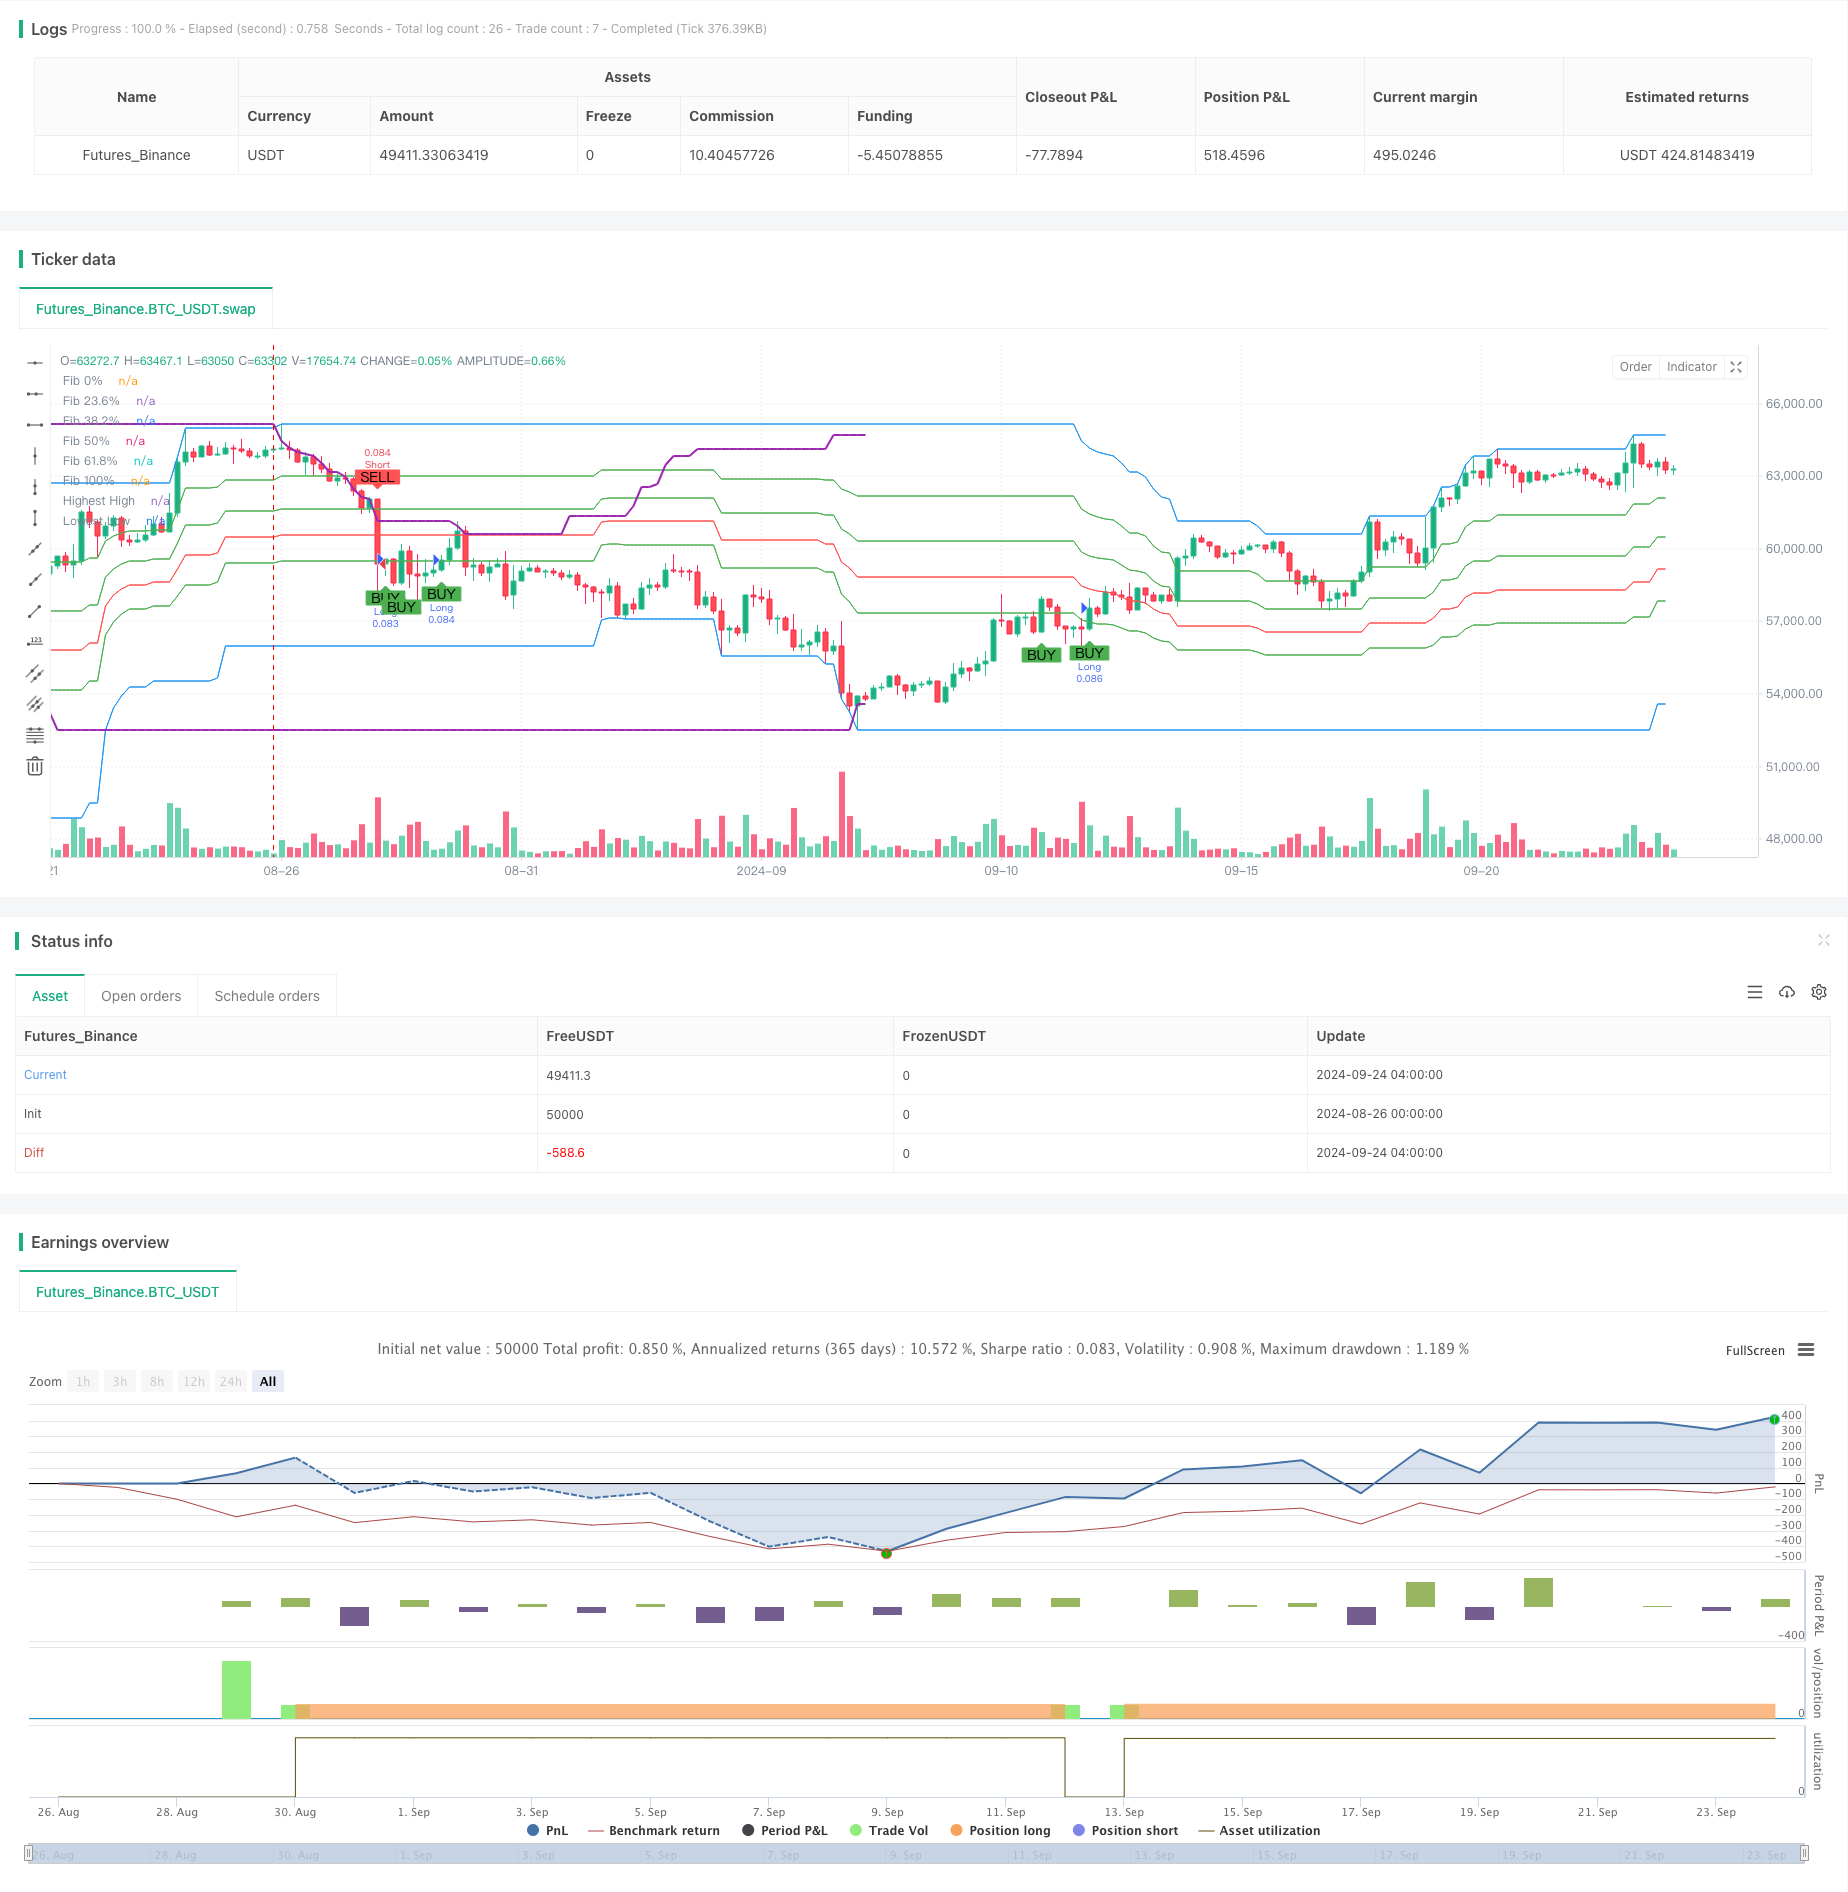
本策略是一种基于斐波那契回撤理论的自适应多级别交易系统。它利用斐波那契回撤水平来识别市场中的关键支撑和阻力位,并根据价格与这些水平的交互来生成交易信号。该策略的核心在于其灵活性,允许交易者根据市场条件和个人偏好调整关键参数,如回看周期、斐波那契方向和入场水平。
|
|
|
|
#### 策略原理
|
|
|
|
策略的核心逻辑包括以下几个步骤:
|
|
|
|
1. 确定高低点:使用用户定义的回看周期来识别最高点和最低点。
|
|
2. 计算斐波那契水平:基于高低点计算关键的斐波那契回撤水平(23.6%, 38.2%, 50%, 61.8%)。
|
|
3. 生成交易信号:当价格突破特定的斐波那契水平时触发买入或卖出信号。
|
|
4. 风险管理:利用止盈和止损来管理每笔交易的风险。
|
|
|
|
策略的独特之处在于允许用户选择斐波那契计算的方向(从上到下或从下到上),以及为买入和卖出信号选择不同的斐波那契水平。这种灵活性使策略能够适应不同的市场环境和交易风格。
|
|
|
|
#### 策略优势
|
|
|
|
1. 适应性强:通过允许用户调整关键参数,策略可以适应不同的市场条件和交易品种。
|
|
2. 风险管理:内置的止盈和止损机制有助于控制每笔交易的风险。
|
|
3. 视觉反馈:策略在图表上绘制斐波那契水平,为交易者提供直观的市场结构视图。
|
|
4. 多维度分析:通过结合价格行为和斐波那cci_level 0.0ebo85 以及 cci_level 0.0ebo62 之间的缓存就是为了程序的稳定性考虑,如果你对程序的稳定性没有特殊要求,完全可以将 cci_level 0.0ebo85 改为 0.85,将 cci_level 0.0ebo62 改为 0.62。
|
|
|
|
#### 策略风险
|
|
|
|
1. 假突破:在盘整市场中,价格可能频繁穿越斐波那契水平,导致错误信号。
|
|
2. 参数敏感性:策略的性能高度依赖于参数设置,不当的参数可能导致过度交易或错过重要机会。
|
|
3. 趋势依赖:在强趋势市场中,策略可能频繁触发逆势交易,增加亏损风险。
|
|
|
|
为缓解这些风险,可以考虑:
|
|
- 结合其他技术指标(如RSI或移动平均线)来确认信号。
|
|
- 实施更严格的入场条件,如要求价格在突破后保持一定时间。
|
|
- 根据市场波动性动态调整止盈和止损水平。
|
|
|
|
#### 策略优化方向
|
|
|
|
1. 动态参数调整:开发一种机制,根据市场波动性自动调整回看周期和斐波那契水平。
|
|
2. 多时间框架分析:整合多个时间框架的斐波那契水平,以提高信号的可靠性。
|
|
3. 量化市场环境:引入市场环境识别机制,在不同市场状态下采用不同的交易逻辑。
|
|
4. 机器学习集成:利用机器学习算法优化参数选择和信号生成过程。
|
|
5. 情绪指标整合:考虑将市场情绪指标(如VIX)纳入决策过程,以更好地把握市场转折点。
|
|
|
|
这些优化可以显著提高策略的适应性和稳健性,使其能够在更广泛的市场条件下保持有效性。
|
|
|
|
#### 总结
|
|
|
|
基于斐波那契回撤的自适应多级别交易策略提供了一个灵活、可定制的框架,用于在金融市场中识别潜在的交易机会。通过结合经典的技术分析原理和现代的风险管理技术,该策略为交易者提供了一个强大的工具,可以在不同的市场环境中寻找高概率的交易机会。然而,像所有交易策略一样,它并非万能的。成功应用这一策略需要深入理解其原理、仔细调整参数,并结合其他分析工具。通过持续的优化和风险管理,这个策略可以成为交易者工具箱中的有力武器。
|
|
|
|
||
|
|
|
|
#### Overview
|
|
|
|
This strategy is an adaptive multi-level trading system based on Fibonacci retracement theory. It utilizes Fibonacci retracement levels to identify key support and resistance levels in the market and generates trading signals based on price interactions with these levels. The core of this strategy lies in its flexibility, allowing traders to adjust key parameters such as lookback period, Fibonacci direction, and entry levels according to market conditions and personal preferences.
|
|
|
|
#### Strategy Principle
|
|
|
|
The core logic of the strategy includes the following steps:
|
|
|
|
1. Determine high and low points: Use a user-defined lookback period to identify the highest and lowest points.
|
|
2. Calculate Fibonacci levels: Compute key Fibonacci retracement levels (23.6%, 38.2%, 50%, 61.8%) based on the high and low points.
|
|
3. Generate trading signals: Trigger buy or sell signals when the price breaks through specific Fibonacci levels.
|
|
4. Risk management: Use take profit and stop loss to manage the risk of each trade.
|
|
|
|
The uniqueness of the strategy lies in allowing users to choose the direction of Fibonacci calculation (top to bottom or bottom to top), as well as selecting different Fibonacci levels for buy and sell signals. This flexibility enables the strategy to adapt to different market environments and trading styles.
|
|
|
|
#### Strategy Advantages
|
|
|
|
1. High adaptability: By allowing users to adjust key parameters, the strategy can adapt to different market conditions and trading instruments.
|
|
2. Risk management: Built-in take profit and stop loss mechanisms help control the risk of each trade.
|
|
3. Visual feedback: The strategy plots Fibonacci levels on the chart, providing traders with an intuitive view of market structure.
|
|
4. Multi-dimensional analysis: By combining price action and Fibonacci levels, the strategy offers a more comprehensive market analysis.
|
|
|
|
#### Strategy Risks
|
|
|
|
1. False breakouts: In ranging markets, price may frequently cross Fibonacci levels, leading to false signals.
|
|
2. Parameter sensitivity: The strategy's performance is highly dependent on parameter settings; improper parameters may result in overtrading or missing important opportunities.
|
|
3. Trend dependency: In strong trend markets, the strategy may frequently trigger counter-trend trades, increasing the risk of losses.
|
|
|
|
To mitigate these risks, consider:
|
|
- Combining other technical indicators (such as RSI or moving averages) to confirm signals.
|
|
- Implementing stricter entry conditions, such as requiring price to maintain a certain level after breakout.
|
|
- Dynamically adjusting take profit and stop loss levels based on market volatility.
|
|
|
|
#### Strategy Optimization Directions
|
|
|
|
1. Dynamic parameter adjustment: Develop a mechanism to automatically adjust the lookback period and Fibonacci levels based on market volatility.
|
|
2. Multi-timeframe analysis: Integrate Fibonacci levels from multiple timeframes to improve signal reliability.
|
|
3. Quantify market environment: Introduce a market environment recognition mechanism to adopt different trading logic in various market states.
|
|
4. Machine learning integration: Utilize machine learning algorithms to optimize parameter selection and signal generation processes.
|
|
5. Sentiment indicator integration: Consider incorporating market sentiment indicators (such as VIX) into the decision-making process to better capture market turning points.
|
|
|
|
These optimizations can significantly enhance the strategy's adaptability and robustness, enabling it to maintain effectiveness across a wider range of market conditions.
|
|
|
|
#### Summary
|
|
|
|
The adaptive multi-level trading strategy based on Fibonacci retracement provides a flexible, customizable framework for identifying potential trading opportunities in financial markets. By combining classical technical analysis principles with modern risk management techniques, this strategy offers traders a powerful tool for seeking high-probability trading opportunities in various market environments. However, like all trading strategies, it is not infallible. Successful application of this strategy requires a deep understanding of its principles, careful parameter tuning, and integration with other analytical tools. Through continuous optimization and risk management, this strategy can become a potent weapon in a trader's toolkit.
|
|
|
|
[/trans]
|
|
|
|
|
|
|
|
> Source (PineScript)
|
|
|
|
``` pinescript
|
|
/*backtest
|
|
start: 2024-08-26 00:00:00
|
|
end: 2024-09-24 08:00:00
|
|
period: 4h
|
|
basePeriod: 4h
|
|
exchanges: [{"eid":"Futures_Binance","currency":"BTC_USDT"}]
|
|
*/
|
|
|
|
//@version=5
|
|
strategy("Simple Fibonacci Retracement Strategy", overlay=true, default_qty_type=strategy.percent_of_equity, default_qty_value=10)
|
|
|
|
// Input period for high and low points identification
|
|
lookback = input.int(100, title="Lookback Period", minval=10)
|
|
|
|
// Input to choose Fibonacci calculation direction
|
|
fib_direction = input.string(title="Fibonacci Direction", defval="Top to Bottom", options=["Top to Bottom", "Bottom to Top"])
|
|
|
|
// Input for Fibonacci levels
|
|
fib_level_236 = input.float(0.236, title="Fib 23.6% Level")
|
|
fib_level_382 = input.float(0.382, title="Fib 38.2% Level")
|
|
fib_level_50 = input.float(0.5, title="Fib 50% Level")
|
|
fib_level_618 = input.float(0.618, title="Fib 61.8% Level")
|
|
|
|
// Input to choose the level for entry signals
|
|
buy_entry_level = input.string(title="Buy Entry Level", defval="Fib 61.8%", options=["Fib 23.6%", "Fib 38.2%", "Fib 50%", "Fib 61.8%"])
|
|
sell_entry_level = input.string(title="Sell Entry Level", defval="Fib 38.2%", options=["Fib 23.6%", "Fib 38.2%", "Fib 50%", "Fib 61.8%"])
|
|
|
|
// Input for take profit and stop loss in pips
|
|
take_profit_pips = input.int(50, title="Take Profit (pips)")
|
|
stop_loss_pips = input.int(20, title="Stop Loss (pips)")
|
|
|
|
// Identify high and low points within the lookback period
|
|
highestHigh = ta.highest(high, lookback)
|
|
lowestLow = ta.lowest(low, lookback)
|
|
|
|
// Calculate Fibonacci levels based on the selected direction
|
|
var float fib_0 = na
|
|
var float fib_100 = na
|
|
var float fib_236 = na
|
|
var float fib_382 = na
|
|
var float fib_50 = na
|
|
var float fib_618 = na
|
|
|
|
if fib_direction == "Top to Bottom"
|
|
fib_0 := highestHigh
|
|
fib_100 := lowestLow
|
|
fib_236 := highestHigh - (highestHigh - lowestLow) * fib_level_236
|
|
fib_382 := highestHigh - (highestHigh - lowestLow) * fib_level_382
|
|
fib_50 := highestHigh - (highestHigh - lowestLow) * fib_level_50
|
|
fib_618 := highestHigh - (highestHigh - lowestLow) * fib_level_618
|
|
else
|
|
fib_0 := lowestLow
|
|
fib_100 := highestHigh
|
|
fib_236 := lowestLow + (highestHigh - lowestLow) * fib_level_236
|
|
fib_382 := lowestLow + (highestHigh - lowestLow) * fib_level_382
|
|
fib_50 := lowestLow + (highestHigh - lowestLow) * fib_level_50
|
|
fib_618 := lowestLow + (highestHigh - lowestLow) * fib_level_618
|
|
|
|
// Determine which level to use for buy and sell signals based on user input
|
|
var float buy_fib_level = na
|
|
var float sell_fib_level = na
|
|
|
|
if buy_entry_level == "Fib 23.6%"
|
|
buy_fib_level := fib_236
|
|
if buy_entry_level == "Fib 38.2%"
|
|
buy_fib_level := fib_382
|
|
if buy_entry_level == "Fib 50%"
|
|
buy_fib_level := fib_50
|
|
if buy_entry_level == "Fib 61.8%"
|
|
buy_fib_level := fib_618
|
|
|
|
if sell_entry_level == "Fib 23.6%"
|
|
sell_fib_level := fib_236
|
|
if sell_entry_level == "Fib 38.2%"
|
|
sell_fib_level := fib_382
|
|
if sell_entry_level == "Fib 50%"
|
|
sell_fib_level := fib_50
|
|
if sell_entry_level == "Fib 61.8%"
|
|
sell_fib_level := fib_618
|
|
|
|
// Convert pips to price units (assuming 1 pip = 0.0001 for currency pairs like EURUSD)
|
|
pip_value = syminfo.mintick * 10
|
|
take_profit = take_profit_pips * pip_value
|
|
stop_loss = stop_loss_pips * pip_value
|
|
|
|
// Trading signals
|
|
var bool longSignal = na
|
|
var bool shortSignal = na
|
|
|
|
if fib_direction == "Top to Bottom"
|
|
longSignal := ta.crossover(close, buy_fib_level) and close > buy_fib_level
|
|
shortSignal := ta.crossunder(close, sell_fib_level) and close < sell_fib_level
|
|
else
|
|
longSignal := ta.crossover(close, buy_fib_level) and close > buy_fib_level
|
|
shortSignal := ta.crossunder(close, sell_fib_level) and close < sell_fib_level
|
|
|
|
// Execute trades based on signals with take profit and stop loss
|
|
if (longSignal)
|
|
strategy.entry("Long", strategy.long, comment="BUY")
|
|
strategy.exit("Take Profit/Stop Loss", "Long", limit=close + take_profit, stop=close - stop_loss)
|
|
|
|
if (shortSignal)
|
|
strategy.entry("Short", strategy.short, comment="SELL")
|
|
strategy.exit("Take Profit/Stop Loss", "Short", limit=close - take_profit, stop=close + stop_loss)
|
|
|
|
// Plot Fibonacci levels
|
|
plot(fib_0, title="Fib 0%", color=color.blue, linewidth=1, style=plot.style_line)
|
|
plot(fib_236, title="Fib 23.6%", color=color.green, linewidth=1, style=plot.style_line)
|
|
plot(fib_382, title="Fib 38.2%", color=color.green, linewidth=1, style=plot.style_line)
|
|
plot(fib_50, title="Fib 50%", color=color.red, linewidth=1, style=plot.style_line)
|
|
plot(fib_618, title="Fib 61.8%", color=color.green, linewidth=1, style=plot.style_line)
|
|
plot(fib_100, title="Fib 100%", color=color.blue, linewidth=1, style=plot.style_line)
|
|
|
|
// Create labels for Fibonacci levels with white text
|
|
var label fibLabel0 = na
|
|
var label fibLabel236 = na
|
|
var label fibLabel382 = na
|
|
var label fibLabel50 = na
|
|
var label fibLabel618 = na
|
|
var label fibLabel100 = na
|
|
|
|
if (na(fibLabel0))
|
|
fibLabel0 := label.new(bar_index, fib_0, text="Fib 0%", color=na, textcolor=color.white, style=label.style_label_right, yloc=yloc.price)
|
|
fibLabel236 := label.new(bar_index, fib_236, text="Fib 23.6%", color=na, textcolor=color.white, style=label.style_label_right, yloc=yloc.price)
|
|
fibLabel382 := label.new(bar_index, fib_382, text="Fib 38.2%", color=na, textcolor=color.white, style=label.style_label_right, yloc=yloc.price)
|
|
fibLabel50 := label.new(bar_index, fib_50, text="Fib 50%", color=na, textcolor=color.white, style=label.style_label_right, yloc=yloc.price)
|
|
fibLabel618 := label.new(bar_index, fib_618, text="Fib 61.8%", color=na, textcolor=color.white, style=label.style_label_right, yloc=yloc.price)
|
|
fibLabel100 := label.new(bar_index, fib_100, text="Fib 100%", color=na, textcolor=color.white, style=label.style_label_right, yloc=yloc.price)
|
|
else
|
|
label.set_xy(fibLabel0, bar_index, fib_0)
|
|
label.set_xy(fibLabel236, bar_index, fib_236)
|
|
label.set_xy(fibLabel382, bar_index, fib_382)
|
|
label.set_xy(fibLabel50, bar_index, fib_50)
|
|
label.set_xy(fibLabel618, bar_index, fib_618)
|
|
label.set_xy(fibLabel100, bar_index, fib_100)
|
|
|
|
// Plot signals
|
|
plotshape(series=longSignal, location=location.belowbar, color=color.green, style=shape.labelup, title="Buy Signal", text="BUY")
|
|
plotshape(series=shortSignal, location=location.abovebar, color=color.red, style=shape.labeldown, title="Sell Signal", text="SELL")
|
|
|
|
// Plot highest and lowest points
|
|
plot(highestHigh, title="Highest High", color=color.purple, linewidth=2, offset=-lookback)
|
|
plot(lowestLow, title="Lowest Low", color=color.purple, linewidth=2, offset=-lookback)
|
|
|
|
```
|
|
|
|
> Detail
|
|
|
|
https://www.fmz.com/strategy/468350
|
|
|
|
> Last Modified
|
|
|
|
2024-09-26 17:21:15
|