
281 lines
23 KiB
Markdown
281 lines
23 KiB
Markdown
|
|
> Name
|
|
|
|
基于平均价海金阿什烛台与相对强弱指数的动态调仓策略Dynamic-Capital-Allocation-Strategy-Based-on-Heikin-Ashi-Candles-and-Relative-Strength-Index
|
|
|
|
> Author
|
|
|
|
ChaoZhang
|
|
|
|
> Strategy Description
|
|
|
|
|
|
[trans]
|
|
|
|
## 策略概述
|
|
|
|
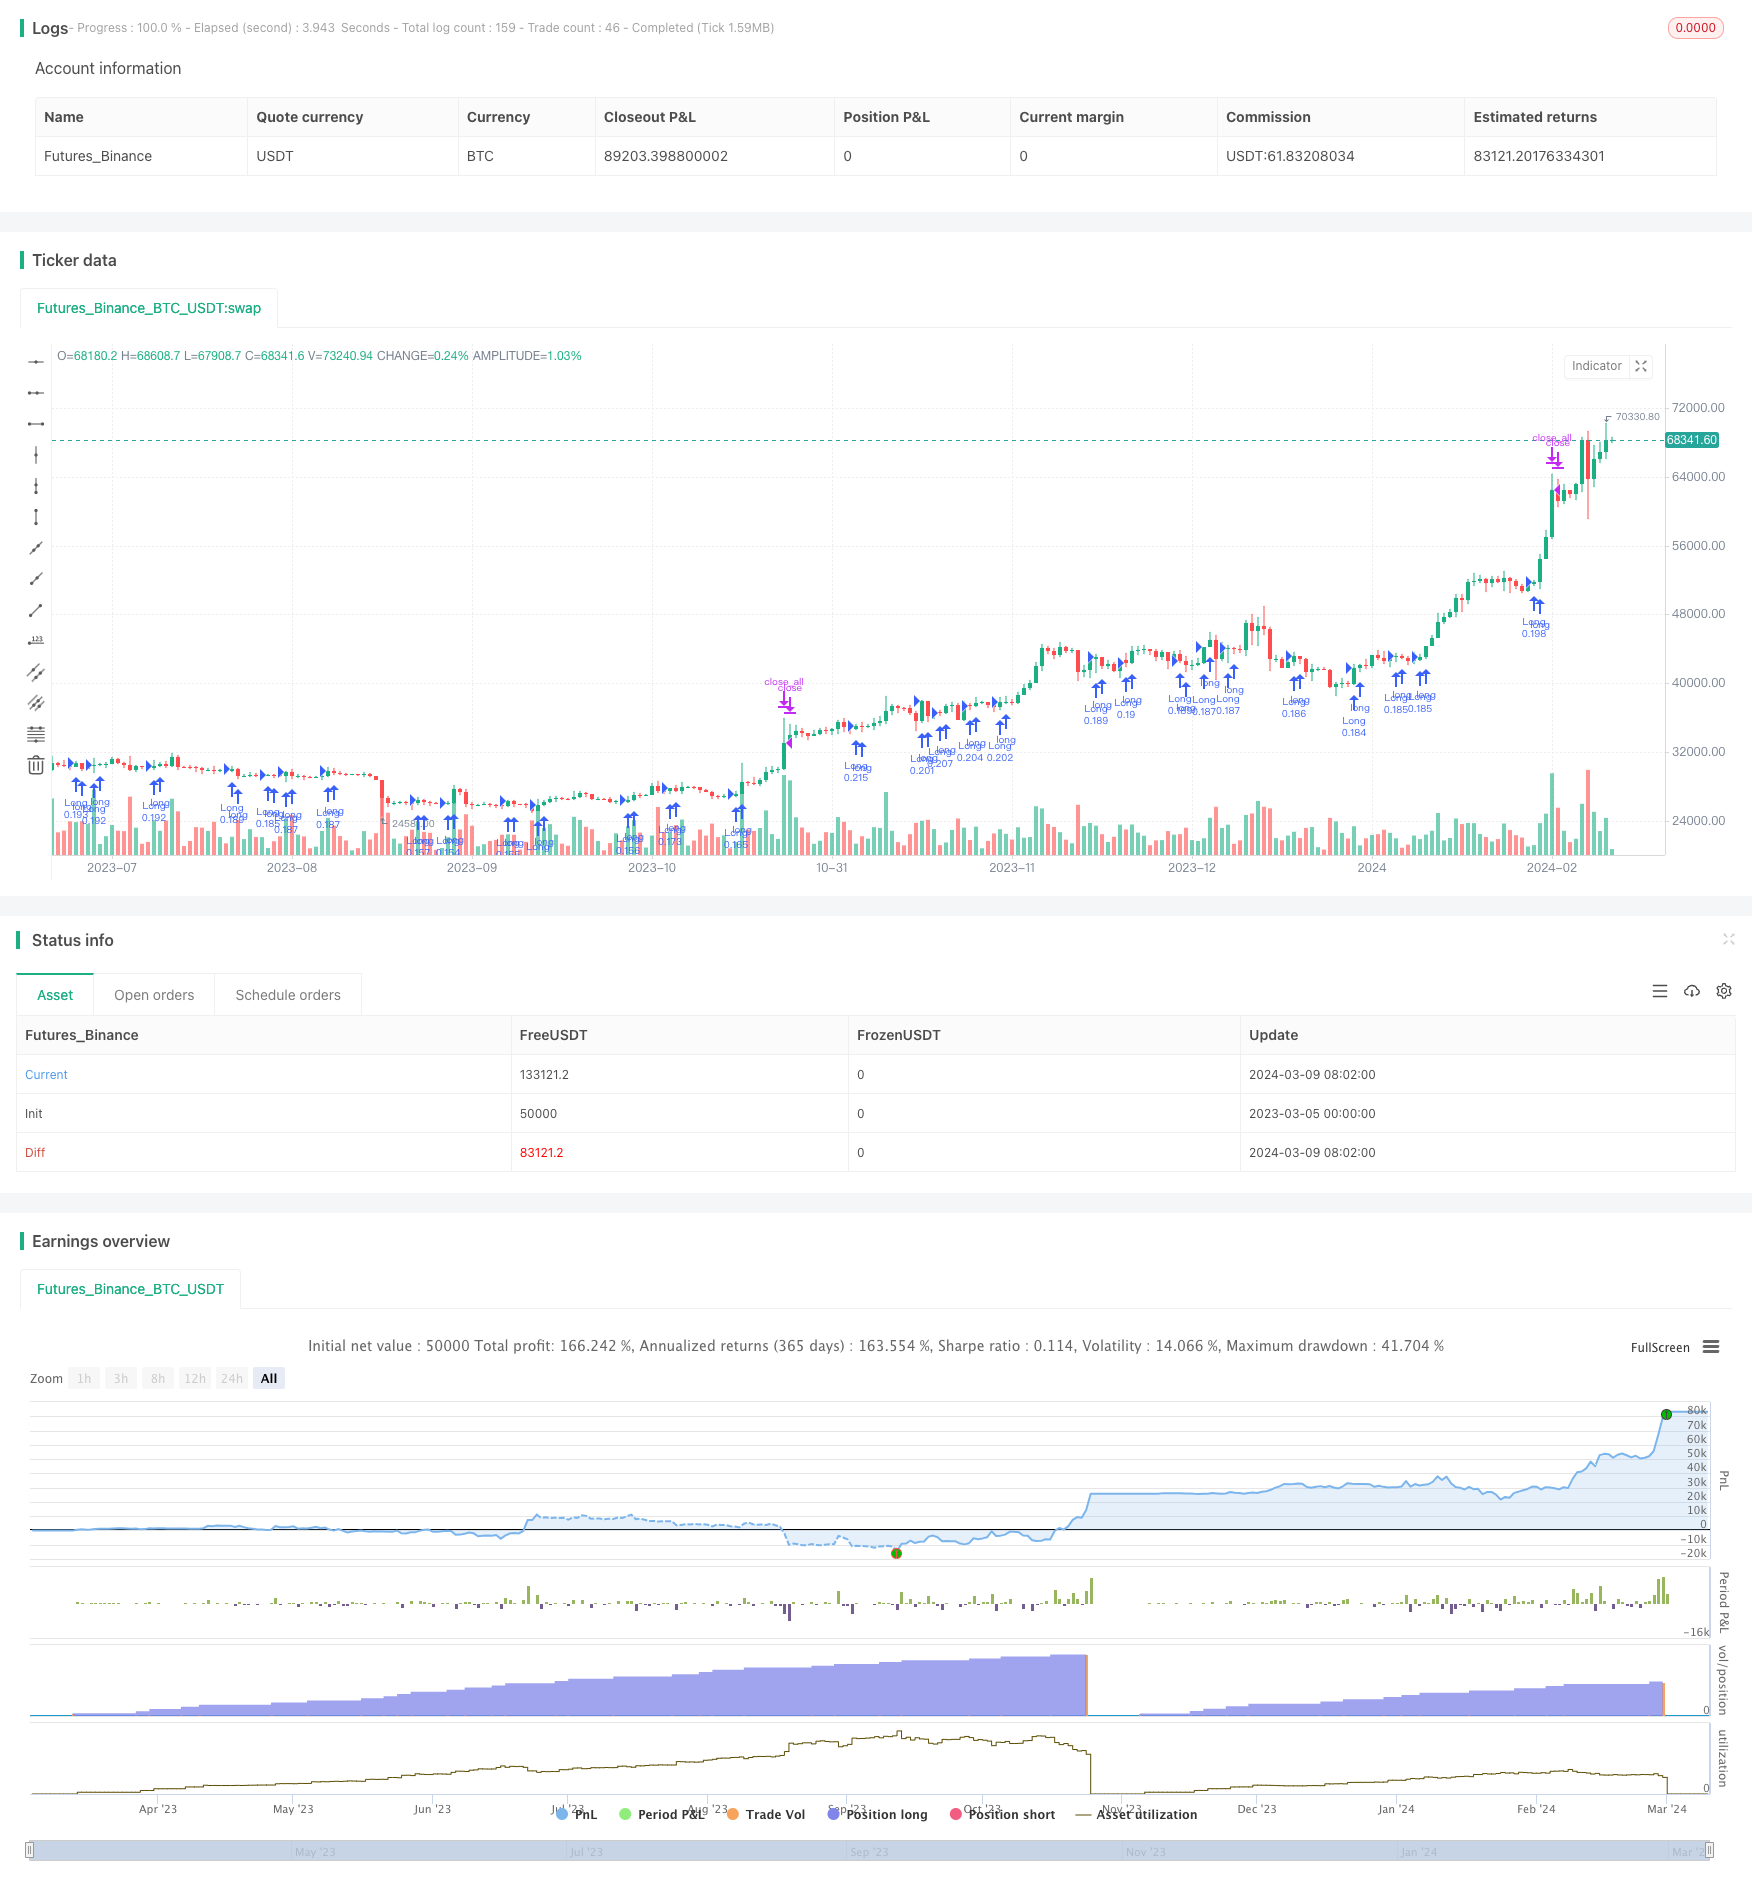
基于平均价海金阿什烛台与相对强弱指数的动态调仓策略(Dynamic Capital Allocation Strategy Based on Heikin Ashi Candles and Relative Strength Index),是一个强大的工具,用于识别在加密货币、股票和黄金等上升趋势资产中的做多进场和出场机会。该策略利用平均价海金阿什烛台模式和RSI指标来应对潜在的价格波动。
|
|
|
|
当看跌(红色)的平均价海金阿什烛台后出现看涨(绿色)烛台时,表明下跌趋势可能出现反转,就会产生买入信号。另外,RSI必须低于用户定义的阈值(默认值:85),以防止买入超买资产。
|
|
|
|
当RSI超过用户定义的出场水平(默认值:85)时,该策略退出交易,表明资产可能超买。
|
|
|
|
用户可以通过指定开始和结束年份来自定义回测期。
|
|
|
|
总的来说,基于平均价海金阿什烛台与相对强弱指数的动态调仓策略为寻求在趋势市场中利用平均价海金阿什烛台和RSI确认来把握做多机会的交易者提供了一种有价值的方法。
|
|
|
|
## 策略原理
|
|
|
|
基于平均价海金阿什烛台与相对强弱指数的动态调仓策略的核心原理是利用平均价海金阿什烛台模式识别潜在的趋势反转,并使用RSI指标作为确认信号。该策略的主要步骤如下:
|
|
|
|
1. 计算指定时间范围内的平均价海金阿什烛台。
|
|
2. 计算14周期RSI。
|
|
3. 当出现绿色平均价海金阿什烛台,且前一根烛台为红色,同时RSI低于用户定义的阈值(默认值:85)时,产生买入信号。
|
|
4. 当RSI超过用户定义的出场水平(默认值:85)时,平仓所有头寸。
|
|
5. 根据用户指定的开始和结束年份执行回测。
|
|
|
|
平均价海金阿什烛台通过平滑价格波动来识别趋势方向。当绿色烛台出现在红色烛台之后时,它表明下跌趋势可能正在失去动力,上涨趋势可能即将开始。
|
|
|
|
RSI用作确认指标,以避免在资产已经超买时买入。通过等待RSI低于特定阈值,该策略试图在上涨趋势的早期阶段进场。
|
|
|
|
一旦RSI超过用户定义的出场水平,该策略就会平仓所有头寸,以锁定利润并避免在潜在的趋势反转期间受到不利影响。
|
|
|
|
总之,基于平均价海金阿什烛台与相对强弱指数的动态调仓策略结合了趋势跟踪和动量确认,为在趋势市场中进行做多交易提供了一个稳健的框架。
|
|
|
|
## 策略优势
|
|
|
|
基于平均价海金阿什烛台与相对强弱指数的动态调仓策略具有以下几个主要优势:
|
|
|
|
1. 趋势识别:平均价海金阿什烛台通过平滑价格波动来帮助识别潜在的趋势反转。这使得该策略能够在上升趋势的早期阶段建立头寸。
|
|
|
|
2. 动量确认:通过使用RSI作为确认指标,该策略试图避免在资产已经超买时买入。这有助于降低在潜在的趋势反转期间进场的风险。
|
|
|
|
3. 动态出场:该策略根据RSI水平动态调整出场点。这使得它能够在不利的价格波动期间锁定利润并保护资本。
|
|
|
|
4. 广泛适用性:该策略可以应用于各种具有上升趋势特征的资产,包括加密货币、股票和黄金。这提供了广泛的市场机会。
|
|
|
|
5. 可定制性:用户可以根据自己的风险偏好和市场观点调整RSI阈值和回测期。这允许对策略进行定制,以适应不同的交易风格和目标。
|
|
|
|
总的来说,基于平均价海金阿什烛台与相对强弱指数的动态调仓策略提供了一个稳健的框架,用于在趋势市场中进行做多交易,同时通过动态出场和动量确认来管理风险。
|
|
|
|
## 策略风险
|
|
|
|
尽管基于平均价海金阿什烛台与相对强弱指数的动态调仓策略有几个显著的优势,但重要的是要认识到它也存在一些潜在的风险:
|
|
|
|
1. 错误信号:虽然平均价海金阿什烛台有助于识别趋势反转,但它们有时可能产生错误信号。这可能导致策略在次优条目点建立头寸。
|
|
|
|
2. 滞后指标:RSI是一个滞后指标,这意味着它基于历史价格数据。在快速变化的市场条件下,RSI信号可能会过时,导致策略反应不足。
|
|
|
|
3. 超买阈值:该策略依赖于用户定义的RSI阈值来识别超买条件。如果阈值设置不当,策略可能过早或过晚进场,从而错失机会或承担不必要的风险。
|
|
|
|
4. 缺乏止损:该策略没有明确的止损机制。这可能导致在不利的价格波动期间出现重大损失,特别是如果趋势反转比预期来得更快或更剧烈。
|
|
|
|
5. 过度拟合:用户可以自定义回测期和RSI阈值。然而,过度优化策略参数以适应历史数据可能导致过度拟合,限制了策略在未来市场条件下的表现。
|
|
|
|
为了缓解这些风险,交易者可以考虑以下潜在的解决方案:
|
|
|
|
1. 结合其他指标:将平均价海金阿什烛台和RSI与其他技术指标结合使用,如移动平均线或MACD,以提供额外的确认并减少错误信号。
|
|
|
|
2. 动态阈值:根据市场波动性或其他关键指标,实施动态RSI阈值,而不是依赖静态值。这可以帮助策略更好地适应不断变化的市场条件。
|
|
|
|
3. 纳入止损:考虑在策略中加入明确的止损机制,以限制在不利的价格波动期间的潜在损失。这可以基于技术水平、百分比回撤或风险金额。
|
|
|
|
4. 定期重新评估:定期重新评估和调整策略参数,以说明最新的市场发展和关键假设的任何变化。这有助于避免过度拟合并确保策略在当前市场环境下保持相关性。
|
|
|
|
通过认识到这些风险并采取适当的缓解措施,交易者可以更有效地利用基于平均价海金阿什烛台与相对强弱指数的动态调仓策略,同时限制潜在的缺点和陷阱。
|
|
|
|
## 策略优化
|
|
|
|
虽然基于平均价海金阿什烛台与相对强弱指数的动态调仓策略为在趋势市场中进行做多交易提供了一个稳健的框架,但仍有几个关键领域可以进行优化,以进一步提高其性能和风险管理:
|
|
|
|
1. 参数优化:该策略依赖于用户定义的RSI阈值和回测期等输入参数。通过系统地优化这些参数,同时考虑到过度拟合的风险,可以提高策略的表现。这可以通过使用优化技术来实现,如网格搜索、遗传算法或贝叶斯优化。
|
|
|
|
2. 风险管理:在策略中纳入更多的风险管理措施可以提高其稳健性并限制潜在损失。这可能包括基于技术水平、百分比回撤或风险金额的动态止损,以及基于波动性或其他风险指标的头寸规模调整。通过更好地控制风险敞口,该策略可以更好地经受住不利的市场波动。
|
|
|
|
3. 市场适应性:市场条件和特征随着时间的推移而变化。通过使用自适应机制,如动态阈值或基于市场状态的规则,可以提高该策略适应不断变化的市场环境的能力。这可以通过使用机器学习技术来实现,如在线学习算法,使策略能够根据最新的数据和洞察不断发展。
|
|
|
|
4. 多空信号:目前,该策略只关注做多机会。通过纳入做空信号,如在下跌趋势中使用看跌平均价海金阿什烛台模式,该策略可以利用更广泛的市场机会组合。这可以通过对现有规则进行修改或引入新的规则来实现,以适应做空交易。
|
|
|
|
5. 多资产多元化:该策略可以扩展到同时交易多种资产,如加密货币、股票和商品。通过在不同的资产类别和市场之间分散风险敞口,该策略可以受益于更广泛的多元化和非相关性。这可以通过使用资产配置模型或基于风险的头寸规模调整来实现。
|
|
|
|
通过在这些领域中实施优化,基于平均价海金阿什烛台与相对强弱指数的动态调仓策略可以变得更加强大、更具适应性和多样化。然而,重要的是要以循序渐进的方式进行变革,同时使用严格的回测和前瞻性分析来评估任何修改的影响。
|
|
|
|
## 总结
|
|
|
|
基于平均价海金阿什烛台与相对强弱指数的动态调仓策略提供了一个创新的方法来识别和利用在加密货币、股票和黄金等资产中的上升趋势机会。通过将平均价海金阿什烛台的趋势识别能力与RSI的动量确认相结合,该策略旨在在趋势的早期阶段进场,同时避免在已经超买的情况下进场。
|
|
|
|
该策略的关键优势在于其广泛的适用性、趋势识别和动态出场。它可以应用于各种具有上升趋势特征的市场,使用平均价海金阿什烛台来发现潜在的反转,并根据RSI水平动态调整出场以保护利润。此外,用户可以根据自己的偏好和目标定制策略参数。
|
|
|
|
然而,该策略也存在一些固有的风险,包括来自平均价海金阿什烛台的错误信号、RSI作为滞后指标的局限性、过度拟合的可能性以及缺乏明确的止损机制。为了缓解这些问题,交易者可以结合其他技术指标、实施动态阈值、纳入明确的止损规则并定期重新评估策略参数。
|
|
|
|
展望未来,基于平均价海金阿什烛台与相对强弱指数的动态调仓策略有几个有前景的优化领域。这些包括使用高级优化技术进行参数调整,加强风险管理措施,提高对不断变化的市场条件的适应性,纳入做空信号以及扩展到多资产多元化。通过在这些领域进行迭代改进,该策略可以变得更加强大和全面。
|
|
|
|
总之,基于平均价海金阿什烛台与相对强弱指数的动态调仓策略为在趋势市场中进行做多交易提供了一个有前景的框架。尽管存在一些局限性和风险,但通过谨慎的实施、持续的优化和对市场条件的适应,该策略有可能产生更高的回报,同时控制潜在的损失。如同任何交易策略一样,纪律执行和持续的监控对于其成功至关重要。
|
|
|
|
||
|
|
|
|
## Strategy Overview
|
|
|
|
The Dynamic Capital Allocation Strategy Based on Heikin Ashi Candles and Relative Strength Index is a powerful tool for identifying long entry and exit opportunities in uptrending assets like cryptocurrencies, stocks, and gold. This strategy leverages the Heikin Ashi candlestick pattern and the RSI indicator to navigate potential price swings.
|
|
|
|
A buy signal is generated when a bullish (green) Heikin Ashi candle appears after a bearish (red) one, indicating a potential reversal in a downtrend. Additionally, the RSI must be below a user-defined threshold (default: 85) to prevent buying overbought assets.
|
|
|
|
The strategy exits the trade when the RSI surpasses the user-defined exit level (default: 85), suggesting the asset might be overbought.
|
|
|
|
Users can customize the backtesting period by specifying the start and end years.
|
|
|
|
Overall, the Dynamic Capital Allocation Strategy Based on Heikin Ashi Candles and Relative Strength Index offers a valuable approach for traders seeking to capitalize on long opportunities in trending markets with the help of Heikin Ashi candles and RSI confirmation.
|
|
|
|
## Strategy Principles
|
|
|
|
The core principles of the Dynamic Capital Allocation Strategy Based on Heikin Ashi Candles and Relative Strength Index revolve around using the Heikin Ashi candlestick pattern to identify potential trend reversals and the RSI indicator as a confirmation signal. The main steps of the strategy are as follows:
|
|
|
|
1. Calculate Heikin Ashi candles for the specified time period.
|
|
2. Calculate the 14-period RSI.
|
|
3. Generate a buy signal when a green Heikin Ashi candle appears after a red one, and the RSI is below the user-defined threshold (default: 85).
|
|
4. Exit all positions when the RSI exceeds the user-defined exit level (default: 85).
|
|
5. Execute the backtest based on the user-specified start and end years.
|
|
|
|
Heikin Ashi candles help identify trend direction by smoothing out price fluctuations. When a green candle appears after a red one, it suggests that a downtrend may be losing momentum and an uptrend could be starting.
|
|
|
|
The RSI is used as a confirmation indicator to avoid buying when the asset is already overbought. By waiting for the RSI to be below a specific threshold, the strategy attempts to enter long positions early in an uptrend.
|
|
|
|
Once the RSI exceeds the user-defined exit level, the strategy closes all positions to lock in profits and avoid being adversely affected during a potential trend reversal.
|
|
|
|
In summary, the Dynamic Capital Allocation Strategy Based on Heikin Ashi Candles and Relative Strength Index combines trend following with momentum confirmation to provide a robust framework for taking long trades in trending markets.
|
|
|
|
## Strategy Advantages
|
|
|
|
The Dynamic Capital Allocation Strategy Based on Heikin Ashi Candles and Relative Strength Index offers several key advantages:
|
|
|
|
1. Trend identification: Heikin Ashi candles help identify potential trend reversals by smoothing out price fluctuations. This allows the strategy to establish positions early in an uptrend.
|
|
|
|
2. Momentum confirmation: By using the RSI as a confirmation indicator, the strategy seeks to avoid buying when the asset is already overbought. This helps mitigate the risk of entering during a potential trend reversal.
|
|
|
|
3. Dynamic exit: The strategy dynamically adjusts the exit point based on the RSI level. This allows it to lock in profits and protect capital during adverse price movements.
|
|
|
|
4. Broad applicability: The strategy can be applied to various assets that exhibit uptrending characteristics, including cryptocurrencies, stocks, and gold. This provides a wide range of market opportunities.
|
|
|
|
5. Customizability: Users can adjust the RSI thresholds and backtest period according to their risk preferences and market outlook. This allows for tailoring the strategy to different trading styles and objectives.
|
|
|
|
Overall, the Dynamic Capital Allocation Strategy Based on Heikin Ashi Candles and Relative Strength Index provides a robust framework for taking long trades in trending markets while managing risk through dynamic exits and momentum confirmation.
|
|
|
|
## Strategy Risks
|
|
|
|
While the Dynamic Capital Allocation Strategy Based on Heikin Ashi Candles and Relative Strength Index has several notable advantages, it's important to recognize that it also carries some potential risks:
|
|
|
|
1. False signals: Although Heikin Ashi candles help identify trend reversals, they can sometimes generate false signals. This may lead to the strategy establishing positions at suboptimal entry points.
|
|
|
|
2. Lagging indicator: The RSI is a lagging indicator, meaning it is based on historical price data. In rapidly changing market conditions, RSI signals may become outdated, causing the strategy to be slow to react.
|
|
|
|
3. Overbought threshold: The strategy relies on a user-defined RSI threshold to identify overbought conditions. If the threshold is not set appropriately, the strategy may enter too early or too late, missing out on opportunities or taking on unnecessary risk.
|
|
|
|
4. Lack of stop-loss: The strategy does not have an explicit stop-loss mechanism. This can lead to significant losses during adverse price movements, particularly if a trend reversal occurs faster or more severely than anticipated.
|
|
|
|
5. Overfitting: Users can customize the backtest period and RSI thresholds. However, over-optimizing the strategy parameters to fit historical data may lead to overfitting, limiting the strategy's performance in future market conditions.
|
|
|
|
To mitigate these risks, traders can consider the following potential solutions:
|
|
|
|
1. Combine with other indicators: Use Heikin Ashi candles and RSI in conjunction with other technical indicators, such as moving averages or MACD, to provide additional confirmation and reduce false signals.
|
|
|
|
2. Dynamic thresholds: Implement dynamic RSI thresholds that adapt to market volatility or other key indicators, rather than relying on static values. This can help the strategy better adapt to changing market conditions.
|
|
|
|
3. Incorporate stop-loss: Consider adding an explicit stop-loss mechanism to the strategy to limit potential losses during adverse price movements. This can be based on technical levels, percentage drawdowns, or risk amounts.
|
|
|
|
4. Regular re-evaluation: Periodically reassess and adjust the strategy parameters to account for the latest market developments and any changes to key assumptions. This helps avoid overfitting and ensures the strategy remains relevant to the current market environment.
|
|
|
|
By recognizing these risks and taking appropriate mitigation measures, traders can more effectively harness the Dynamic Capital Allocation Strategy Based on Heikin Ashi Candles and Relative Strength Index while limiting potential drawdowns and pitfalls.
|
|
|
|
## Strategy Optimization
|
|
|
|
While the Dynamic Capital Allocation Strategy Based on Heikin Ashi Candles and Relative Strength Index provides a robust framework for taking long trades in trending markets, there are several key areas where it can be optimized to further enhance its performance and risk management:
|
|
|
|
1. Parameter optimization: The strategy relies on user-defined input parameters, such as the RSI thresholds and backtest period. By systematically optimizing these parameters while considering the risk of overfitting, the strategy's performance can be improved. This can be achieved using optimization techniques like grid search, genetic algorithms, or Bayesian optimization.
|
|
|
|
2. Risk management: Incorporating additional risk management measures into the strategy can enhance its robustness and limit potential losses. This may include dynamic stop-losses based on technical levels, percentage drawdowns, or risk amounts, as well as position sizing adjustments based on volatility or other risk indicators. By better controlling risk exposure, the strategy can better withstand adverse market fluctuations.
|
|
|
|
3. Market adaptability: Market conditions and characteristics change over time. By employing adaptive mechanisms, such as dynamic thresholds or market regime-based rules, the strategy's ability to adapt to evolving market environments can be improved. This can be achieved using machine learning techniques, such as online learning algorithms, allowing the strategy to continuously evolve based on the latest data and insights.
|
|
|
|
4. Short selling signals: Currently, the strategy only focuses on long opportunities. By incorporating short selling signals, such as bearish Heikin Ashi candle patterns in downtrends, the strategy can take advantage of a wider range of market opportunities. This can be achieved by modifying the existing rules or introducing new ones to accommodate short trades.
|
|
|
|
5. Multi-asset diversification: The strategy can be expanded to trade multiple assets simultaneously, such as cryptocurrencies, stocks, and commodities. By diversifying risk exposure across different asset classes and markets, the strategy can benefit from broader diversification and uncorrelated returns. This can be achieved using asset allocation models or risk-based position sizing.
|
|
|
|
By implementing optimizations in these areas, the Dynamic Capital Allocation Strategy Based on Heikin Ashi Candles and Relative Strength Index can become more robust, adaptable, and diversified. However, it's important to make changes incrementally while employing rigorous backtesting and forward-looking analysis to evaluate the impact of any modifications.
|
|
|
|
## Conclusion
|
|
|
|
The Dynamic Capital Allocation Strategy Based on Heikin Ashi Candles and Relative Strength Index offers an innovative approach to identifying and capitalizing on uptrend opportunities in assets like cryptocurrencies, stocks, and gold. By combining the trend-identifying capabilities of Heikin Ashi candles with the momentum confirmation of the RSI, the strategy aims to enter long positions early in a trend while avoiding entries when the asset is already overbought.
|
|
|
|
The key strengths of the strategy lie in its broad applicability, trend identification, and dynamic exit. It can be applied to various markets that exhibit uptrending characteristics, uses Heikin Ashi candles to spot potential reversals, and dynamically adjusts the exit based on RSI levels to protect profits. Additionally, users can customize the strategy parameters according to their preferences and objectives.
|
|
|
|
However, the strategy also carries some inherent risks, including false signals from Heikin Ashi candles, limitations of the RSI as a lagging indicator, potential for overfitting, and the lack of an explicit stop-loss mechanism. To mitigate these issues, traders can combine other technical indicators, implement dynamic thresholds, incorporate clear stop-loss rules, and periodically re-evaluate the strategy parameters.
|
|
|
|
Looking ahead, there are several promising areas for optimization of the Dynamic Capital Allocation Strategy Based on Heikin Ashi Candles and Relative Strength Index. These include parameter tuning using advanced optimization techniques, enhanced risk management measures, improved adaptability to changing market conditions, incorporation of short selling signals, and expansion into multi-asset diversification. By iteratively improving in these areas, the strategy can become more powerful and comprehensive.
|
|
|
|
In conclusion, the Dynamic Capital Allocation Strategy Based on Heikin Ashi Candles and Relative Strength Index provides a promising framework for taking long trades in trending markets. Despite some limitations and risks, with careful implementation, continuous optimization, and adaptation to market conditions, the strategy has the potential to generate superior returns while controlling potential losses. As with any trading strategy, disciplined execution and ongoing monitoring are crucial to its success.
|
|
[/trans]
|
|
|
|
> Strategy Arguments
|
|
|
|
|
|
|
|
|Argument|Default|Description|
|
|
|----|----|----|
|
|
|v_input_int_1|2014|Start year|
|
|
|v_input_int_2|2030|End year|
|
|
|v_input_int_3|85|RSI Exit|
|
|
|
|
|
|
> Source (PineScript)
|
|
|
|
``` pinescript
|
|
/*backtest
|
|
start: 2023-03-05 00:00:00
|
|
end: 2024-03-10 00:00:00
|
|
period: 1d
|
|
basePeriod: 1h
|
|
exchanges: [{"eid":"Futures_Binance","currency":"BTC_USDT"}]
|
|
*/
|
|
|
|
// This source code is subject to the terms of the Mozilla Public License 2.0 at https://mozilla.org/MPL/2.0/
|
|
// © topgun31
|
|
|
|
//@version=5
|
|
strategy('DCA Strategy', overlay = true, currency = currency.USD, initial_capital = 100, default_qty_value = 10, pyramiding = 10000, default_qty_type = strategy.percent_of_equity, commission_value = 0.1, commission_type = strategy.commission.percent, slippage = 2)
|
|
|
|
startYear = input.int(2014, 'Start year', tooltip = 'The year at which the strategy to start backtesting')
|
|
endYear = input.int(2030, 'End year', tooltip = 'The year at which the strategy to stop backtesting')
|
|
rsiExit = input.int(85, 'RSI Exit', tooltip = 'The RSI value to exit at')
|
|
|
|
// Period
|
|
start = timestamp(startYear, 1, 1, 00, 00)
|
|
finish = timestamp(endYear, 1, 1, 00, 00)
|
|
window() => true
|
|
|
|
// Heikin Ashi
|
|
openD = request.security(ticker.heikinashi(syminfo.tickerid), timeframe.period, open)
|
|
closeD = request.security(ticker.heikinashi(syminfo.tickerid), timeframe.period, close)
|
|
|
|
// RSI
|
|
rsi = ta.rsi(close, 14)
|
|
greenCandle = closeD > openD
|
|
redCandle = closeD < openD
|
|
|
|
exit = rsi > rsiExit // 82
|
|
|
|
if (greenCandle and redCandle[1] and rsi < rsiExit and window())
|
|
strategy.entry('Long', strategy.long, comment = 'BUY ' + syminfo.ticker)
|
|
|
|
if (exit)
|
|
strategy.close_all(comment = 'SELL ' + syminfo.ticker)
|
|
|
|
```
|
|
|
|
> Detail
|
|
|
|
https://www.fmz.com/strategy/444355
|
|
|
|
> Last Modified
|
|
|
|
2024-03-11 11:43:54
|