
248 lines
9.1 KiB
Markdown
248 lines
9.1 KiB
Markdown
|
|
> Name
|
|
|
|
基于布林带的突破策略Bollinger-Breakout-Strategy
|
|
|
|
> Author
|
|
|
|
ChaoZhang
|
|
|
|
> Strategy Description
|
|
|
|
|
|
[trans]
|
|
|
|
## 概述
|
|
|
|
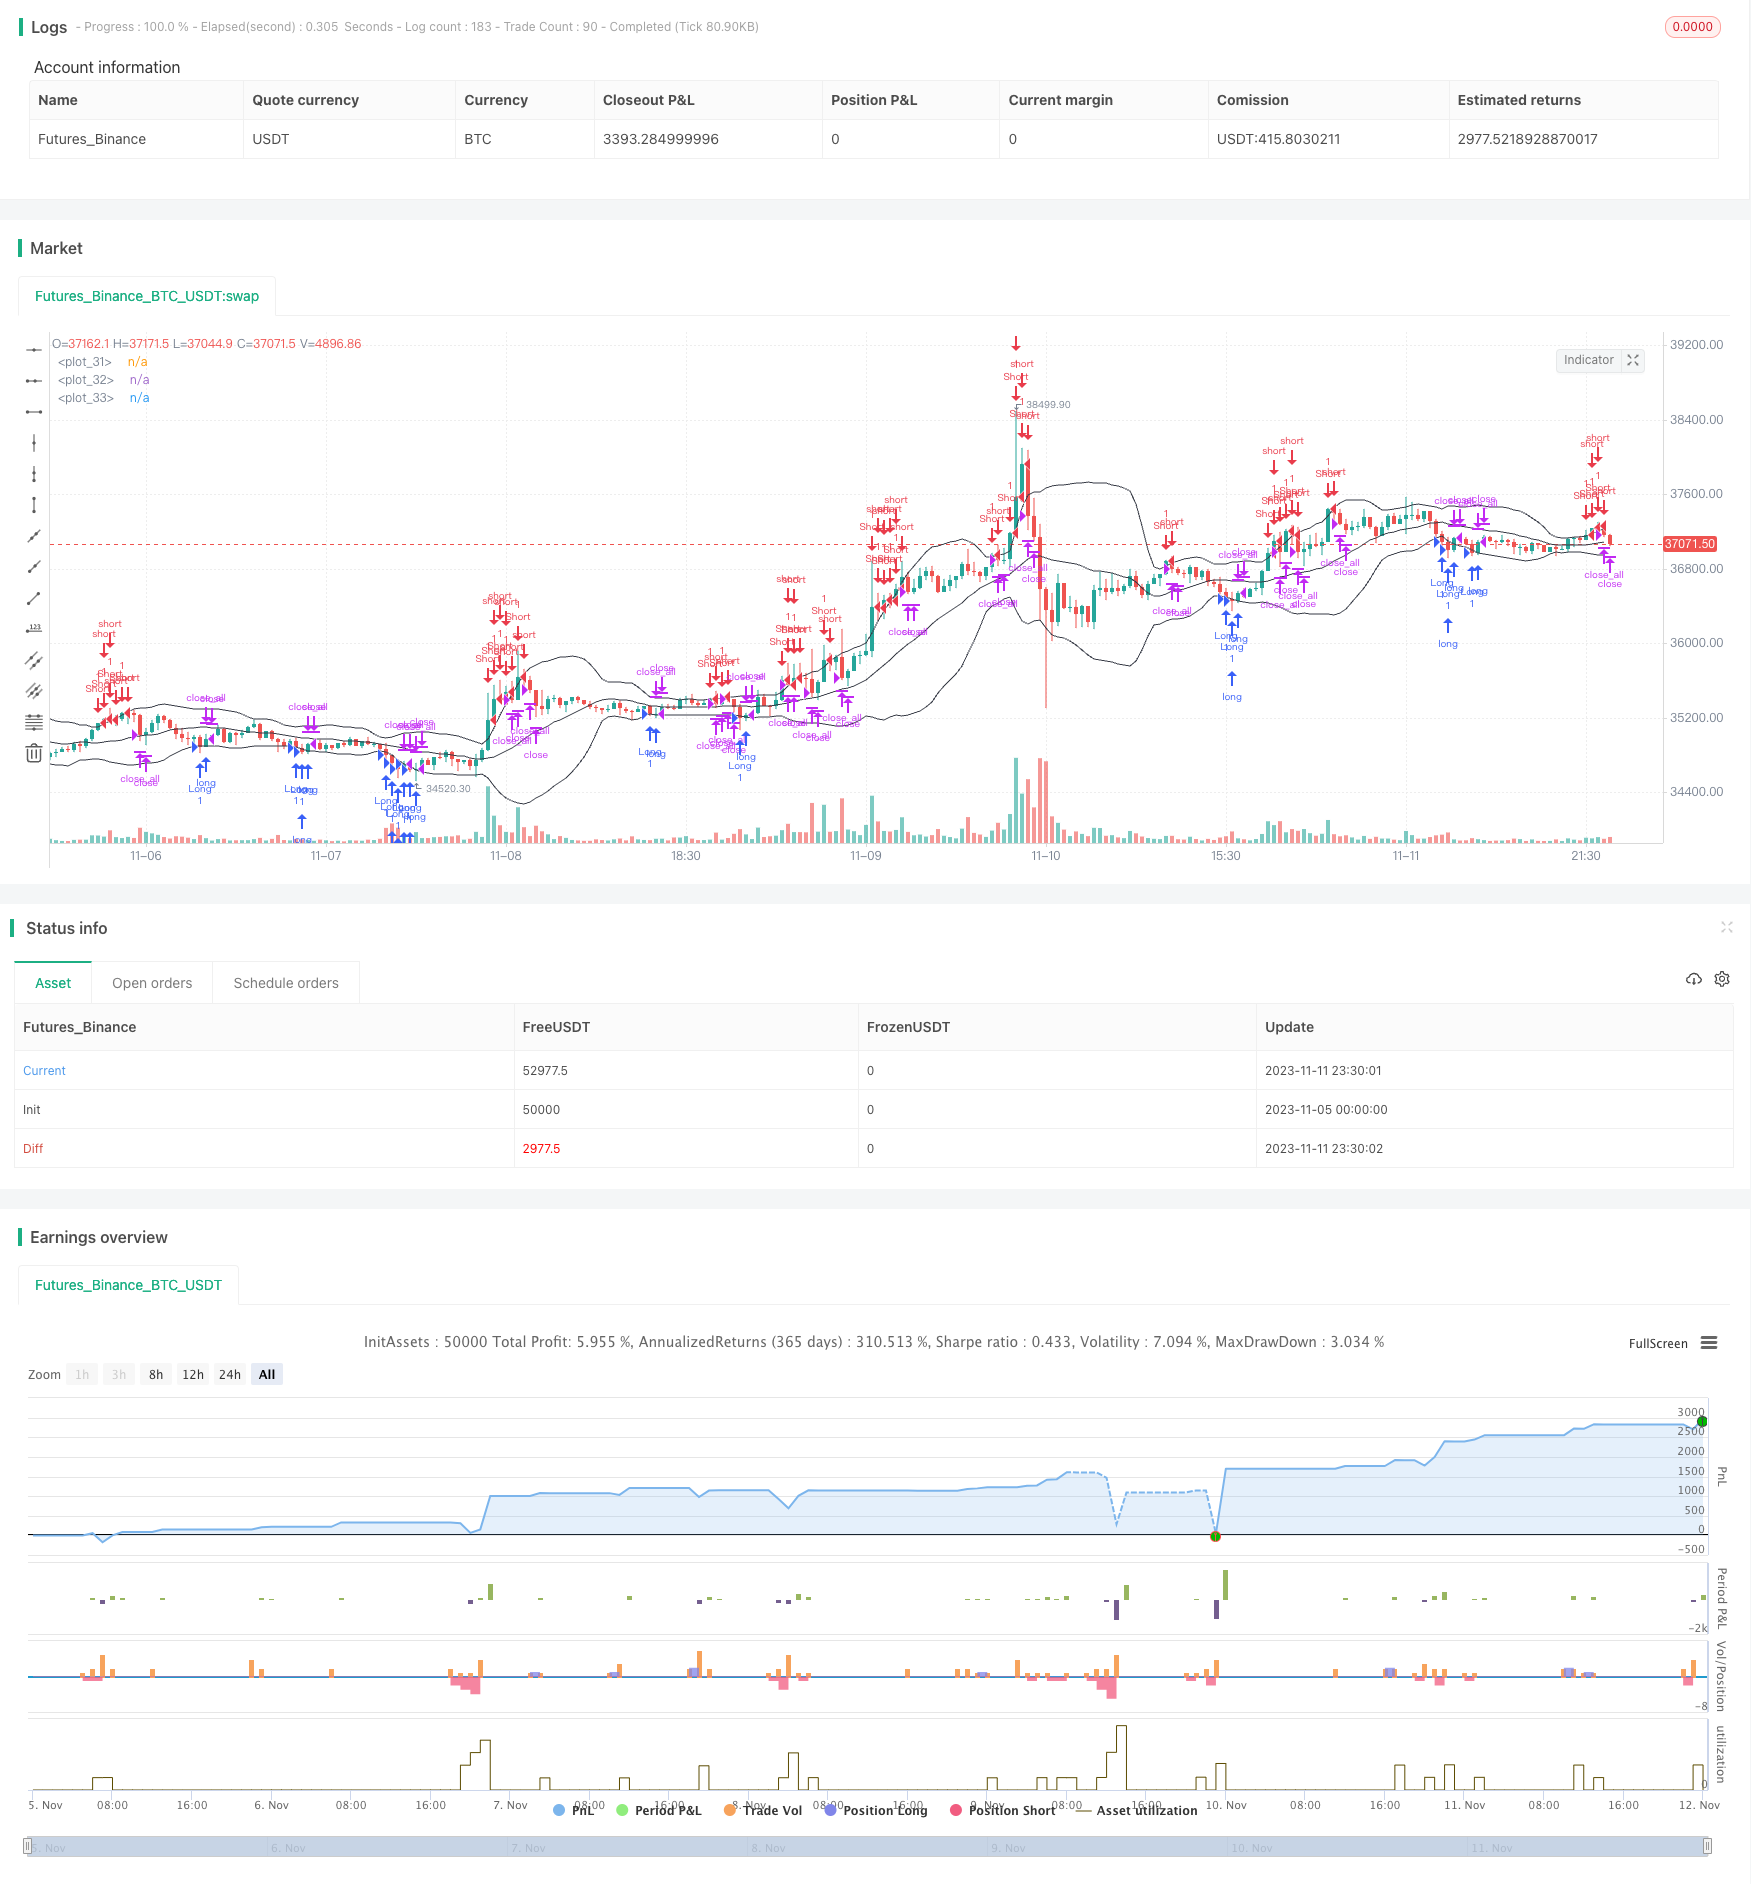
该策略是基于布林带指标的突破策略,利用布林带上下轨Provide突破信号,进行买入和卖出操作。该策略同时具有追踪止损和加仓机制,可以在趋势行情中获得更高收益。
|
|
|
|
## 策略原理
|
|
|
|
该策略首先计算布林带的中轨、上轨和下轨。中轨是价格的移动平均线,上轨和下轨分别是中轨上下各自一个标准差。
|
|
|
|
当价格上穿下轨时,产生买入信号;当价格下穿上轨时,产生卖出信号。这表示价格突破布林带范围,可能进入趋势行情。
|
|
|
|
此外,该策略还判断实体突破,如果收盘价高于开盘价,且实体突破中轨一定比例,则平仓;如果收盘价低于开盘价,且实体突破中轨一定比例,则平仓。这可以避免假突破带来的损失。
|
|
|
|
在开仓后,该策略可以进行止损和加仓操作。如果价格继续朝有利方向运行,则可以加大仓位,增加盈利可能。如果价格反转,通过止损来控制风险。
|
|
|
|
## 优势分析
|
|
|
|
该策略具有以下优势:
|
|
|
|
1. 利用布林带指标判断趋势方向和突破,这种技术指标简单有效。
|
|
|
|
2. 结合实体和中轨判断突破可靠性,可避免假突破带来损失。
|
|
|
|
3. 采用追踪止损来控制风险,可锁定盈利。
|
|
|
|
4. 采用加仓方式,可以在趋势行情中获得更高收益。
|
|
|
|
5. 策略逻辑清晰易理解,参数设置简单,易于实施。
|
|
|
|
## 风险分析
|
|
|
|
该策略也存在以下风险:
|
|
|
|
1. 布林带突破无法完全避免假突破,仍存在一定损失风险。
|
|
|
|
2. 止损点设置不当可能造成过早止损或止损无效。
|
|
|
|
3. 加仓次数和加仓比例设定不当可能导致亏损扩大。
|
|
|
|
4. 趋势反转时无法及时止损退出,可能带来较大亏损。
|
|
|
|
5. 参数优化不够充分,可能导致策略效果不佳。
|
|
|
|
6. 存在过拟合风险,需要在不同市场中进行验证。
|
|
|
|
## 优化方向
|
|
|
|
该策略可以从以下几个方面进行优化:
|
|
|
|
1. 对布林带参数进行测试和优化,找到更合适的参数组合。
|
|
|
|
2. 测试不同的止损策略,设定更精确的止损点。
|
|
|
|
3. 对加仓次数和加仓比例进行测试,找到最优参数。
|
|
|
|
4. 增加趋势判断指标,避免逆势加仓。
|
|
|
|
5. 优化实体突破的判断逻辑,降低假突破概率。
|
|
|
|
6. 增加条件单功能,根据不同市场情况使用不同的参数组合。
|
|
|
|
7. 在更多不同的品种和时间周期中进行回测,提高稳定性。
|
|
|
|
8. 采用机器学习等方法自动优化参数。
|
|
|
|
## 总结
|
|
|
|
总体来说,该策略利用布林带指标判断趋势方向和突破信号,并配以止损、加仓等功能,可以获得较好的效果。但也存在一定的风险,需要通过参数优化、增加条件判断等方式进行改进,使策略更稳定可靠。此策略适合熟悉技术分析的投资者使用,可以在趋势行情中获得较好收益。
|
|
|
|
||
|
|
|
|
|
|
## Overview
|
|
|
|
This is a breakout strategy based on the Bollinger Bands indicator. It utilizes the upper and lower bands of Bollinger Bands to generate breakout signals for entry and exit. This strategy also incorporates trailing stop loss and pyramiding mechanism to achieve higher return in trending markets.
|
|
|
|
## Strategy Logic
|
|
|
|
The strategy first calculates the middle band, upper band and lower band of Bollinger Bands. The middle band is the moving average of price, while the upper and lower bands are middle band +/- one standard deviation.
|
|
|
|
When price breaks above the lower band, a long signal is generated. When price breaks below the upper band, a short signal is generated. This indicates the price is breaking out of the Bollinger Bands range and may enter a trending move.
|
|
|
|
In addition, the strategy checks for body breakout. If the close is higher than open and the body penetrates the middle band by certain percentage, it will flatten position. If close is lower than open and the body penetrates the middle band by certain percentage, it will also flatten position. This avoids losses from false breakouts.
|
|
|
|
After entering positions, the strategy can trail stop loss and pyramid. If price continues to move in favorable direction, position size can be increased to improve profit potential. If price reverses, stop loss is used to control risk.
|
|
|
|
## Advantage Analysis
|
|
|
|
The advantages of this strategy are:
|
|
|
|
1. Utilize Bollinger Bands to determine trend direction and catch breakouts. This indicator is simple and effective.
|
|
|
|
2. Check body and middle band to determine breakout validity, avoiding losses from false breakouts.
|
|
|
|
3. Use trailing stop loss to lock in profits and control risk.
|
|
|
|
4. Use pyramiding to achieve higher returns in trending moves.
|
|
|
|
5. Clear logic and easy to understand. Simple parameters make this strategy easy to implement.
|
|
|
|
## Risk Analysis
|
|
|
|
The risks of this strategy include:
|
|
|
|
1. Bollinger Bands breakouts cannot completely avoid false breakouts, some losses may occur.
|
|
|
|
2. Improper stop loss placement may cause premature stop out or fail to limit losses.
|
|
|
|
3. Excessive pyramiding times and size may lead to amplified losses.
|
|
|
|
4. Failure to timely stop out when trend reverses may lead to large drawdowns.
|
|
|
|
5. Insufficient parameter optimization may lead to underperformance.
|
|
|
|
6. Overfitting risk. Requires validation across different markets.
|
|
|
|
## Optimization Directions
|
|
|
|
The strategy can be improved from the following aspects:
|
|
|
|
1. Test and optimize Bollinger Bands parameters to find better combinations.
|
|
|
|
2. Test different stop loss strategies and optimize stop loss placement.
|
|
|
|
3. Test and find optimal pyramiding times and size.
|
|
|
|
4. Add trend filter to avoid pyramiding against the trend.
|
|
|
|
5. Optimize body breakout logic to reduce false breakouts.
|
|
|
|
6. Add conditional orders to utilize different parameter sets based on market conditions.
|
|
|
|
7. Conduct more backtests across different products and timeframes to improve robustness.
|
|
|
|
8. Utilize machine learning to automatically optimize parameters.
|
|
|
|
## Conclusion
|
|
|
|
In summary, this strategy utilizes Bollinger Bands to determine trend direction and catch breakouts, with additional stop loss, pyramiding and other functions to achieve good results. But risks exist, requiring parameter optimization, adding conditions etc to improve robustness. It suits investors familiar with technical analysis and can produce good returns in trending markets.
|
|
|
|
[/trans]
|
|
|
|
> Strategy Arguments
|
|
|
|
|
|
|
|
|Argument|Default|Description|
|
|
|----|----|----|
|
|
|v_input_1|true|Long|
|
|
|v_input_2|true|Short|
|
|
|v_input_3|20|Bollinger Length|
|
|
|v_input_4|2|Bollinger Mult|
|
|
|v_input_5_ohlc4|0|Bollinger Source: ohlc4|high|low|open|hl2|hlc3|hlcc4|close|
|
|
|v_input_6|true|Show Bollinger Bands|
|
|
|v_input_7|2018|From Year|
|
|
|v_input_8|2100|To Year|
|
|
|v_input_9|true|From Month|
|
|
|v_input_10|12|To Month|
|
|
|v_input_11|true|From day|
|
|
|v_input_12|31|To day|
|
|
|
|
|
|
> Source (PineScript)
|
|
|
|
``` pinescript
|
|
/*backtest
|
|
start: 2023-11-05 00:00:00
|
|
end: 2023-11-12 00:00:00
|
|
period: 30m
|
|
basePeriod: 15m
|
|
exchanges: [{"eid":"Futures_Binance","currency":"BTC_USDT"}]
|
|
*/
|
|
|
|
//Noro
|
|
//2018
|
|
|
|
//@version=2
|
|
strategy("Noro's Bollinger Strategy v1.1", shorttitle = "Bollinger str 1.1", overlay = true, default_qty_type = strategy.percent_of_equity, default_qty_value = 100.0, pyramiding = 5)
|
|
|
|
//Settings
|
|
needlong = input(true, defval = true, title = "Long")
|
|
needshort = input(true, defval = true, title = "Short")
|
|
|
|
length = input(20, defval = 20, minval = 1, maxval = 1000, title = "Bollinger Length")
|
|
mult = input(2.0, minval = 0.001, maxval = 50, title = "Bollinger Mult")
|
|
source = input(ohlc4, defval = ohlc4, title = "Bollinger Source")
|
|
|
|
showbands = input(true, defval = true, title = "Show Bollinger Bands")
|
|
fromyear = input(2018, defval = 2018, minval = 1900, maxval = 2100, title = "From Year")
|
|
toyear = input(2100, defval = 2100, minval = 1900, maxval = 2100, title = "To Year")
|
|
frommonth = input(01, defval = 01, minval = 01, maxval = 12, title = "From Month")
|
|
tomonth = input(12, defval = 12, minval = 01, maxval = 12, title = "To Month")
|
|
fromday = input(01, defval = 01, minval = 01, maxval = 31, title = "From day")
|
|
today = input(31, defval = 31, minval = 01, maxval = 31, title = "To day")
|
|
|
|
//Bollinger Bands
|
|
basis = sma(source, length)
|
|
dev = mult * stdev(source, length)
|
|
upper = basis + dev
|
|
lower = basis - dev
|
|
|
|
//Lines
|
|
col = showbands ? black : na
|
|
plot(upper, linewidth = 1, color = col)
|
|
plot(basis, linewidth = 1, color = col)
|
|
plot(lower, linewidth = 1, color = col)
|
|
|
|
//Body
|
|
body = abs(close - open)
|
|
abody = ema(body, 30)
|
|
|
|
//Signals
|
|
up = close <= lower
|
|
dn = close >= upper
|
|
exit = (strategy.position_size > 0 and close > open) or (strategy.position_size < 0 and close < open) and body > abody / 2
|
|
|
|
//Trading
|
|
if up
|
|
strategy.entry("Long", strategy.long, needlong == false ? 0 : na, when=(time > timestamp(fromyear, frommonth, fromday, 00, 00) and time < timestamp(toyear, tomonth, today, 00, 00)))
|
|
|
|
if dn
|
|
strategy.entry("Short", strategy.short, needshort == false ? 0 : na, when=(time > timestamp(fromyear, frommonth, fromday, 00, 00) and time < timestamp(toyear, tomonth, today, 00, 00)))
|
|
|
|
if time > timestamp(toyear, tomonth, today, 00, 00) or exit
|
|
strategy.close_all()
|
|
```
|
|
|
|
> Detail
|
|
|
|
https://www.fmz.com/strategy/431891
|
|
|
|
> Last Modified
|
|
|
|
2023-11-13 10:19:43
|