
142 lines
9.5 KiB
Markdown
142 lines
9.5 KiB
Markdown
|
|
> Name
|
|
|
|
基于布林带的多头策略Bollinger-Bands-Long-Only-Strategy
|
|
|
|
> Author
|
|
|
|
ChaoZhang
|
|
|
|
> Strategy Description
|
|
|
|
|
|
[trans]
|
|
|
|
概述:
|
|
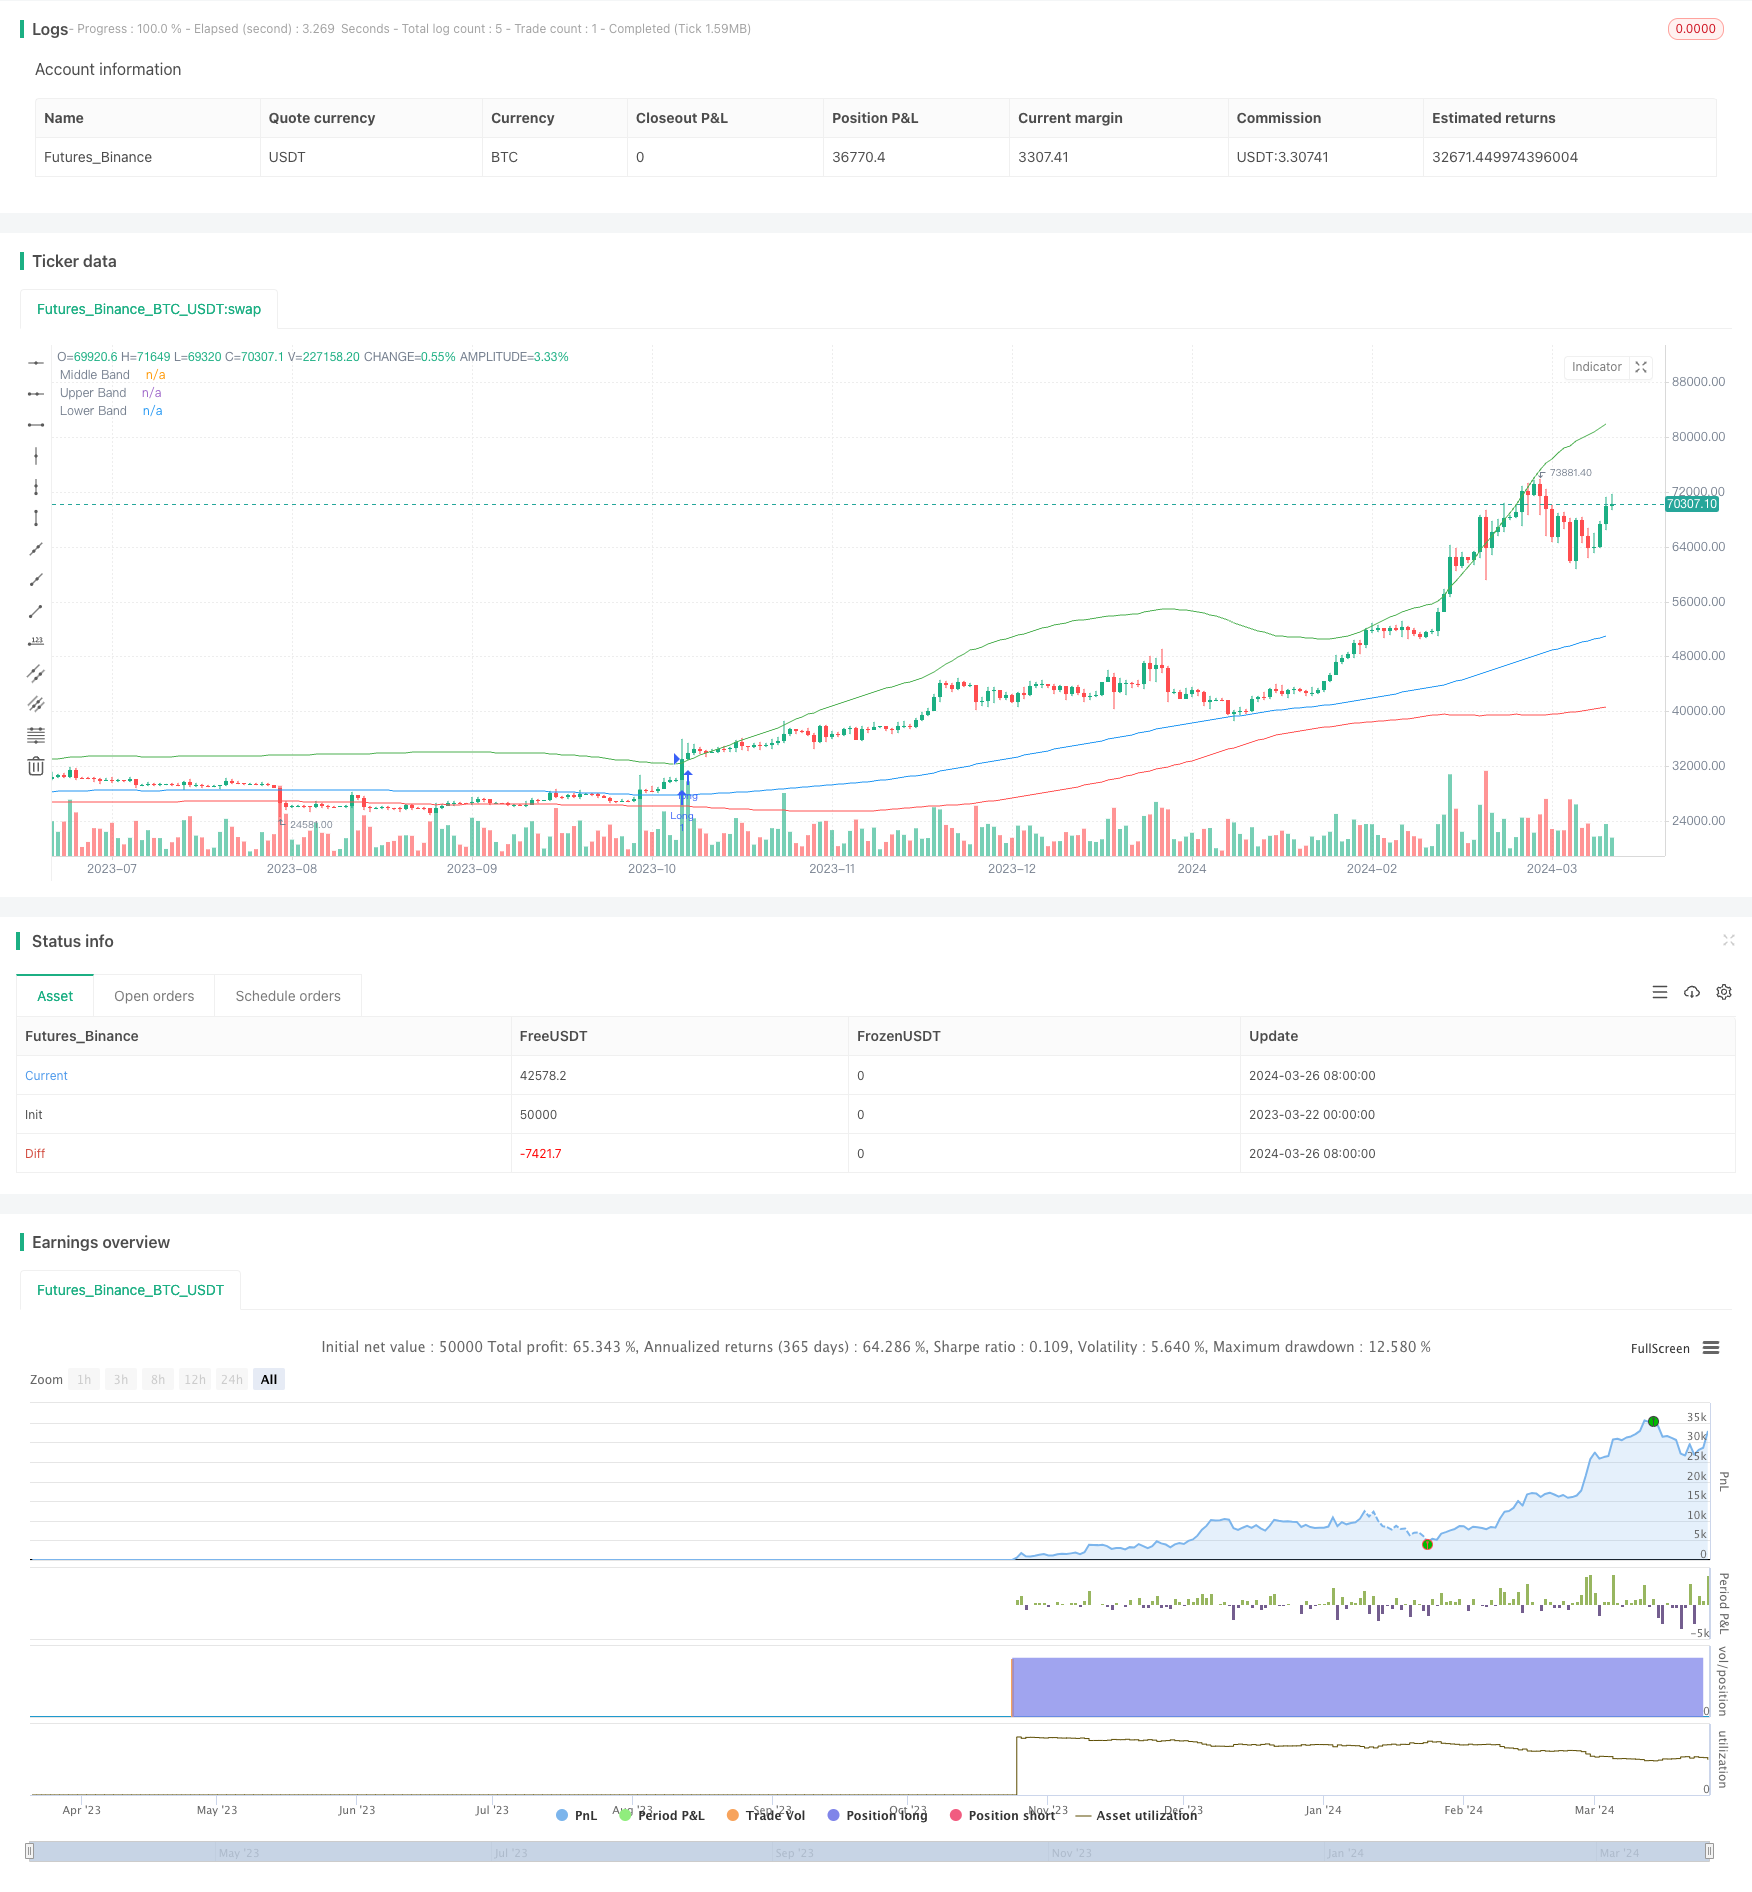
"基于布林带的多头策略"是一个强大的TradingView策略脚本,专为专注于多头头寸的交易者设计。利用著名的布林带指标,该策略旨在识别当价格收盘高于上轨时的潜在入场点,并在价格跌破下轨时发出退出信号。该策略针对5分钟图表进行了优化,非常适合专注于快速市场波动和短期波动的日内交易者,尤其是在ES和NQ市场。
|
|
|
|
策略原理:
|
|
该策略的核心是布林带指标,它由三条线组成:中轨、上轨和下轨。中轨是价格的简单移动平均线(SMA),上轨和下轨分别位于中轨的正负一定标准差处。该策略使用100期SMA作为布林带的基础,上轨和下轨的倍数分别设置为3和1个标准差,提供了一个随市场波动而动态调整的范围。
|
|
|
|
当收盘价突破上轨时,该策略会建立多头头寸,表明强劲的上升势头。当收盘价跌破下轨时,该策略会平仓头寸,表明潜在的反转或动能丧失。该策略还包括一个独特的功能,确保所有头寸在美国东部时间下午3点之前平仓,与日内交易时间表保持一致,避免了隔夜市场风险。
|
|
|
|
优势分析:
|
|
1. 该策略专为寻求利用市场上涨趋势的交易者而优化,有助于把握多头机会。
|
|
2. 布林带指标提供了一个动态调整的范围,能够适应不同的市场波动状况。
|
|
3. 该策略针对日内交易活动进行了优化,确保在美国东部时间下午3点之前平仓,降低了隔夜风险敞口。
|
|
4. 该策略在图表上直接绘制了布林带,为当前市场状况和潜在交易设置提供了清晰的视觉表现。
|
|
5. 交易者可以根据自己的交易风格或资产的波动性,调整布林带的灵敏度,实现灵活的自定义和优化。
|
|
|
|
风险分析:
|
|
1. 该策略仅考虑了多头头寸,可能错过某些潜在的空头机会。
|
|
2. 在波动较小或趋势不明朗的市场条件下,该策略可能会产生错误信号,导致亏损交易。
|
|
3. 该策略依赖于布林带指标,如果市场出现异常波动或不符合布林带的典型行为,策略的有效性可能会受到影响。
|
|
4. 该策略在5分钟图表上进行了优化,在其他时间框架或市场中应用时,可能需要进行调整和重新优化。
|
|
|
|
优化方向:
|
|
1. 考虑加入其他技术指标或市场情绪指标,以提高入场和出场信号的准确性。
|
|
2. 引入风险管理措施,如止损和移动止损,以限制潜在损失并保护利润。
|
|
3. 探索动态调整布林带参数的可能性,以适应不同的市场状况和波动水平。
|
|
4. 考虑将该策略与其他complementary strategies结合,以创建更全面和多样化的交易系统。
|
|
|
|
总结:
|
|
"基于布林带的多头策略"是一个强大而灵活的工具,可以帮助日内交易者在ES和NQ市场中把握多头机会。通过利用布林带指标的动态特性,该策略能够适应不同的市场条件,并提供清晰的入场和出场信号。虽然该策略已经针对5分钟图表进行了优化,但交易者可以根据自己的偏好和交易风格进行定制。
|
|
|
|
然而,重要的是要认识到该策略并非万无一失,在某些市场条件下可能会面临挑战。因此,在实际应用之前,全面的回测和风险评估至关重要。交易者还应该考虑将该策略纳入更广泛的交易计划中,并结合适当的风险管理措施。
|
|
|
|
通过不断优化和完善,"基于布林带的多头策略"可以成为日内交易者的宝贵工具,帮助他们驾驭动态市场,发掘有利可图的交易机会。无论你是经验丰富的交易者还是刚刚起步,该策略都提供了一个坚实的基础,可以根据你的独特需求和目标进行定制。
|
|
|
|
||
|
|
|
|
|
|
Overview:
|
|
The "Bollinger Bands Long Only Strategy" is a powerful TradingView strategy script designed for traders who specialize in long positions. Utilizing the renowned Bollinger Bands indicator, this strategy aims to identify potential entry points when the price closes above the upper Bollinger Band and signals exits when the price dips below the lower band. Tailored for the 5-minute chart, it's perfect for day traders focusing on rapid market movements and short-term volatility, especially in the ES and NQ markets.
|
|
|
|
Strategy Principle:
|
|
At the core of this strategy is the Bollinger Bands indicator, which consists of three lines: the middle band, upper band, and lower band. The middle band is a simple moving average (SMA) of the price, while the upper and lower bands are set at a certain number of standard deviations above and below the middle band, respectively. This strategy uses a 100-period SMA as the basis for the Bollinger Bands, with the upper and lower band multipliers set at 3 and 1 standard deviations, providing a dynamic range that adapts to market volatility.
|
|
|
|
When the closing price breaks above the upper band, the strategy initiates a long position, indicating strong upward momentum. When the closing price falls below the lower band, the strategy closes the position, signaling a potential reversal or loss of momentum. The strategy also includes a unique feature that ensures all positions are closed by 3 PM EST, aligning with day trading schedules and avoiding overnight market risk.
|
|
|
|
Advantages Analysis:
|
|
1. The strategy is optimized for traders seeking to capitalize on upward market trends, helping to capture long opportunities.
|
|
2. The Bollinger Bands indicator provides a dynamically adjusting range that can adapt to different market volatility conditions.
|
|
3. The strategy is optimized for day trading activities, ensuring positions are closed by 3 PM EST, reducing overnight risk exposure.
|
|
4. The strategy plots the Bollinger Bands directly on the chart, providing a clear visual representation of current market conditions and potential trade setups.
|
|
5. Traders can adjust the sensitivity of the Bollinger Bands based on their trading style or the asset's volatility, allowing for flexible customization and optimization.
|
|
|
|
Risk Analysis:
|
|
1. The strategy only considers long positions, potentially missing out on certain short opportunities.
|
|
2. In market conditions with low volatility or unclear trends, the strategy may generate false signals, leading to losing trades.
|
|
3. The strategy relies on the Bollinger Bands indicator, and its effectiveness may be impacted if the market exhibits unusual volatility or deviates from the typical behavior of Bollinger Bands.
|
|
4. The strategy is optimized for the 5-minute chart, and adjustments and re-optimization may be necessary when applied to other timeframes or markets.
|
|
|
|
Optimization Directions:
|
|
1. Consider incorporating additional technical indicators or market sentiment indicators to enhance the accuracy of entry and exit signals.
|
|
2. Introduce risk management measures, such as stop-losses and trailing stops, to limit potential losses and protect profits.
|
|
3. Explore the possibility of dynamically adjusting the Bollinger Bands parameters to adapt to different market conditions and volatility levels.
|
|
4. Consider combining the strategy with other complementary strategies to create a more comprehensive and diversified trading system.
|
|
|
|
Summary:
|
|
The "Bollinger Bands Long Only Strategy" is a powerful and versatile tool that can assist day traders in capturing long opportunities in the ES and NQ markets. By leveraging the dynamic nature of the Bollinger Bands indicator, the strategy adapts to various market conditions and provides clear entry and exit signals. While the strategy has been optimized for the 5-minute chart, traders can customize it according to their preferences and trading styles.
|
|
|
|
However, it's important to recognize that the strategy is not infallible and may face challenges under certain market conditions. Therefore, thorough backtesting and risk assessment are crucial before applying it in real-world scenarios. Traders should also consider incorporating the strategy into a broader trading plan and combine it with appropriate risk management measures.
|
|
|
|
Through continuous optimization and refinement, the "Bollinger Bands Long Only Strategy" can become a valuable asset for day traders, helping them navigate dynamic markets and uncover profitable trading opportunities. Whether you are an experienced trader or just starting out, this strategy provides a solid foundation that can be tailored to your unique needs and goals.[/trans]
|
|
|
|
|
|
|
|
> Source (PineScript)
|
|
|
|
``` pinescript
|
|
/*backtest
|
|
start: 2023-03-22 00:00:00
|
|
end: 2024-03-27 00:00:00
|
|
period: 1d
|
|
basePeriod: 1h
|
|
exchanges: [{"eid":"Futures_Binance","currency":"BTC_USDT"}]
|
|
*/
|
|
|
|
//@version=5
|
|
strategy("Bollinger Bands Long Only Strategy", overlay=true, margin_long=100, margin_short=100)
|
|
|
|
// Strategy parameters
|
|
length = 100
|
|
multUpper = 3.0
|
|
multLower = 1.0
|
|
|
|
// Calculating Bollinger Bands
|
|
basis = ta.sma(close, length)
|
|
dev = ta.stdev(close, length)
|
|
upperBand = basis + multUpper * dev
|
|
lowerBand = basis - multLower * dev
|
|
|
|
// Entry condition
|
|
longCondition = ta.crossover(close, upperBand)
|
|
|
|
// Exit condition
|
|
exitCondition = ta.crossunder(close, lowerBand)
|
|
|
|
// Plotting Bollinger Bands
|
|
plot(basis, color=color.blue, title="Middle Band")
|
|
plot(upperBand, color=color.green, title="Upper Band")
|
|
plot(lowerBand, color=color.red, title="Lower Band")
|
|
|
|
// Strategy execution
|
|
if (longCondition)
|
|
strategy.entry("Long", strategy.long)
|
|
|
|
if (exitCondition)
|
|
strategy.close("Long")
|
|
|
|
// This script should be applied to a daily chart as specified. Adjust the 'length', 'multUpper', and 'multLower' parameters based on your preferences.
|
|
|
|
```
|
|
|
|
> Detail
|
|
|
|
https://www.fmz.com/strategy/446438
|
|
|
|
> Last Modified
|
|
|
|
2024-03-28 16:36:46
|