
167 lines
9.1 KiB
Markdown
167 lines
9.1 KiB
Markdown
|
|
> Name
|
|
|
|
基于布林带和RSI的多维度动态突破交易系统-Multi-Dimensional-Dynamic-Breakout-Trading-System-Based-on-Bollinger-Bands-and-RSI
|
|
|
|
> Author
|
|
|
|
ChaoZhang
|
|
|
|
> Strategy Description
|
|
|
|
|
|
|
|
[trans]
|
|
#### 概述
|
|
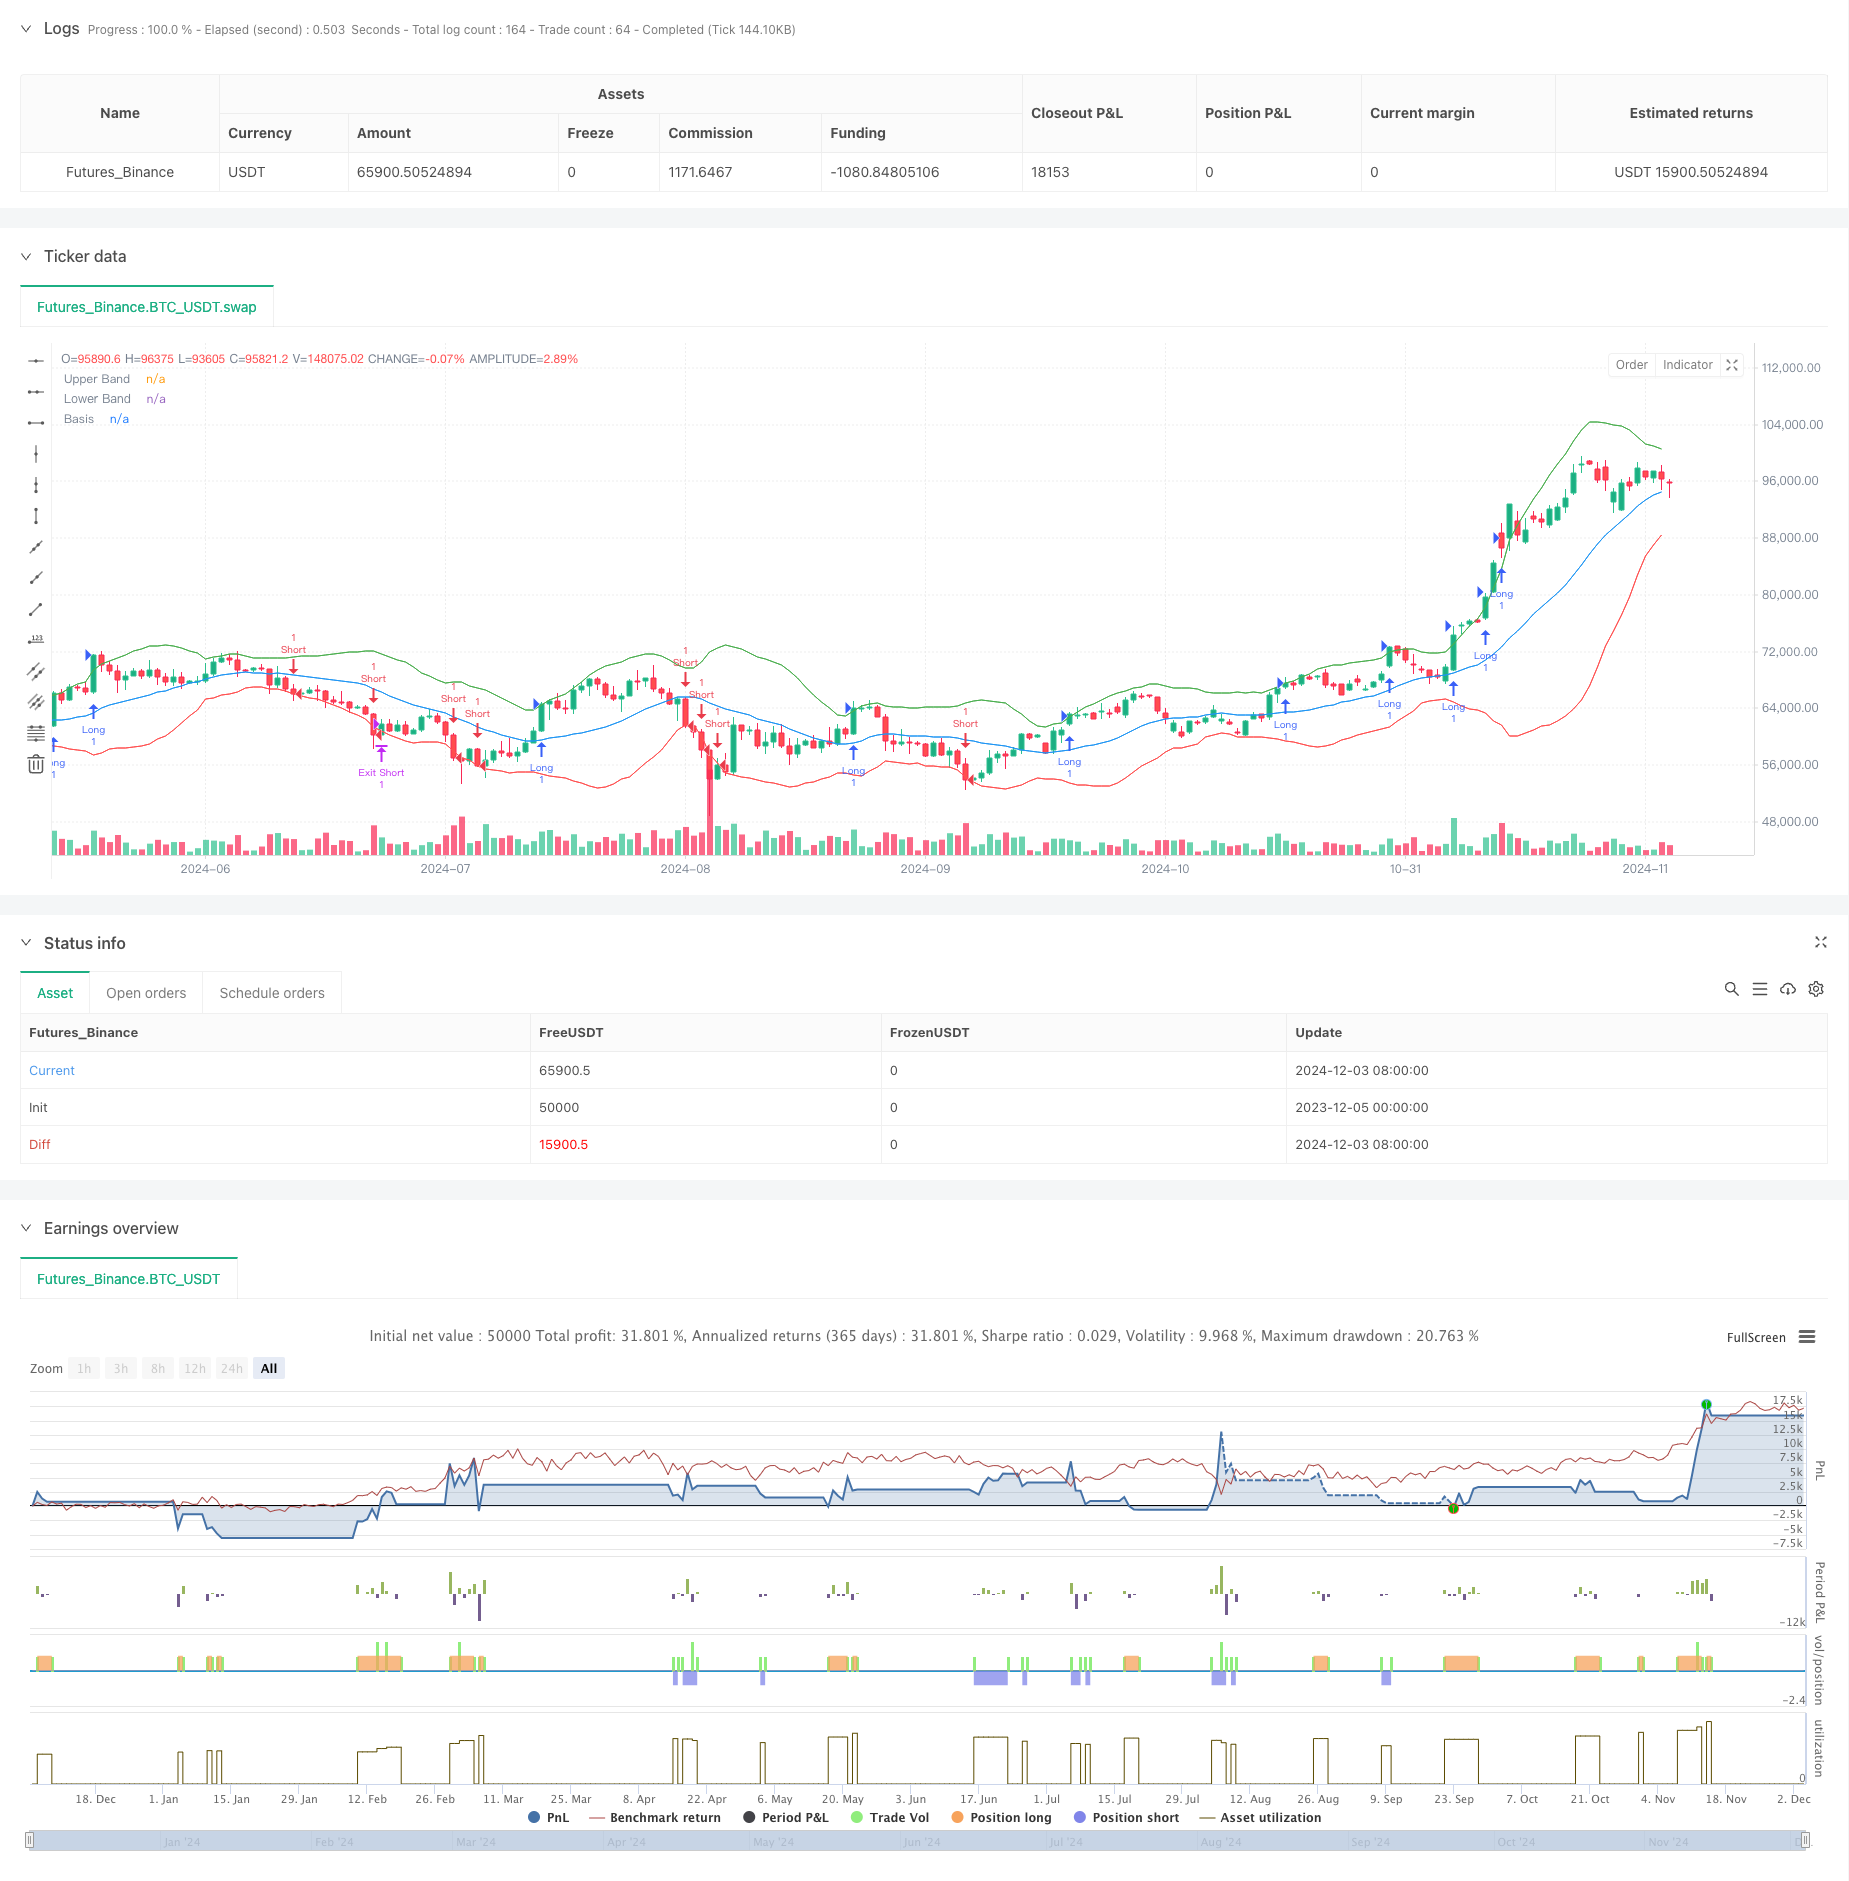
该策略是一个基于布林带和RSI指标的动态突破交易系统。它通过将布林带的波动性分析与RSI的动量确认相结合,构建了一个全面的交易决策框架。策略支持多方向交易控制,可以根据市场情况灵活选择做多、做空或双向交易。系统采用风险收益比来精确控制每笔交易的止损和获利目标,实现了交易管理的系统化。
|
|
|
|
#### 策略原理
|
|
策略的核心原理是通过多重信号确认来识别高概率的突破交易机会。具体来说:
|
|
1. 使用布林带作为主要的突破信号指示器,当价格突破上轨或下轨时触发交易信号
|
|
2. 引入RSI作为动量确认指标,要求RSI值支持突破方向(上突破时RSI>50,下突破时RSI<50)
|
|
3. 通过trade_direction参数控制交易方向,可以根据市场趋势选择单向或双向交易
|
|
4. 采用固定比例止损(2%)和动态风险收益比(默认2:1)来管理每笔交易的风险与收益
|
|
5. 设置了完整的仓位管理机制,包括入场、止损和获利了结的精确控制
|
|
|
|
#### 策略优势
|
|
1. 信号可靠性高:通过布林带和RSI的双重确认,大大提高了交易信号的可靠性
|
|
2. 方向控制灵活:可以根据市场环境自由选择交易方向,适应性强
|
|
3. 风险管理完善:采用固定止损比例和可调整的风险收益比,实现了系统化的风险控制
|
|
4. 参数可优化性:关键参数如布林带长度、乘数、RSI设置等都可以根据市场特征优化
|
|
5. 策略逻辑清晰:突破条件明确,交易规则简单直观,便于理解和执行
|
|
|
|
#### 策略风险
|
|
1. 假突破风险:在震荡市场中可能出现虚假突破信号,导致连续止损
|
|
2. 固定止损风险:2%的固定止损位可能不适合所有市场环境
|
|
3. 参数依赖性:策略效果强烈依赖于参数设置,不同市场可能需要不同参数
|
|
4. 趋势依赖:在无明显趋势的市场中,策略表现可能不佳
|
|
5. 滑点风险:在波动剧烈时,实际成交价格可能与信号价格有较大偏差
|
|
|
|
#### 策略优化方向
|
|
1. 引入成交量确认:在突破信号中加入成交量过滤器,提高信号可靠性
|
|
2. 增加趋势过滤:添加ADX等趋势指标,避免在震荡市场中频繁交易
|
|
3. 动态止损设置:根据ATR等波动指标动态调整止损距离
|
|
4. 完善出场机制:除了固定风险收益比外,可以增加移动止损等灵活出场方式
|
|
5. 市场环境分类:增加市场环境判断模块,在不同市场状态下使用不同的参数设置
|
|
|
|
#### 总结
|
|
这是一个设计合理、逻辑清晰的突破交易策略。通过多重信号确认和完善的风险管理机制,策略具有较好的实用性。同时,策略提供了丰富的优化空间,可以根据具体交易品种和市场环境进行针对性改进。建议在实盘使用前进行充分的参数优化和回测验证。 ||
|
|
|
|
#### Overview
|
|
This strategy is a dynamic breakout trading system based on Bollinger Bands and RSI indicators. It combines Bollinger Bands' volatility analysis with RSI momentum confirmation to build a comprehensive trading decision framework. The strategy supports multi-directional trade control and can flexibly choose long, short, or bi-directional trading based on market conditions. The system uses a risk-reward ratio to precisely control the stop-loss and profit targets for each trade, achieving systematic trade management.
|
|
|
|
#### Strategy Principles
|
|
The core principle of the strategy is to identify high-probability breakout trading opportunities through multiple signal confirmations. Specifically:
|
|
1. Uses Bollinger Bands as the primary breakout signal indicator, triggering trading signals when price breaks above or below the bands
|
|
2. Incorporates RSI as a momentum confirmation indicator, requiring RSI values to support the breakout direction (RSI>50 for upward breakouts, RSI<50 for downward breakouts)
|
|
3. Controls trading direction through the trade_direction parameter, allowing selection of unidirectional or bidirectional trading based on market trends
|
|
4. Adopts fixed ratio stop-loss (2%) and dynamic risk-reward ratio (default 2:1) to manage risk and reward for each trade
|
|
5. Sets up complete position management mechanism, including precise control of entry, stop-loss, and profit-taking
|
|
|
|
#### Strategy Advantages
|
|
1. High Signal Reliability: Dual confirmation through Bollinger Bands and RSI greatly improves trading signal reliability
|
|
2. Flexible Direction Control: Can freely choose trading direction based on market environment, showing strong adaptability
|
|
3. Comprehensive Risk Management: Uses fixed stop-loss ratio and adjustable risk-reward ratio, achieving systematic risk control
|
|
4. Parameter Optimization Potential: Key parameters such as Bollinger Band length, multiplier, RSI settings can be optimized based on market characteristics
|
|
5. Clear Strategy Logic: Clear breakout conditions, simple and intuitive trading rules, easy to understand and execute
|
|
|
|
#### Strategy Risks
|
|
1. False Breakout Risk: May generate false breakout signals in ranging markets, leading to consecutive losses
|
|
2. Fixed Stop-Loss Risk: 2% fixed stop-loss may not suit all market environments
|
|
3. Parameter Dependency: Strategy effectiveness heavily depends on parameter settings, different markets may need different parameters
|
|
4. Trend Dependency: Strategy may underperform in markets without clear trends
|
|
5. Slippage Risk: Actual execution prices may significantly deviate from signal prices during high volatility
|
|
|
|
#### Strategy Optimization Directions
|
|
1. Incorporate Volume Confirmation: Add volume filters to breakout signals to improve signal reliability
|
|
2. Add Trend Filters: Include trend indicators like ADX to avoid frequent trading in ranging markets
|
|
3. Dynamic Stop-Loss Setting: Adjust stop-loss distances dynamically based on volatility indicators like ATR
|
|
4. Improve Exit Mechanism: Add flexible exit methods like trailing stops in addition to fixed risk-reward ratio
|
|
5. Market Environment Classification: Add market state assessment module to use different parameters in different market conditions
|
|
|
|
#### Conclusion
|
|
This is a well-designed breakout trading strategy with clear logic. Through multiple signal confirmations and comprehensive risk management mechanisms, the strategy shows good practicality. Meanwhile, the strategy provides rich optimization potential and can be specifically improved based on trading instruments and market environments. It's recommended to conduct thorough parameter optimization and backtesting before live trading.[/trans]
|
|
|
|
|
|
|
|
> Source (PineScript)
|
|
|
|
``` pinescript
|
|
/*backtest
|
|
start: 2023-12-05 00:00:00
|
|
end: 2024-12-04 00:00:00
|
|
period: 1d
|
|
basePeriod: 1d
|
|
exchanges: [{"eid":"Futures_Binance","currency":"BTC_USDT"}]
|
|
*/
|
|
|
|
//@version=5
|
|
strategy("Bollinger Breakout Strategy with Direction Control", overlay=true)
|
|
|
|
// === Input Parameters ===
|
|
length = input(20, title="Bollinger Bands Length")
|
|
src = close
|
|
mult = input(2.0, title="Bollinger Bands Multiplier")
|
|
rsi_length = input(14, title="RSI Length")
|
|
rsi_midline = input(50, title="RSI Midline")
|
|
risk_reward_ratio = input(2.0, title="Risk/Reward Ratio")
|
|
|
|
// === Trade Direction Option ===
|
|
trade_direction = input.string("Both", title="Trade Direction", options=["Long", "Short", "Both"])
|
|
|
|
// === Bollinger Bands Calculation ===
|
|
basis = ta.sma(src, length)
|
|
dev = mult * ta.stdev(src, length)
|
|
upper_band = basis + dev
|
|
lower_band = basis - dev
|
|
|
|
// === RSI Calculation ===
|
|
rsi_val = ta.rsi(src, rsi_length)
|
|
|
|
// === Breakout Conditions ===
|
|
// Long: Prijs sluit boven de bovenste Bollinger Band en RSI > RSI Midline
|
|
long_condition = close > upper_band and rsi_val > rsi_midline and (trade_direction == "Long" or trade_direction == "Both")
|
|
|
|
// Short: Prijs sluit onder de onderste Bollinger Band en RSI < RSI Midline
|
|
short_condition = close < lower_band and rsi_val < rsi_midline and (trade_direction == "Short" or trade_direction == "Both")
|
|
|
|
// === Entry Prices ===
|
|
var float entry_price_long = na
|
|
var float entry_price_short = na
|
|
|
|
if (long_condition)
|
|
entry_price_long := close
|
|
strategy.entry("Long", strategy.long, when=long_condition)
|
|
|
|
if (short_condition)
|
|
entry_price_short := close
|
|
strategy.entry("Short", strategy.short, when=short_condition)
|
|
|
|
// === Stop-Loss and Take-Profit ===
|
|
long_stop_loss = entry_price_long * 0.98 // 2% onder instapprijs
|
|
long_take_profit = entry_price_long * (1 + (0.02 * risk_reward_ratio))
|
|
|
|
short_stop_loss = entry_price_short * 1.02 // 2% boven instapprijs
|
|
short_take_profit = entry_price_short * (1 - (0.02 * risk_reward_ratio))
|
|
|
|
if (strategy.position_size > 0) // Long Positie
|
|
strategy.exit("Exit Long", "Long", stop=long_stop_loss, limit=long_take_profit)
|
|
|
|
if (strategy.position_size < 0) // Short Positie
|
|
strategy.exit("Exit Short", "Short", stop=short_stop_loss, limit=short_take_profit)
|
|
|
|
// === Plotting ===
|
|
plot(upper_band, color=color.green, title="Upper Band")
|
|
plot(lower_band, color=color.red, title="Lower Band")
|
|
plot(basis, color=color.blue, title="Basis")
|
|
|
|
```
|
|
|
|
> Detail
|
|
|
|
https://www.fmz.com/strategy/474075
|
|
|
|
> Last Modified
|
|
|
|
2024-12-05 17:32:23
|