
9.6 KiB
Name
基于多重级别EMA与RSI动态势能强度的比特币跨周期趋势交易策略-Multi-Timeframe-Bitcoin-Trading-Strategy-Based-on-EMA-and-RSI-Dynamic-Momentum-Strength
Author
ianzeng123
Strategy Description
[trans]
概述
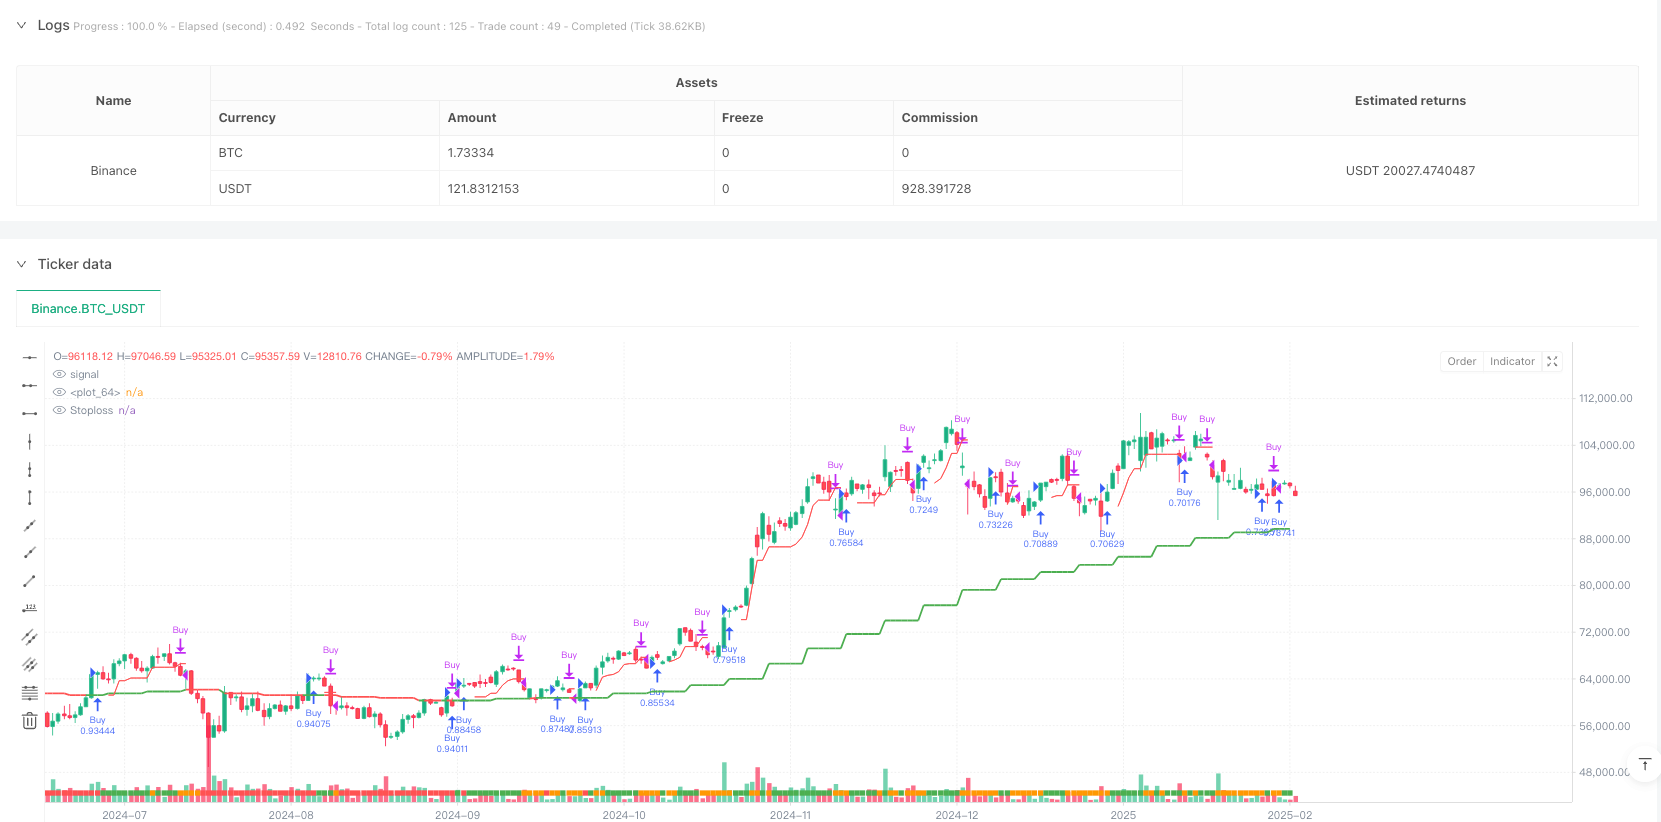
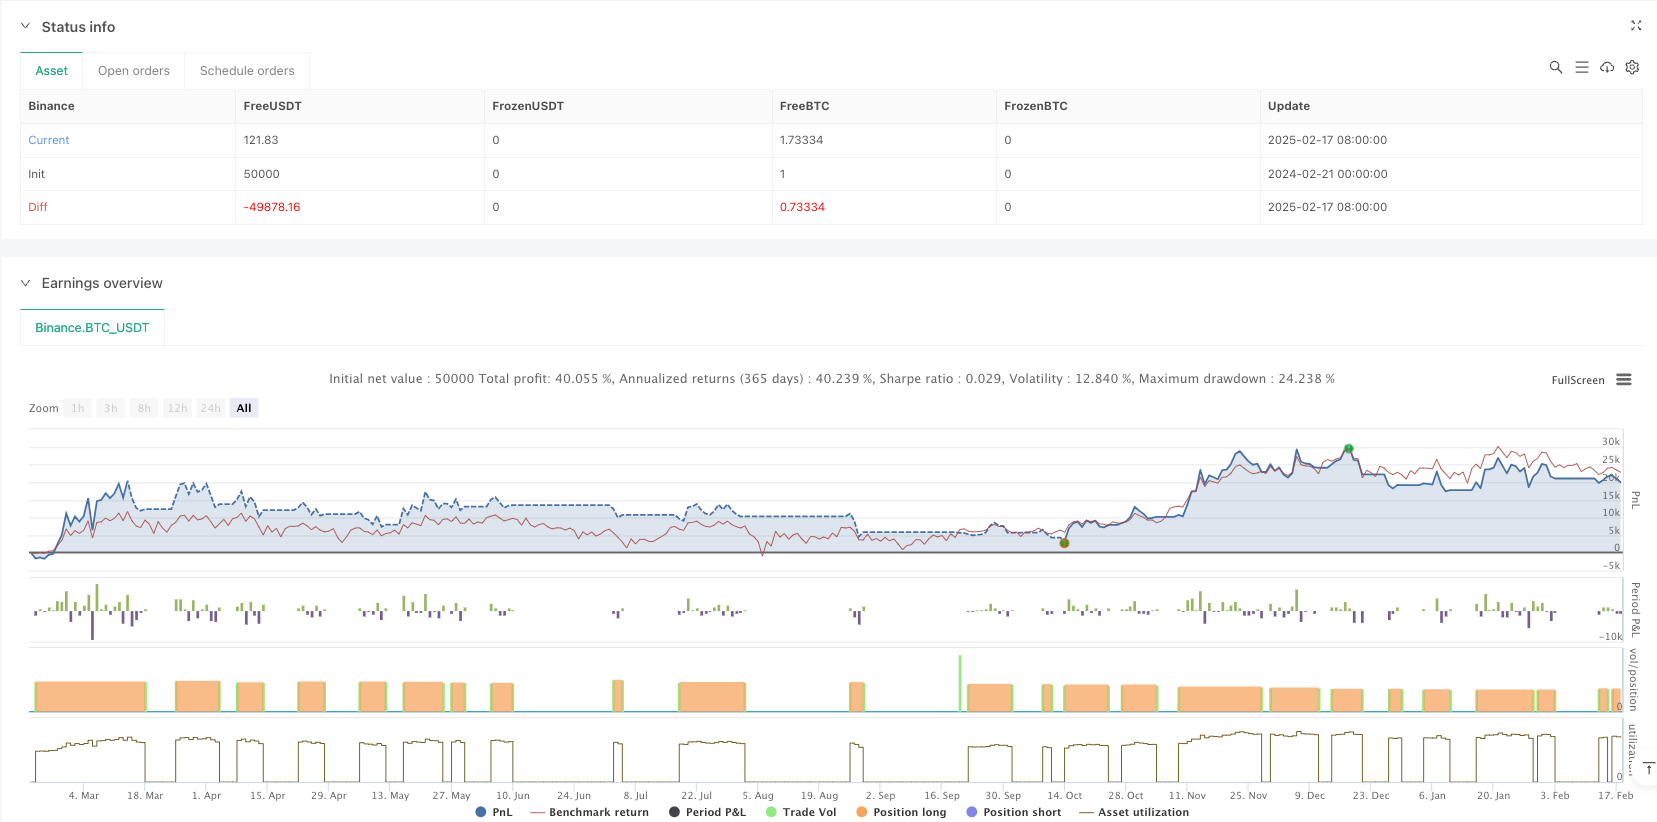
该策略是一个基于跨周期分析的趋势跟踪交易系统,结合了周线和日线级别的EMA均线以及RSI指标来识别市场趋势和动量。策略通过多重时间框架的趋势一致性来确定交易机会,并使用基于ATR的动态止损来管理风险。系统采用资金管理模式,每次交易使用账户100%的资金,并考虑了0.1%的交易手续费。
策略原理
策略的核心逻辑基于以下几个关键要素:
- 使用周线级别的EMA作为主要趋势过滤器,结合日线收盘价与周线EMA的关系来确定市场状态
- 通过ATR指标动态调整趋势判定的阈值,增加策略的适应性
- 整合RSI动量指标作为额外的交易过滤条件
- 使用基于7天最低价和ATR的追踪止损系统
- 当出现过度上涨的警告信号时,策略会暂停开仓以规避风险
策略优势
- 多重时间框架分析提供了更全面的市场视角,能够有效过滤假突破
- 动态止损机制根据市场波动性自适应调整,提供了灵活的风险控制
- RSI动量过滤器帮助确认趋势强度,提高入场质量
- 系统包含过度上涨的预警机制,有助于规避回撤风险
- 策略的参数可调整性强,便于根据不同市场环境进行优化
策略风险
- 在横盘市场中可能频繁进出导致交易成本增加
- 使用100%资金进行交易存在较大的回撤风险
- 依赖技术指标可能在市场突发事件时反应不及时
- 多重时间框架分析可能在不同级别出现矛盾信号
- 追踪止损可能在剧烈波动时被过早触发
策略优化方向
- 引入波动率过滤器,在低波动期间减少交易频率
- 添加仓位管理系统,根据市场状态动态调整持仓比例
- 整合基本面指标,提供额外的市场环境判断
- 优化追踪止损参数,使其更好地适应不同的市场阶段
- 加入交易量分析,提高趋势判断的准确性
总结
这是一个结构完整、逻辑清晰的趋势跟踪策略。通过多重时间框架分析和动态指标过滤,策略能够较好地捕捉主要趋势。虽然存在一些固有风险,但通过参数优化和添加补充指标,策略仍有较大的改进空间。建议在实盘交易前进行充分的回测,并根据具体的市场环境调整参数设置。
||
Overview
This strategy is a trend-following trading system based on cross-timeframe analysis, combining weekly and daily EMA levels with RSI indicators to identify market trends and momentum. The strategy determines trading opportunities through trend confluence across multiple timeframes and uses ATR-based dynamic stop-loss for risk management. The system employs a capital management approach, using 100% of account funds per trade, with a 0.1% trading commission consideration.
Strategy Principles
The core logic of the strategy is based on the following key elements:
- Uses weekly EMA as the primary trend filter, combined with the relationship between daily closing price and weekly EMA to determine market conditions
- Dynamically adjusts trend determination thresholds through ATR indicator, increasing strategy adaptability
- Integrates RSI momentum indicator as additional trading filter
- Employs a trailing stop-loss system based on 7-day low and ATR
- Strategy pauses new positions when excessive uptrend warning signals appear to avoid risks
Strategy Advantages
- Multi-timeframe analysis provides a more comprehensive market perspective, effectively filtering false breakouts
- Dynamic stop-loss mechanism adapts to market volatility, providing flexible risk control
- RSI momentum filter helps confirm trend strength, improving entry quality
- System includes excessive uptrend warning mechanism, helping avoid drawdown risks
- Strategy parameters are highly adjustable, facilitating optimization for different market environments
Strategy Risks
- May result in frequent entries and exits in ranging markets, increasing trading costs
- Using 100% funds per trade carries significant drawdown risk
- Reliance on technical indicators may lead to delayed responses to market events
- Multi-timeframe analysis may produce conflicting signals at different levels
- Trailing stop-loss may be triggered prematurely during severe volatility
Strategy Optimization Directions
- Introduce volatility filter to reduce trading frequency during low volatility periods
- Add position management system to dynamically adjust holding ratios based on market conditions
- Integrate fundamental indicators for additional market environment assessment
- Optimize trailing stop-loss parameters for better adaptation to different market phases
- Include volume analysis to improve trend determination accuracy
Summary
This is a well-structured trend-following strategy with clear logic. Through multi-timeframe analysis and dynamic indicator filtering, the strategy can effectively capture major trends. While inherent risks exist, there is significant room for improvement through parameter optimization and supplementary indicators. It is recommended to conduct thorough backtesting before live trading and adjust parameters according to specific market conditions.[/trans]
Source (PineScript)
/*backtest
start: 2024-02-21 00:00:00
end: 2025-02-18 08:00:00
period: 1d
basePeriod: 1d
exchanges: [{"eid":"Binance","currency":"BTC_USDT"}]
*/

// @version=6
strategy("Bitcoin Regime Filter Strategy",         // Strategy name
     overlay=true,                                 // The strategy will be drawn directly on the price chart
     initial_capital=10000,                        // Initial capital of 10000 USD
     currency=currency.USDT,                       // Defines the currency used, USDT
     default_qty_type=strategy.percent_of_equity,  // Position size will be calculated as a percentage of equity
     default_qty_value=100,                        // The strategy uses 100% of available capital for each trade
     commission_type=strategy.commission.percent,  // The strategy uses commission as a percentage
     commission_value=0.1)                         // Transaction fee is 0.1%

// User input
res = input.timeframe(title = "Timeframe", defval = "W")                     // Higher timeframe for reference
len = input.int(title = "EMA Length", defval = 20)                           // EMA length input
marketTF = input.timeframe(title = "Market Timeframe", defval = "D")         // Current analysis timeframe (D)
useRSI = input.bool(title = "Use RSI Momentum Filter", defval = false)       // Option to use RSI filter
rsiMom = input.int(title = "RSI Momentum Threshold", defval = 70)            // RSI momentum threshold (default 70)

// Custom function to output data
f_sec(_market, _res, _exp) => request.security(_market, _res, _exp[barstate.isrealtime ? 1 : 0])[barstate.isrealtime ? 0: 1]

// The f_sec function has three input parameters: _market, _res, _exp
// request.security = a Pine Script function to fetch market data, accessing OHLC data
// _exp[barstate.isrealtime ? 1 : 0] checks if the current bar is real-time, and retrieves the previous bar (1) or the current bar (0)
// [barstate.isrealtime ? 0 : 1] returns the value of request.security, with a real-time check on the bar

// Define time filter
dateFilter(int st, int et) => time >= st and time <= et
// The dateFilter function has two input parameters: st (start time) and et (end time)
// It checks if the current bar's time is between st and et

// Fetch EMA value
ema = ta.ema(close, len)                                   // Calculate EMA with close prices and input length
htfEmaValue = f_sec(syminfo.tickerid, res, ema)            // EMA value for high time frame, using f_sec function

// Fetch ATR value
atrValue = ta.atr(5)

// Check if price is above or below EMA
marketPrice = f_sec(syminfo.tickerid, marketTF, close)
regimeFilter = marketPrice > (htfEmaValue + (atrValue * 0.25))       // Compare current price with EMA in higher timeframe (with ATR dependency)

// Calculate RSI value
rsiValue = ta.rsi(close, 7)

// Bullish momentum filter
bullish = regimeFilter and (rsiValue > rsiMom or not useRSI)

// Set caution alert
caution = bullish and (ta.highest(high, 7) - low) > (atrValue * 1.5)

// Set momentum background color
bgCol = color.red
if bullish[1]
    bgCol := color.green
if caution[1]
    bgCol := color.orange

// Plot background color
plotshape(1, color = bgCol, style = shape.square, location = location.bottom, size = size.auto, title = "Momentum Strength")
plot(htfEmaValue, color = close > htfEmaValue ? color.green : color.red, linewidth = 2)

// Initialize trailing stop variable
var float trailStop = na

// Entry logic
if bullish and strategy.position_size == 0 and not caution
    strategy.entry(id = "Buy", direction = strategy.long)
    trailStop := na

// Trailing stop logic
temp_trailStop = ta.highest(low, 7) - (caution[1] ? atrValue * 0.2 : atrValue)
if strategy.position_size > 0
    if temp_trailStop > trailStop or na(trailStop)
        trailStop := temp_trailStop

// Exit logic
if (close < trailStop or close < htfEmaValue)
    strategy.close("Buy", comment = "Sell")

// Plot stop loss line
plot(strategy.position_size[1] > 0 ? trailStop : na, style = plot.style_linebr, color = color.red, title = "Stoploss")
Detail
https://www.fmz.com/strategy/482904
Last Modified
2025-02-27 17:24:26