
7.9 KiB
Name
基于多重均线动量的交易策略结合成交量加权均价和相对强弱指标确认系统-Multi-Timeframe-Exponential-Moving-Average-Momentum-Trading-Strategy-with-Volume-Weighted-Average-Price-and-RSI-Confirmation
Author
ianzeng123
Strategy Description
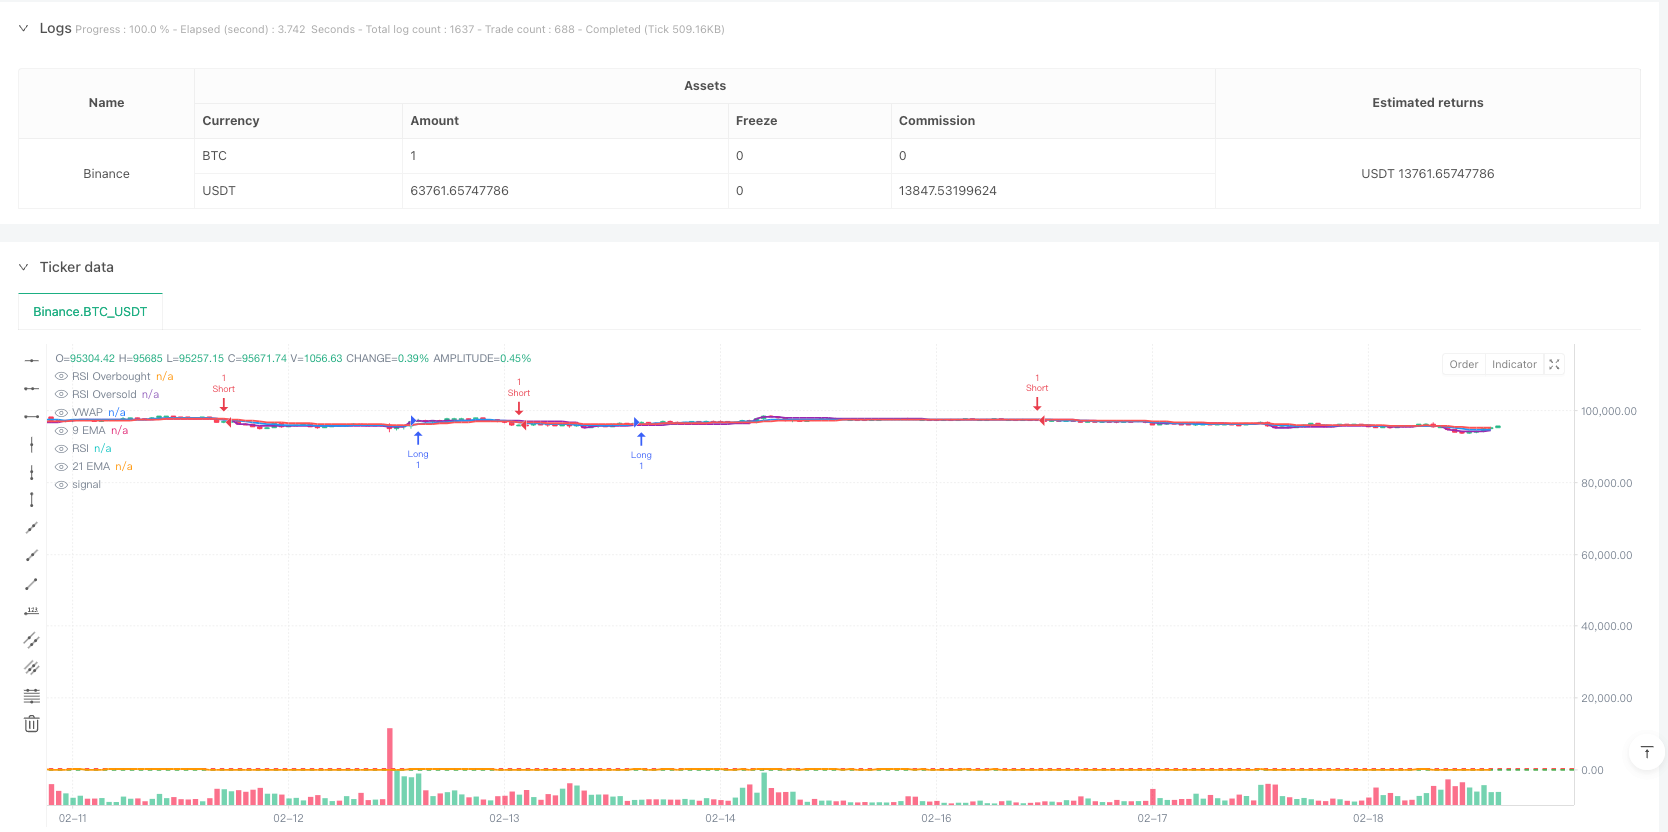
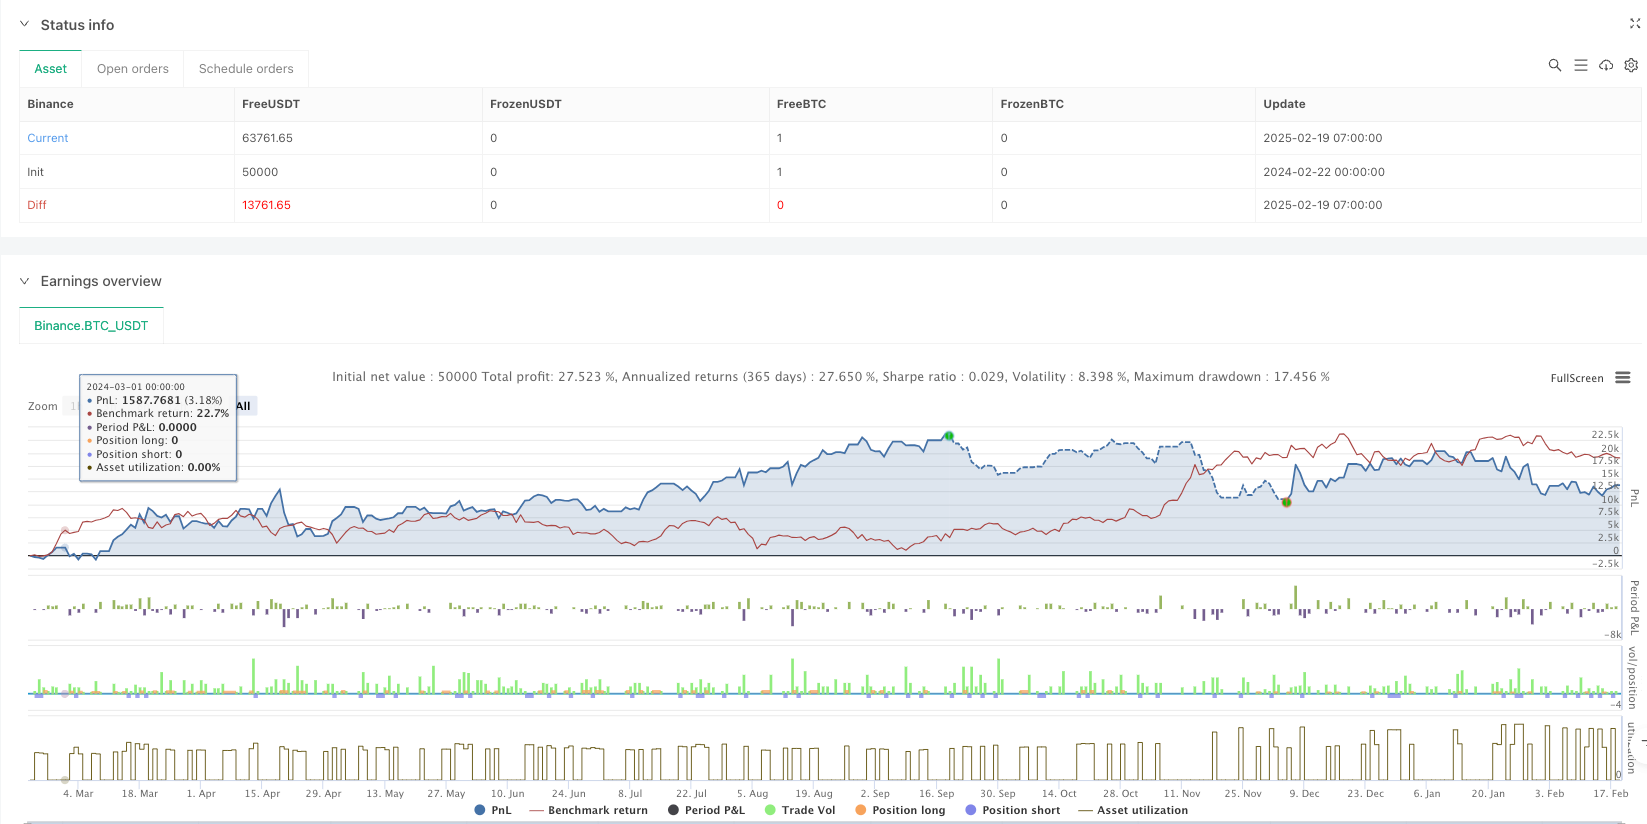
[trans]
概述
该策略是一个综合性的交易系统,结合了多个技术指标来确认交易信号。核心逻辑基于快速和慢速指数移动平均线(EMA)的交叉,并通过成交量加权平均价格(VWAP)和相对强弱指标(RSI)进行信号确认。同时,系统采用基于真实波幅(ATR)的动态止损方案,确保风险管理的科学性和灵活性。
策略原理
策略的核心原理是通过多重技术指标的协同配合来确认交易方向。具体包括:
- 使用9周期和21周期EMA的交叉来捕捉价格动量的变化
- 通过VWAP判断当前价格相对于当日平均成交价的位置,确认市场偏好
- 利用RSI判断市场超买超卖状态,并作为趋势确认的辅助指标
- 基于ATR设置动态止损位置,采用1.5倍ATR作为止损距离
- 使用2:1的风险收益比设置止盈位置
策略优势
- 指标体系完备,通过多重确认降低假信号
- 动态止损方案适应市场波动,避免被正常波动震出局
- 固定的风险收益比有利于长期稳定交易
- 结合机构交易者常用的VWAP指标,能更好地把握大资金行为
- 系统自动化程度高,减少人为情绪干扰
策略风险
- 在横盘震荡市场可能产生频繁假信号
- 多重指标确认可能导致错过部分交易机会
- 固定的风险收益比在某些市场环境下可能不够灵活
- 依赖技术指标可能在重大消息面前失效
- 需要考虑交易成本对策略收益的影响
策略优化方向
- 引入市场波动率指标,在不同波动环境下调整参数
- 加入交易量分析,提高信号的可靠性
- 开发自适应的风险收益比系统
- 引入市场结构分析,优化交易时机选择
- 考虑加入基本面过滤器,提高抗风险能力
总结
该策略通过多重技术指标的有机结合,构建了一个相对完整的交易系统。它不仅注重信号的准确性,也强调风险管理的重要性。虽然存在一定的局限性,但通过持续优化和改进,该策略有望在多种市场环境下保持稳定的表现。关键是要根据实际交易情况不断调整参数,并结合市场环境的变化进行灵活应用。
||
Overview
This strategy is a comprehensive trading system that combines multiple technical indicators to confirm trading signals. The core logic is based on the crossover of fast and slow Exponential Moving Averages (EMA), with signal confirmation through Volume-Weighted Average Price (VWAP) and Relative Strength Index (RSI). The system employs a dynamic stop-loss approach based on Average True Range (ATR) to ensure scientific and flexible risk management.
Strategy Principles
The core principles of the strategy involve the coordination of multiple technical indicators to confirm trading direction. Specifically:
- Using 9-period and 21-period EMA crossovers to capture price momentum changes
- Utilizing VWAP to determine price position relative to daily average transaction price
- Employing RSI to judge market overbought/oversold conditions
- Setting dynamic stop-loss positions based on ATR, using 1.5x ATR as the stop-loss distance
- Implementing a 2:1 risk-reward ratio for take-profit positions
Strategy Advantages
- Comprehensive indicator system reduces false signals through multiple confirmations
- Dynamic stop-loss approach adapts to market volatility
- Fixed risk-reward ratio promotes long-term stable trading
- Integration with institutional traders' VWAP indicator better captures large capital movements
- High level of system automation reduces emotional interference
Strategy Risks
- May generate frequent false signals in ranging markets
- Multiple indicator confirmation might miss some trading opportunities
- Fixed risk-reward ratio may lack flexibility in certain market conditions
- Technical indicators may fail during significant news events
- Trading costs need to be considered for strategy profitability
Strategy Optimization Directions
- Introduce volatility indicators to adjust parameters in different market conditions
- Add volume analysis to improve signal reliability
- Develop adaptive risk-reward ratio system
- Incorporate market structure analysis to optimize trade timing
- Consider adding fundamental filters to enhance risk resistance
Summary
This strategy constructs a relatively complete trading system through the organic combination of multiple technical indicators. It emphasizes both signal accuracy and risk management importance. While certain limitations exist, through continuous optimization and improvement, the strategy shows promise for maintaining stable performance across various market conditions. The key is to continuously adjust parameters based on actual trading results and flexibly apply the strategy according to changing market environments.[/trans]
Source (PineScript)
/*backtest
start: 2024-02-22 00:00:00
end: 2025-02-19 08:00:00
period: 1h
basePeriod: 1h
exchanges: [{"eid":"Binance","currency":"BTC_USDT"}]
*/

//@version=5
strategy("BTC Day Trading Strategy with Alerts", overlay=true)

// Input parameters
emaShortLength = input(9, title="Short EMA Length")
emaLongLength  = input(21, title="Long EMA Length")
rsiLength      = input(14, title="RSI Length")
rsiOverbought  = input(70, title="RSI Overbought Level")
rsiOversold    = input(30, title="RSI Oversold Level")
atrMultiplier  = input(1.5, title="ATR Multiplier for SL")
riskRewardRatio = input(2, title="Risk-Reward Ratio") // Defines TP as 2x SL

// Calculate indicators
emaShort = ta.ema(close, emaShortLength)
emaLong  = ta.ema(close, emaLongLength)
rsi      = ta.rsi(close, rsiLength)
vwap     = ta.vwap(close)  // Fixed: Added "close" as the source
atr      = ta.atr(14)

// Define conditions for entry
longCondition  = ta.crossover(emaShort, emaLong) and close > vwap and rsi > 50
shortCondition = ta.crossunder(emaShort, emaLong) and close < vwap and rsi < 50

// ATR-based Stop Loss & Take Profit
longSL  = close - (atr * atrMultiplier)
longTP  = close + ((close - longSL) * riskRewardRatio)

shortSL = close + (atr * atrMultiplier)
shortTP = close - ((shortSL - close) * riskRewardRatio)

// Execute trades
if (longCondition)
    strategy.entry("Long", strategy.long)
    strategy.exit("Long Exit", from_entry="Long", stop=longSL, limit=longTP)

if (shortCondition)
    strategy.entry("Short", strategy.short)
    strategy.exit("Short Exit", from_entry="Short", stop=shortSL, limit=shortTP)

// ? Add Alert Conditions for TradingView Alerts
alertcondition(longCondition, title="BTC Buy Signal", message="? Buy Signal: 9 EMA crossed above 21 EMA, Price above VWAP, RSI > 50")
alertcondition(shortCondition, title="BTC Sell Signal", message="? Sell Signal: 9 EMA crossed below 21 EMA, Price below VWAP, RSI < 50")

// Plot indicators
plot(emaShort, color=color.blue, title="9 EMA", linewidth=2)  // Thicker line for better visibility
plot(emaLong, color=color.red, title="21 EMA", linewidth=2)    // Thicker line for better visibility
hline(rsiOverbought, "RSI Overbought", color=color.red, linewidth=2)  // Thicker line for RSI Overbought
hline(rsiOversold, "RSI Oversold", color=color.green, linewidth=2)    // Thicker line for RSI Oversold
plot(vwap, color=color.purple, title="VWAP", linewidth=2)            // VWAP line on price chart

// Create a separate panel for RSI for better scaling
plot(rsi, color=color.orange, title="RSI", linewidth=2, style=plot.style_line)  // Plot RSI on a separate panel
Detail
https://www.fmz.com/strategy/483078
Last Modified
2025-02-21 11:50:06