
281 lines
14 KiB
Markdown
281 lines
14 KiB
Markdown
|
|
> Name
|
|
|
|
基于多维度动态云图的Ichimoku高级多周期交易策略-Advanced-Multi-Timeframe-Ichimoku-Cloud-Trading-Strategy-with-Dynamic-Multidimensional-Analysis
|
|
|
|
> Author
|
|
|
|
ChaoZhang
|
|
|
|
> Strategy Description
|
|
|
|
|
|
|
|
[trans]
|
|
#### 概述
|
|
|
|
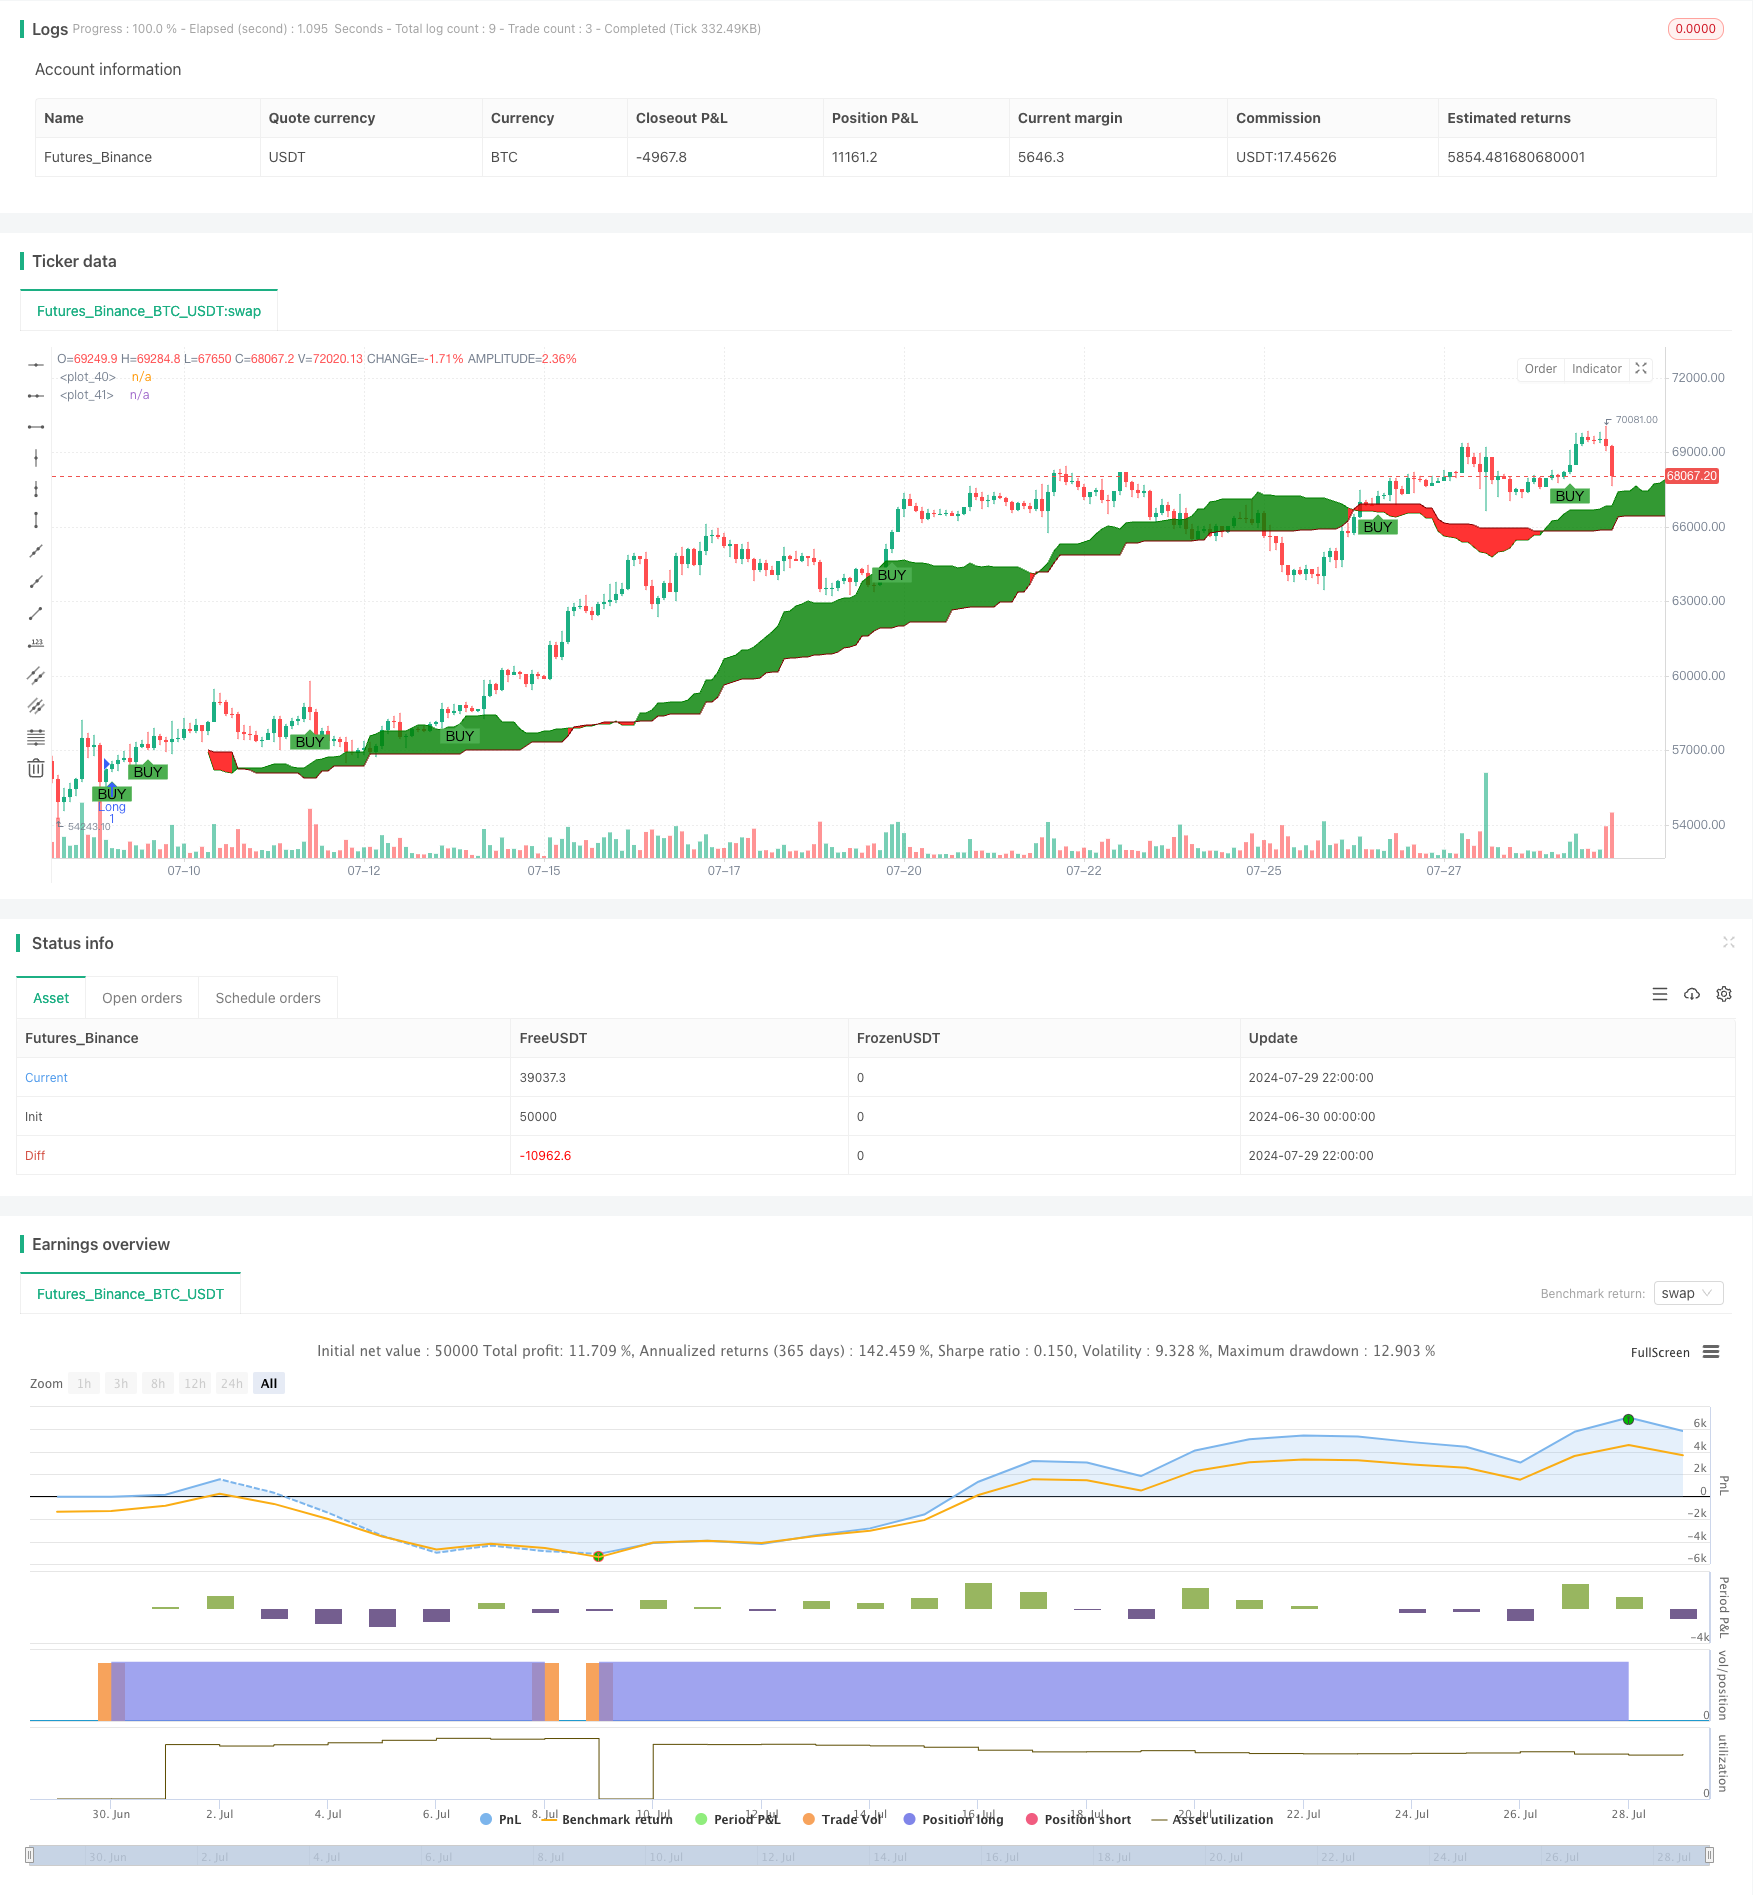
基于多维度动态云图的Ichimoku高级多周期交易策略是一个复杂而全面的技术分析工具,旨在捕捉市场中的长期趋势和重要转折点。该策略基于传统的一目均衡表(Ichimoku Kinko Hyo)指标,通过动态调整关键参数和引入风险管理机制,实现了对不同市场周期的适应性分析。策略核心在于利用Tenkan-sen(转换线)、Kijun-sen(基准线)、Senkou Span A和B(先行带A和B)以及Chikou Span(滞后线)等多个指标线的交叉和相对位置关系,结合价格与云图(Kumo)的位置,生成买入和卖出信号。
|
|
|
|
#### 策略原理
|
|
|
|
1. 信号生成机制:
|
|
- 买入信号: 当Tenkan-sen向上穿越Kijun-sen,且价格位于云图之上时触发。
|
|
- 卖出信号: 当Tenkan-sen向下穿越Kijun-sen,且价格位于云图之下时触发。
|
|
|
|
2. 参数动态调整:
|
|
- Tenkan-sen周期: 9个周期
|
|
- Kijun-sen周期: 26个周期
|
|
- Senkou Span B周期: 52个周期
|
|
- 位移(Displacement): 26个周期
|
|
|
|
3. 风险管理:
|
|
- 引入可调节的止损百分比(默认5%)和获利百分比(默认10%)
|
|
- 适用于长期交易,特别适合周线或月线图表
|
|
|
|
4. 视觉化:
|
|
- 使用自定义颜色方案增强云图和各指标线的可视化效果
|
|
- 通过调整云图透明度(90%)提高可读性
|
|
|
|
5. 多维度分析:
|
|
- 结合价格、多条均线和云图位置进行多角度市场分析
|
|
- 通过Chikou Span反映价格的历史表现,增加决策参考
|
|
|
|
#### 策略优势
|
|
|
|
1. 全面性: 整合了多个技术指标,提供了对市场趋势、动量和潜在支撑/阻力位的全面分析。
|
|
|
|
2. 适应性: 通过可调节的参数,策略可以适应不同的市场环境和交易周期。
|
|
|
|
3. 风险管理: 内置的止损和获利机制有助于控制风险,保护利润。
|
|
|
|
4. 视觉直观: 自定义的颜色方案和透明度设置使得市场状态一目了然。
|
|
|
|
5. 长期稳定性: 特别适合长期交易者,有助于捕捉大趋势并减少噪音干扰。
|
|
|
|
6. 多维度分析: 通过综合考虑多个指标,降低了假信号的风险。
|
|
|
|
7. 自动化: 策略可以轻松集成到自动交易系统中,减少人为干预。
|
|
|
|
#### 策略风险
|
|
|
|
1. 滞后性: Ichimoku指标本质上是滞后指标,在快速变化的市场中可能反应不及时。
|
|
|
|
2. 过度依赖: 过分依赖单一策略可能忽视其他重要的市场因素。
|
|
|
|
3. 参数敏感性: 不同市场环境可能需要不同的参数设置,需要定期优化。
|
|
|
|
4. 假突破: 在震荡市场中可能产生较多假信号,增加交易成本。
|
|
|
|
5. 复杂性: 多个指标的综合分析可能导致决策过程复杂化,特别是对新手交易者。
|
|
|
|
6. 回测偏差: 历史数据回测效果良好不代表未来表现,需要警惕过度拟合。
|
|
|
|
7. 市场适应性: 策略在趋势明显的市场中表现较好,但在横盘或剧烈波动市场中效果可能不佳。
|
|
|
|
#### 策略优化方向
|
|
|
|
1. 动态参数调整: 引入自适应机制,根据市场波动性自动调整各项参数。
|
|
|
|
2. 多时间框架分析: 整合不同时间周期的信号,提高决策的可靠性。
|
|
|
|
3. 量化指标融合: 结合成交量、波动率等其他技术指标,增强信号的可信度。
|
|
|
|
4. 机器学习优化: 利用机器学习算法优化参数选择和信号生成过程。
|
|
|
|
5. 情绪分析整合: 引入市场情绪指标,如VIX或社交媒体情绪分析,丰富决策依据。
|
|
|
|
6. 风险管理高级化: 实现动态止损和获利目标,根据市场状况自动调整。
|
|
|
|
7. 回测框架增强: 开发更全面的回测系统,包括滑点、交易成本等实际因素。
|
|
|
|
#### 总结
|
|
|
|
基于多维度动态云图的Ichimoku高级多周期交易策略是一个强大而灵活的技术分析工具,特别适合长期趋势交易。通过整合多个Ichimoku指标线和云图分析,结合智能的风险管理机制,该策略能够提供全面的市场洞察和交易信号。虽然存在一些固有的风险和局限性,但通过持续优化和适当的使用,它有潜力成为交易者工具箱中的有力武器。未来的优化方向应聚焦于提高策略的适应性、精确性和鲁棒性,以应对不断变化的市场环境。总的来说,这是一个值得深入研究和实践的高级交易策略,尤其适合那些追求长期稳定收益的投资者和交易者。
|
|
|
|
||
|
|
|
|
#### Overview
|
|
|
|
The Advanced Multi-Timeframe Ichimoku Cloud Trading Strategy with Dynamic Multidimensional Analysis is a complex and comprehensive technical analysis tool designed to capture long-term trends and significant turning points in the market. Based on the traditional Ichimoku Kinko Hyo indicator, this strategy achieves adaptive analysis across different market cycles by dynamically adjusting key parameters and introducing risk management mechanisms. The core of the strategy lies in utilizing the crossovers and relative positions of multiple indicator lines such as Tenkan-sen (Conversion Line), Kijun-sen (Base Line), Senkou Span A and B (Leading Span A and B), and Chikou Span (Lagging Span), combined with the price position relative to the Kumo (Cloud), to generate buy and sell signals.
|
|
|
|
#### Strategy Principles
|
|
|
|
1. Signal Generation Mechanism:
|
|
- Buy Signal: Triggered when Tenkan-sen crosses above Kijun-sen and the price is above the cloud.
|
|
- Sell Signal: Triggered when Tenkan-sen crosses below Kijun-sen and the price is below the cloud.
|
|
|
|
2. Dynamic Parameter Adjustment:
|
|
- Tenkan-sen Period: 9 periods
|
|
- Kijun-sen Period: 26 periods
|
|
- Senkou Span B Period: 52 periods
|
|
- Displacement: 26 periods
|
|
|
|
3. Risk Management:
|
|
- Incorporates adjustable stop-loss percentage (default 5%) and take-profit percentage (default 10%)
|
|
- Suitable for long-term trading, especially on weekly or monthly charts
|
|
|
|
4. Visualization:
|
|
- Uses custom color schemes to enhance the visibility of the cloud and various indicator lines
|
|
- Adjusts cloud transparency (90%) to improve readability
|
|
|
|
5. Multidimensional Analysis:
|
|
- Combines price, multiple moving averages, and cloud positions for multi-angle market analysis
|
|
- Utilizes Chikou Span to reflect historical price performance, adding decision-making reference
|
|
|
|
#### Strategy Advantages
|
|
|
|
1. Comprehensiveness: Integrates multiple technical indicators, providing a comprehensive analysis of market trends, momentum, and potential support/resistance levels.
|
|
|
|
2. Adaptability: Through adjustable parameters, the strategy can adapt to different market environments and trading cycles.
|
|
|
|
3. Risk Management: Built-in stop-loss and take-profit mechanisms help control risk and protect profits.
|
|
|
|
4. Visual Intuitiveness: Custom color schemes and transparency settings make market conditions easily discernible.
|
|
|
|
5. Long-term Stability: Particularly suitable for long-term traders, helping to capture major trends and reduce noise interference.
|
|
|
|
6. Multidimensional Analysis: By considering multiple indicators comprehensively, it reduces the risk of false signals.
|
|
|
|
7. Automation: The strategy can be easily integrated into automated trading systems, reducing manual intervention.
|
|
|
|
#### Strategy Risks
|
|
|
|
1. Lag: Ichimoku indicators are inherently lagging, which may result in delayed reactions in rapidly changing markets.
|
|
|
|
2. Over-reliance: Excessive dependence on a single strategy may overlook other important market factors.
|
|
|
|
3. Parameter Sensitivity: Different market environments may require different parameter settings, necessitating regular optimization.
|
|
|
|
4. False Breakouts: May generate more false signals in range-bound markets, increasing trading costs.
|
|
|
|
5. Complexity: The comprehensive analysis of multiple indicators may complicate the decision-making process, especially for novice traders.
|
|
|
|
6. Backtesting Bias: Good performance in historical data backtests does not guarantee future performance; beware of overfitting.
|
|
|
|
7. Market Adaptability: The strategy performs well in trending markets but may be less effective in sideways or highly volatile markets.
|
|
|
|
#### Strategy Optimization Directions
|
|
|
|
1. Dynamic Parameter Adjustment: Introduce adaptive mechanisms to automatically adjust parameters based on market volatility.
|
|
|
|
2. Multi-Timeframe Analysis: Integrate signals from different time periods to improve decision reliability.
|
|
|
|
3. Quantitative Indicator Fusion: Combine with other technical indicators such as volume and volatility to enhance signal credibility.
|
|
|
|
4. Machine Learning Optimization: Utilize machine learning algorithms to optimize parameter selection and signal generation processes.
|
|
|
|
5. Sentiment Analysis Integration: Incorporate market sentiment indicators, such as VIX or social media sentiment analysis, to enrich decision-making bases.
|
|
|
|
6. Advanced Risk Management: Implement dynamic stop-loss and take-profit targets that automatically adjust based on market conditions.
|
|
|
|
7. Enhanced Backtesting Framework: Develop a more comprehensive backtesting system that includes practical factors such as slippage and trading costs.
|
|
|
|
#### Summary
|
|
|
|
The Advanced Multi-Timeframe Ichimoku Cloud Trading Strategy with Dynamic Multidimensional Analysis is a powerful and flexible technical analysis tool, particularly suitable for long-term trend trading. By integrating multiple Ichimoku indicator lines and cloud analysis, combined with intelligent risk management mechanisms, this strategy can provide comprehensive market insights and trading signals. While there are some inherent risks and limitations, through continuous optimization and appropriate use, it has the potential to become a powerful weapon in a trader's toolkit. Future optimization directions should focus on improving the strategy's adaptability, precision, and robustness to cope with ever-changing market environments. Overall, this is an advanced trading strategy worth in-depth study and practice, especially suitable for investors and traders seeking long-term stable returns.
|
|
|
|
[/trans]
|
|
|
|
|
|
|
|
> Source (PineScript)
|
|
|
|
``` pinescript
|
|
/*backtest
|
|
start: 2024-06-30 00:00:00
|
|
end: 2024-07-30 00:00:00
|
|
period: 2h
|
|
basePeriod: 15m
|
|
exchanges: [{"eid":"Futures_Binance","currency":"BTC_USDT"}]
|
|
*/
|
|
|
|
//@version=5
|
|
strategy("Ichimoku",overlay = true)
|
|
//indicator("Flexible Ichimoku Cloud for Long-Term Trading", overlay=true, shorttitle="Ichimoku")
|
|
|
|
// Inputs for the Ichimoku Cloud
|
|
tenkan_period = input.int(9, title="Tenkan-sen Period")
|
|
kijun_period = input.int(26, title="Kijun-sen Period")
|
|
senkou_b_period = input.int(52, title="Senkou Span B Period")
|
|
displacement = input.int(26, title="Displacement")
|
|
|
|
// Inputs for Risk Management
|
|
stop_loss_percentage = input.float(5.0, title="Stop-Loss Percentage", minval=0.1, step=0.1) / 100 // Default to 5% for long-term
|
|
take_profit_percentage = input.float(10.0, title="Take-Profit Percentage", minval=0.1, step=0.1) / 100 // Default to 10% for long-term
|
|
|
|
// Colors and Styling
|
|
tenkan_color = input.color(color.blue, title="Tenkan-sen Color")
|
|
kijun_color = input.color(color.red, title="Kijun-sen Color")
|
|
senkou_a_color = input.color(color.green, title="Senkou Span A Color")
|
|
senkou_b_color = input.color(color.maroon, title="Senkou Span B Color")
|
|
chikou_color = input.color(color.purple, title="Chikou Span Color")
|
|
cloud_bull_color = input.color(color.green, title="Bullish Cloud Color", inline="cloud")
|
|
cloud_bear_color = input.color(color.red, title="Bearish Cloud Color", inline="cloud")
|
|
cloud_transparency = input.int(90, title="Cloud Transparency", minval=0, maxval=100)
|
|
|
|
// Calculating the Ichimoku components
|
|
tenkan_sen = (ta.highest(high, tenkan_period) + ta.lowest(low, tenkan_period)) / 2
|
|
kijun_sen = (ta.highest(high, kijun_period) + ta.lowest(low, kijun_period)) / 2
|
|
senkou_span_a = ta.sma(tenkan_sen + kijun_sen, 1) / 2
|
|
senkou_span_b = (ta.highest(high, senkou_b_period) + ta.lowest(low, senkou_b_period)) / 2
|
|
chikou_span = close[displacement]
|
|
|
|
// Plotting the Ichimoku components
|
|
//plot(tenkan_sen, color=tenkan_color, title="Tenkan-sen", linewidth=2)
|
|
//plot(kijun_sen, color=kijun_color, title="Kijun-sen", linewidth=2)
|
|
//plot(senkou_span_a, color=senkou_a_color, title="Senkou Span A", offset=displacement, linewidth=1)
|
|
//plot(senkou_span_b, color=senkou_b_color, title="Senkou Span B", offset=displacement, linewidth=1)
|
|
//plot(chikou_span, color=chikou_color, title="Chikou Span", offset=-displacement, linewidth=1)
|
|
|
|
// Plotting the Kumo (Cloud)
|
|
p1 = plot(senkou_span_a, offset=displacement, color=senkou_a_color)
|
|
p2 = plot(senkou_span_b, offset=displacement, color=senkou_b_color)
|
|
fill(p1, p2, color=senkou_span_a > senkou_span_b ? color.new(cloud_bull_color, cloud_transparency) : color.new(cloud_bear_color, cloud_transparency), title="Kumo")
|
|
|
|
// Long and Short Conditions
|
|
longCondition = ta.crossover(tenkan_sen, kijun_sen) and close > senkou_span_a and close > senkou_span_b
|
|
shortCondition = ta.crossunder(tenkan_sen, kijun_sen) and close < senkou_span_a and close < senkou_span_b
|
|
|
|
// Plotting Buy and Sell Signals
|
|
plotshape(series=longCondition, location=location.belowbar, color=color.green, style=shape.labelup, text="BUY", title="Buy Signal", size=size.small)
|
|
plotshape(series=shortCondition, location=location.abovebar, color=color.red, style=shape.labeldown, text="SELL", title="Sell Signal", size=size.small)
|
|
|
|
var float entry_price = na
|
|
var float stop_loss = na
|
|
var float take_profit = na
|
|
|
|
if (longCondition)
|
|
entry_price := close
|
|
stop_loss := close * (1 - stop_loss_percentage)
|
|
take_profit := close * (1 + take_profit_percentage)
|
|
|
|
if (shortCondition)
|
|
entry_price := close
|
|
stop_loss := close * (1 + stop_loss_percentage)
|
|
take_profit := close * (1 - take_profit_percentage)
|
|
|
|
// Plotting Stop-Loss and Take-Profit Levels
|
|
//plot(entry_price, color=color.yellow, title="Entry Price", linewidth=1, offset=-displacement)
|
|
//plot(stop_loss, color=color.red, title="Stop-Loss Level", linewidth=1, offset=-displacement)
|
|
//plot(take_profit, color=color.green, title="Take-Profit Level", linewidth=1, offset=-displacement)
|
|
|
|
// Plotting Stop-Loss and Take-Profit Labels
|
|
//label.new(bar_index, stop_loss, text="SL", color=color.red, style=label.style_label_down, textcolor=color.white, size=size.small)
|
|
//label.new(bar_index, take_profit, text="Take-Profit", color=color.green, style=label.style_label_up, textcolor=color.white, size=size.small)
|
|
|
|
// Alerts for Buy and Sell Signals
|
|
alertcondition(longCondition, title="Buy Alert", message="Ichimoku Buy Signal")
|
|
alertcondition(shortCondition, title="Sell Alert", message="Ichimoku Sell Signal")
|
|
|
|
strategy.entry("Long",strategy.long, when=longCondition)
|
|
strategy.close("Long",when=shortCondition)
|
|
```
|
|
|
|
> Detail
|
|
|
|
https://www.fmz.com/strategy/458277
|
|
|
|
> Last Modified
|
|
|
|
2024-07-31 14:54:29
|