
179 lines
8.6 KiB
Markdown
179 lines
8.6 KiB
Markdown
|
||
> Name
|
||
|
||
基于动态成本平均与流动性波动的机构级做市商跟踪策略-Institutional-Market-Maker-Tracking-Strategy-with-Dynamic-Cost-Averaging-and-Liquidity-Flow-Analysis
|
||
|
||
> Author
|
||
|
||
ianzeng123
|
||
|
||
> Strategy Description
|
||
|
||
|
||
|
||
|
||
|
||
|
||
[trans]
|
||
#### 概述
|
||
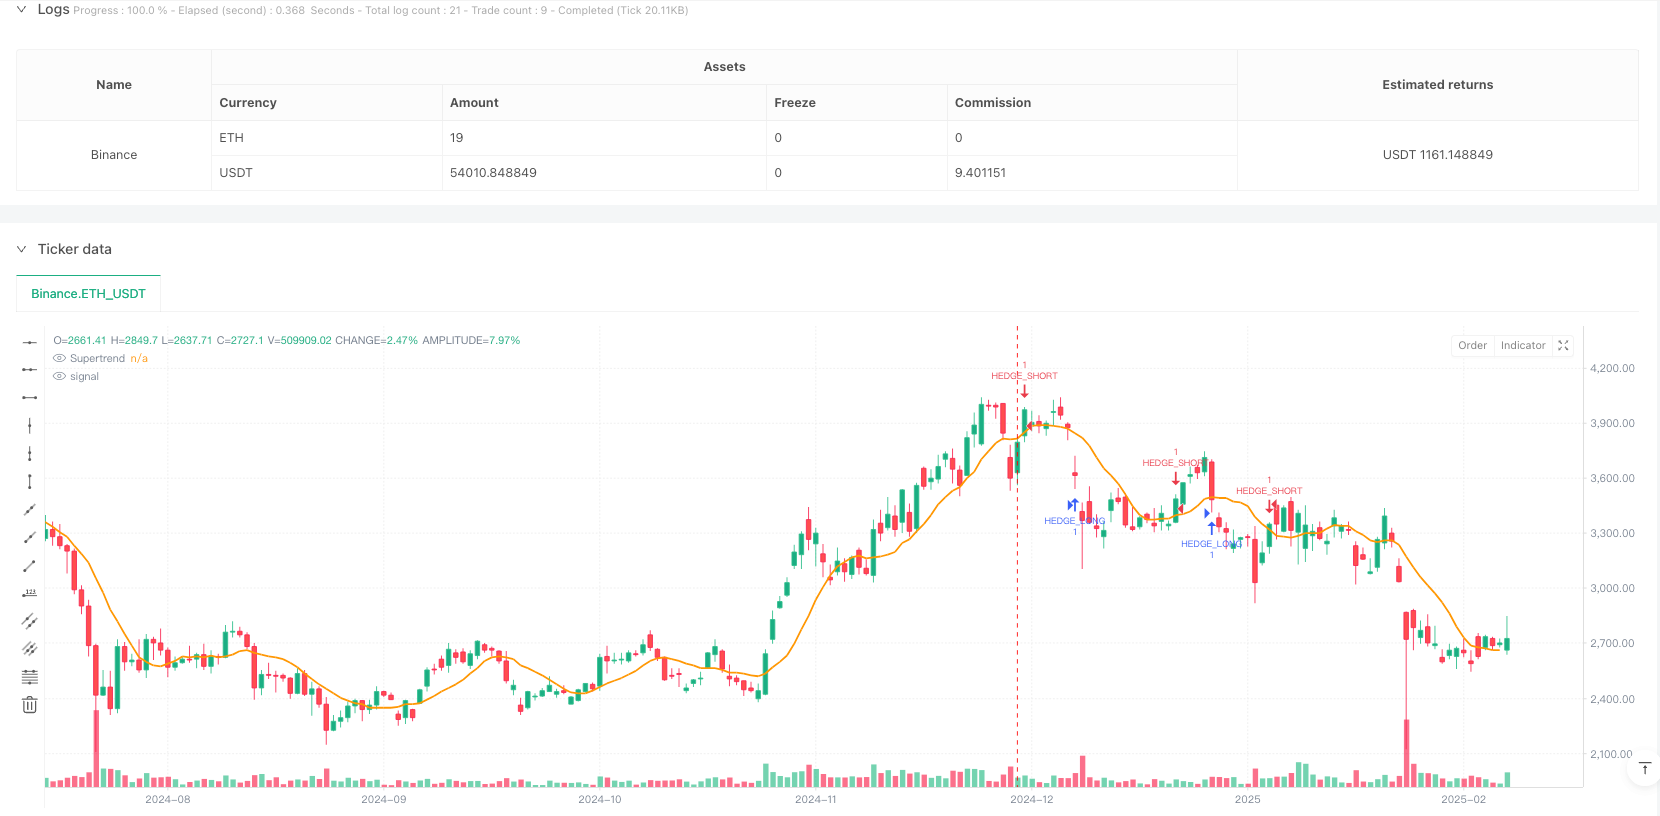
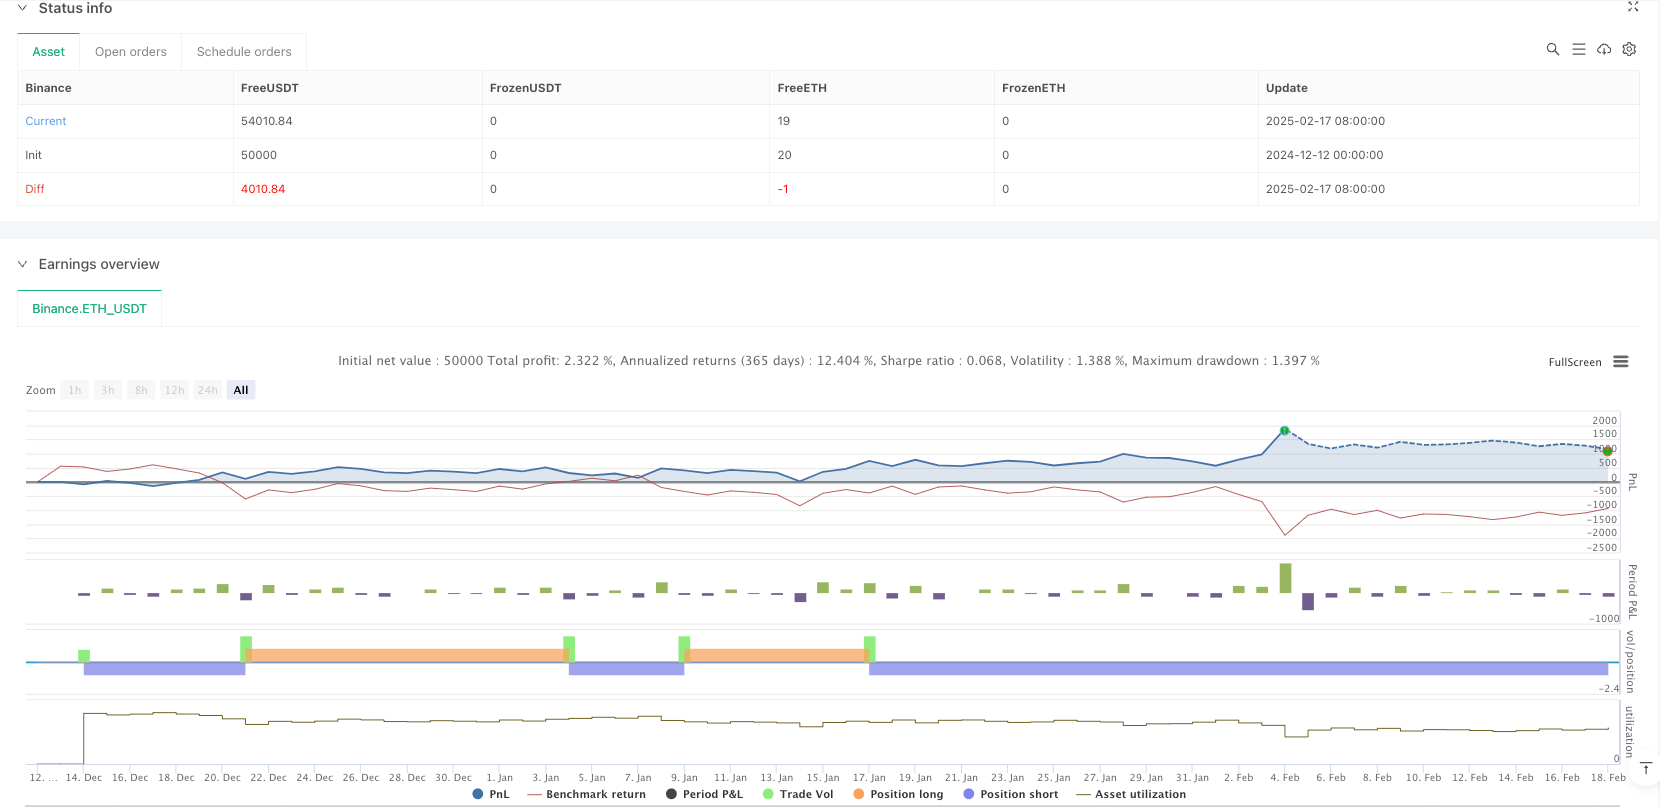
该策略是一个基于做市商行为和机构级流动性分析的交易系统。它通过追踪市场流动性指标、订单簿失衡和做市商足迹来识别高概率交易机会。策略融合了动态成本平均(DCAA)方法与对冲流动性系统,以实现风险最小化和收益最大化。该系统完全摒弃了传统技术指标,转而依赖于机构级别的市场微观结构分析。
|
||
|
||
#### 策略原理
|
||
策略的核心是通过多维度数据来追踪做市商行为:
|
||
1. 使用VWAP(成交量加权平均价格)来确认机构吸筹/出货位置
|
||
2. 通过CVD(累计成交量差)来检测多空双方的实际力量对比
|
||
3. 结合订单簿数据来识别流动性陷阱和止损猎杀区域
|
||
4. 通过动态成本平均方法在关键支撑位建立分批建仓系统
|
||
5. 配合对冲系统在市场剧烈波动时进行风险管理
|
||
|
||
#### 策略优势
|
||
1. 完全基于市场微观结构,避免了技术指标滞后的问题
|
||
2. 通过对做市商行为的分析,能够提前预测大规模价格波动
|
||
3. 动态成本平均系统能够在下跌中逐步建仓,降低整体持仓成本
|
||
4. 对冲系统提供了额外的风险保护层,特别是在市场剧烈波动时期
|
||
5. 策略可以实时适应市场条件,不依赖于静态支撑阻力位
|
||
|
||
#### 策略风险
|
||
1. 需要实时高质量的市场数据,对数据延迟较为敏感
|
||
2. 在市场流动性极度缺乏时可能难以准确判断做市商意图
|
||
3. 过度依赖做市商行为分析可能在某些市场条件下产生误判
|
||
4. 动态成本平均系统在持续下跌市场中可能积累较大亏损
|
||
5. 对冲策略的成本可能在横盘市场中侵蚀盈利
|
||
|
||
#### 策略优化方向
|
||
1. 引入机器学习算法来提高做市商行为识别的准确性
|
||
2. 优化动态成本平均系统的资金分配比例
|
||
3. 增加更多的市场微观结构指标来提高信号可靠性
|
||
4. 开发自适应的对冲比例调整机制
|
||
5. 建立更完善的风险控制系统,特别是在极端市场条件下
|
||
|
||
#### 总结
|
||
这是一个建立在市场微观结构基础上的机构级交易策略。通过对做市商行为的深入分析,结合动态成本平均和对冲系统,策略能够在不同市场环境下保持稳定性。虽然策略实施需要克服一些技术和操作上的挑战,但其核心理念和方法论具有扎实的市场微观结构基础,具备长期稳定盈利的潜力。
|
||
|
||
||
|
||
|
||
#### Overview
|
||
This strategy is a trading system based on market maker behavior and institutional-level liquidity analysis. It identifies high-probability trading opportunities by tracking market liquidity indicators, order book imbalances, and market maker footprints. The strategy combines Dynamic Cost Averaging (DCAA) with a hedge flow system to minimize risks and maximize returns. The system completely abandons traditional technical indicators in favor of institutional-level market microstructure analysis.
|
||
|
||
#### Strategy Principles
|
||
The core of the strategy is tracking market maker behavior through multi-dimensional data:
|
||
1. Using VWAP (Volume Weighted Average Price) to confirm institutional absorption/distribution positions
|
||
2. Analyzing CVD (Cumulative Volume Delta) to detect actual strength comparison between bulls and bears
|
||
3. Combining order book data to identify liquidity traps and stop-loss hunting zones
|
||
4. Implementing dynamic cost averaging method to establish staged position building at key support levels
|
||
5. Utilizing a hedging system for risk management during extreme market volatility
|
||
|
||
#### Strategy Advantages
|
||
1. Entirely based on market microstructure, avoiding the lag of technical indicators
|
||
2. Ability to predict large price movements in advance through market maker behavior analysis
|
||
3. Dynamic cost averaging system enables gradual position building during downtrends, reducing overall position cost
|
||
4. Hedging system provides additional risk protection, especially during periods of extreme market volatility
|
||
5. Strategy can adapt to market conditions in real-time, not relying on static support/resistance levels
|
||
|
||
#### Strategy Risks
|
||
1. Requires high-quality real-time market data, sensitive to data latency
|
||
2. May struggle to accurately judge market maker intentions during extremely low liquidity periods
|
||
3. Over-reliance on market maker behavior analysis may lead to false signals under certain market conditions
|
||
4. Dynamic cost averaging system may accumulate significant losses in continuously declining markets
|
||
5. Hedging strategy costs may erode profits in ranging markets
|
||
|
||
#### Optimization Directions
|
||
1. Introduce machine learning algorithms to improve market maker behavior identification accuracy
|
||
2. Optimize capital allocation ratios in the dynamic cost averaging system
|
||
3. Add more market microstructure indicators to enhance signal reliability
|
||
4. Develop adaptive hedge ratio adjustment mechanisms
|
||
5. Establish more comprehensive risk control systems, especially under extreme market conditions
|
||
|
||
#### Summary
|
||
This is an institutional-grade trading strategy built on market microstructure foundations. Through deep analysis of market maker behavior, combined with dynamic cost averaging and hedging systems, the strategy maintains stability across different market environments. While implementation faces some technical and operational challenges, its core concepts and methodology have solid market microstructure foundations, showing potential for long-term stable profitability.[/trans]
|
||
|
||
|
||
|
||
> Source (PineScript)
|
||
|
||
``` pinescript
|
||
/*backtest
|
||
start: 2024-12-12 00:00:00
|
||
end: 2025-02-18 08:00:00
|
||
period: 1d
|
||
basePeriod: 1d
|
||
exchanges: [{"eid":"Binance","currency":"ETH_USDT"}]
|
||
*/
|
||
|
||
//@version=6
|
||
strategy("EDGE Market Maker Strategy – DCAA & HedgeFlow", overlay=true)
|
||
|
||
// ✅ Import Indicators
|
||
vwapLine = ta.vwap
|
||
superTrend = ta.sma(close, 10) // Replace with actual Supertrend formula if needed
|
||
volData = volume // Volume from current timeframe
|
||
cvdData = ta.cum(close - close[1]) // Approximation of CVD (Cumulative Volume Delta)
|
||
orderBlockHigh = ta.highest(high, 20) // Approximate Order Block Detection
|
||
orderBlockLow = ta.lowest(low, 20)
|
||
|
||
// ✅ Market Maker Buy Conditions
|
||
longCondition = ta.crossover(close, vwapLine) and cvdData > cvdData[1] and volData > volData[1]
|
||
if longCondition
|
||
strategy.entry("BUY", strategy.long)
|
||
|
||
// ✅ Market Maker Sell Conditions
|
||
shortCondition = ta.crossunder(close, vwapLine) and cvdData < cvdData[1] and volData > volData[1]
|
||
if shortCondition
|
||
strategy.entry("SELL", strategy.short)
|
||
|
||
// ✅ Order Block Confirmation (For Stronger Signals)
|
||
longOB = longCondition and close > orderBlockHigh
|
||
shortOB = shortCondition and close < orderBlockLow
|
||
|
||
if longOB
|
||
label.new(bar_index, high, "BUY (Order Block)", color=color.green, textcolor=color.white, style=label.style_label_down)
|
||
|
||
if shortOB
|
||
label.new(bar_index, low, "SELL (Order Block)", color=color.red, textcolor=color.white, style=label.style_label_up)
|
||
|
||
// ✅ DCAA Levels – Adaptive Re-Entry Strategy
|
||
dcaaBuy1 = close * 0.97 // First re-entry for long position (3% drop)
|
||
dcaaBuy2 = close * 0.94 // Second re-entry for long position (6% drop)
|
||
dcaaSell1 = close * 1.03 // First re-entry for short position (3% rise)
|
||
dcaaSell2 = close * 1.06 // Second re-entry for short position (6% rise)
|
||
|
||
if longCondition
|
||
strategy.entry("DCAA_BUY_1", strategy.long, limit=dcaaBuy1)
|
||
strategy.entry("DCAA_BUY_2", strategy.long, limit=dcaaBuy2)
|
||
|
||
if shortCondition
|
||
strategy.entry("DCAA_SELL_1", strategy.short, limit=dcaaSell1)
|
||
strategy.entry("DCAA_SELL_2", strategy.short, limit=dcaaSell2)
|
||
|
||
// ✅ HedgeFlow System – Dynamic Hedge Adjustments
|
||
hedgeLong = ta.crossunder(close, superTrend) and cvdData < cvdData[1] and volData > volData[1]
|
||
hedgeShort = ta.crossover(close, superTrend) and cvdData > cvdData[1] and volData > volData[1]
|
||
|
||
if hedgeLong
|
||
strategy.entry("HEDGE_LONG", strategy.long)
|
||
|
||
if hedgeShort
|
||
strategy.entry("HEDGE_SHORT", strategy.short)
|
||
|
||
// ✅ Take Profit & Stop Loss
|
||
tpLong = close * 1.05
|
||
tpShort = close * 0.95
|
||
slLong = close * 0.97
|
||
slShort = close * 1.03
|
||
|
||
strategy.exit("TP_Long", from_entry="BUY", limit=tpLong, stop=slLong)
|
||
strategy.exit("TP_Short", from_entry="SELL", limit=tpShort, stop=slShort)
|
||
|
||
// ✅ Plot VWAP & Supertrend for Reference
|
||
plot(vwapLine, title="VWAP", color=color.blue, linewidth=2)
|
||
plot(superTrend, title="Supertrend", color=color.orange, linewidth=2)
|
||
```
|
||
|
||
> Detail
|
||
|
||
https://www.fmz.com/strategy/482856
|
||
|
||
> Last Modified
|
||
|
||
2025-02-27 17:34:56
|