
11 KiB
Name
均线加权标准差交易策略Weighted-Standard-Deviation-Trading-Strategy
Author
ChaoZhang
Strategy Description
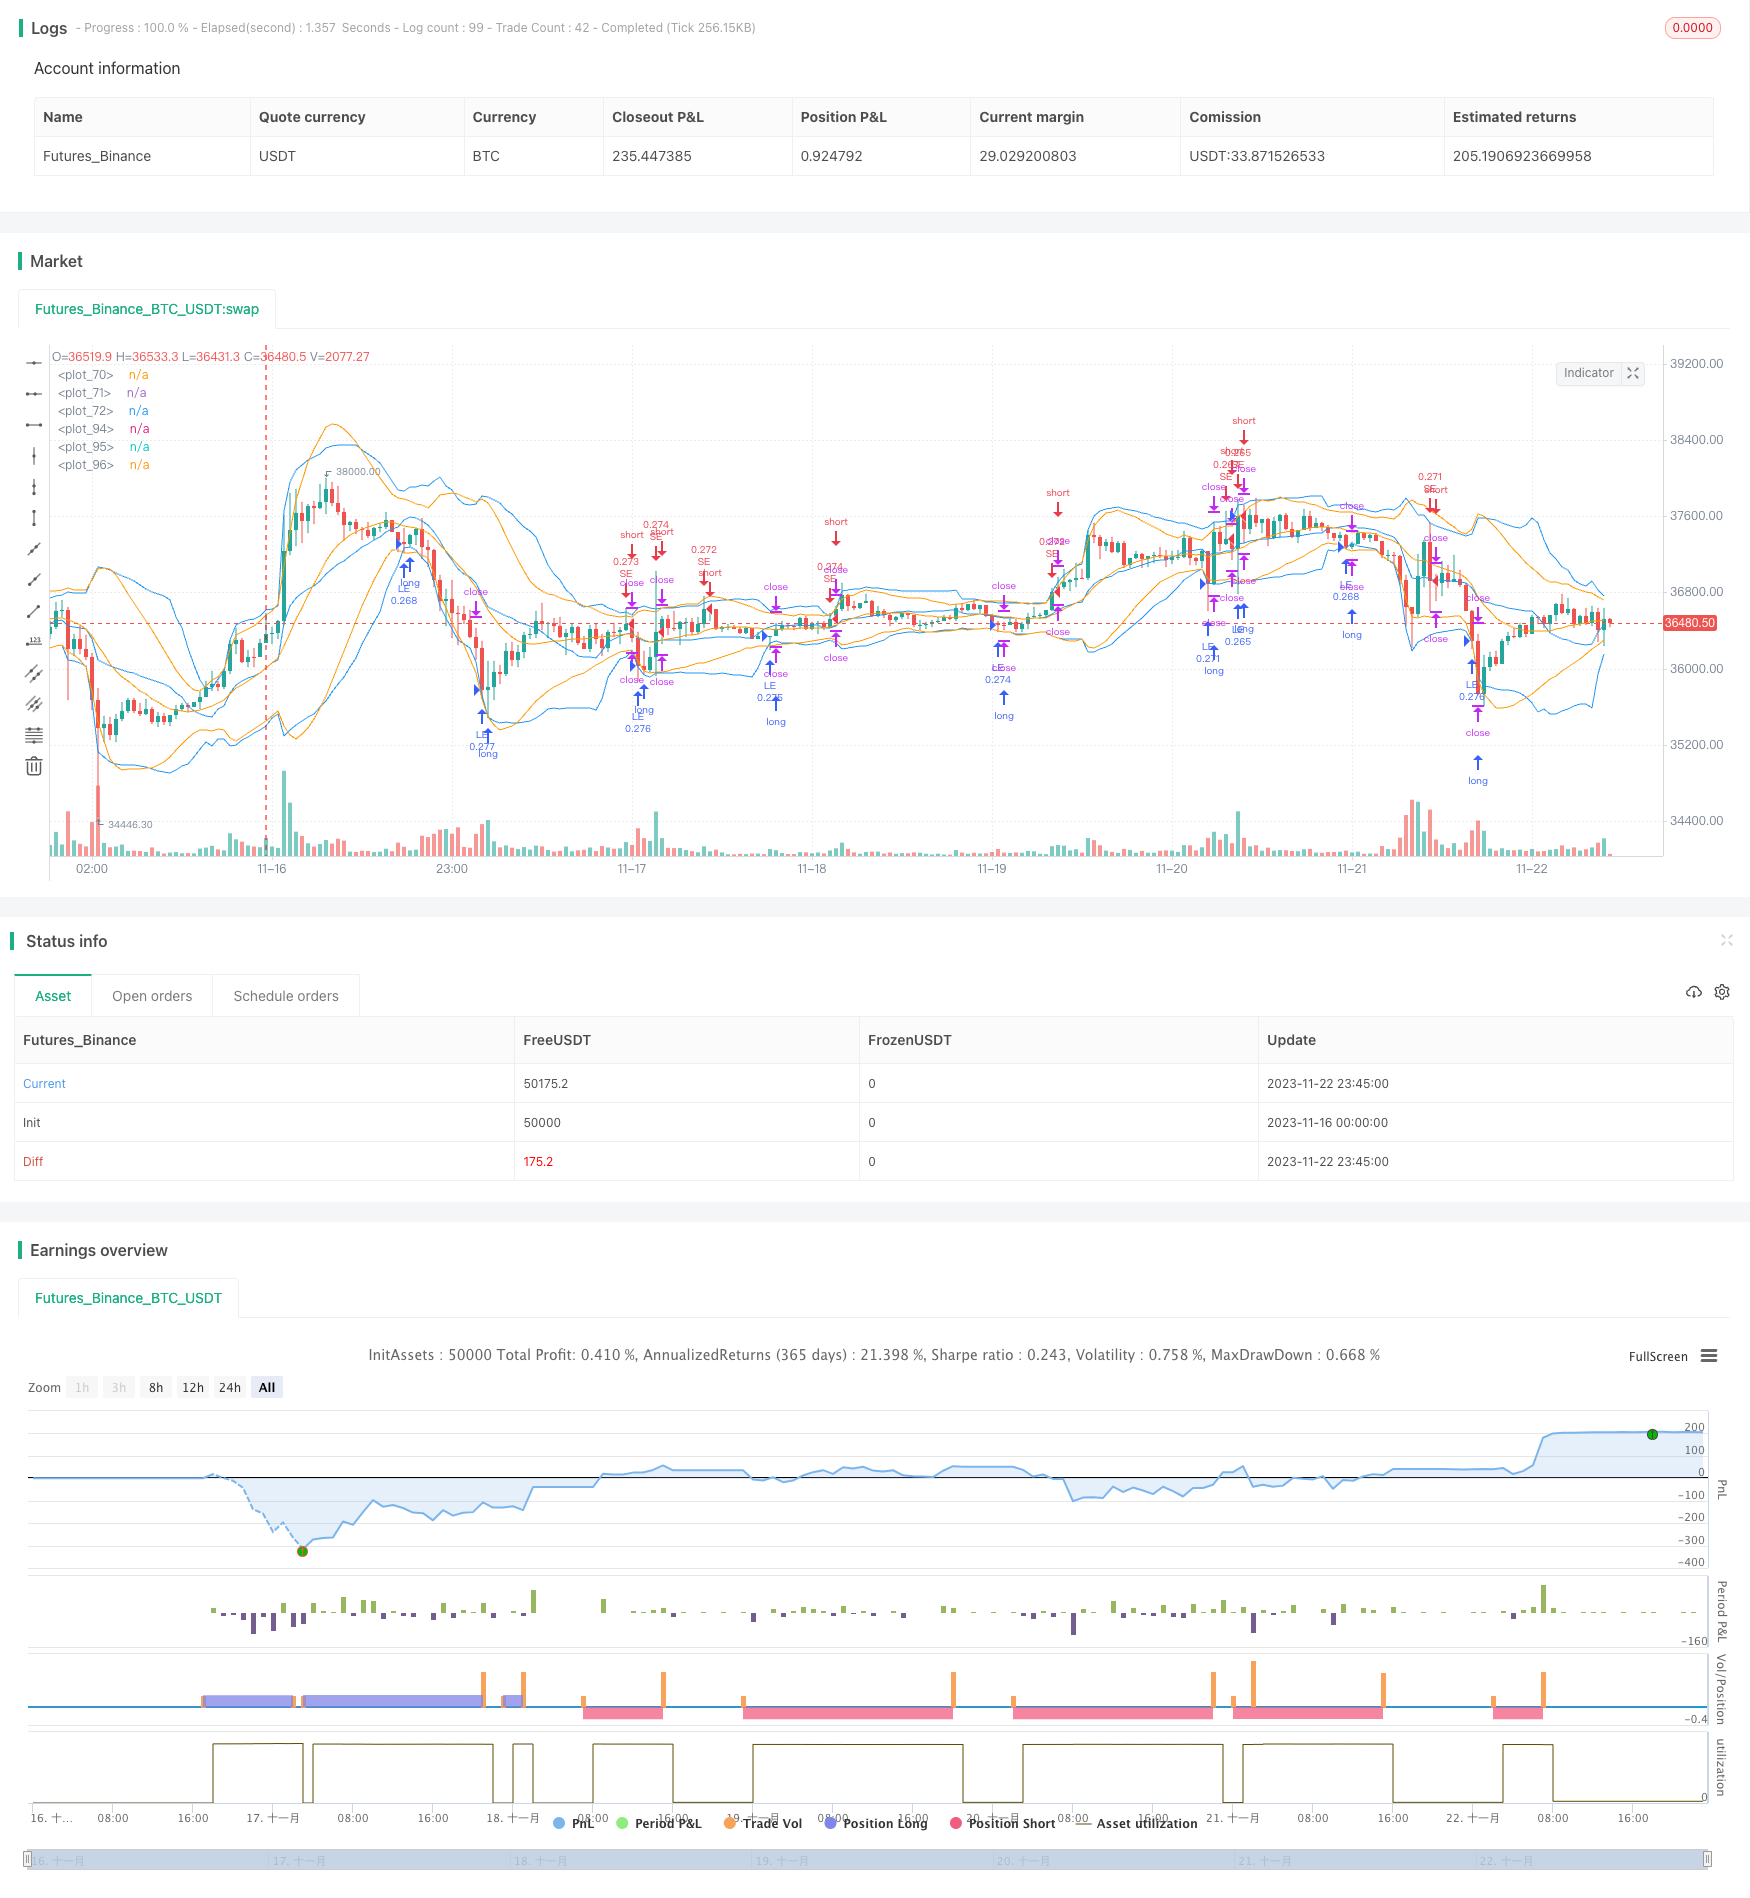 [trans]
概述
本策略运用加权标准差指标,结合移动平均线,实现对加密货币的趋势交易。策略根据一定周期内的收盘价及成交量,计算出价格的加权标准差通道。当价格突破通道上下轨时,做多做空。同时,设置止损止盈条件,降低单笔损失。
策略原理
代码中定义了两个自定义函数,分别从时间序列和数组计算加权标准差。主要步骤是:
- 根据收盘价和成交量,计算加权平均价
- 计算每根K线与平均价的误差的平方
- 按照样本量及权重调整后的平均值,计算方差
- 开方得到标准差
这样,我们便得到了一个中心在加权平均价,上下距离为一个标准差的通道。当价格从下方突破该通道底部时,做多;当从上方突破通道顶部时,做空。
优势分析
这套策略最大的优势在于,融合了移动平均线和波动率分析。移动平均线判断市场趋势方向,标准差界定合理区间,二者相互验证,可靠性较高。另外,成交量权重可过滤假突破,实际突破概率更大。
该策略还设置了止损止盈点,有利于把握趋势,而避免反转造成 Loss 过大。这是许多新手无法掌握的要点。
风险分析
主要风险在于,市场可能出现剧烈波动。这时标准差通道也会大幅波动,不利于判断。此外,如果选择周期过短,容易被噪音干扰,出错率较大。
对策是,可适当调整周期参数,平滑曲线。也可以考虑结合其他指标,如 RSI 等,增加突破的确认效果。
优化方向
- 优化周期参数。可以测试 5 分钟、15 分钟、30 分钟等不同周期,寻找最佳组合
- 优化止损止盈比例。测试不同的止损止盈点,取得最优回报率
- 增加过滤条件。比如结合成交量,避免虚假突破带来 Loss
- 增加蜡烛指标。如通过收盘价位置、影线长度等确认K线实体,减少错误率
总结
本策略成功利用加权标准差指标,辅以移动平均线判断方向,实现对加密货币的趋势跟踪。同时,合理的止损止盈设置有助于把握市场节奏,避免过度反转带来损失。通过参数调整与多指标验证,可进一步优化,并形成可靠的量化交易策略。
||
Overview
This strategy uses the weighted standard deviation indicator combined with moving average to implement trend trading on cryptocurrencies. It calculates a price channel of weighted standard deviation based on closing prices and volumes over a certain period. When the price breaks through the upper or lower channel, long or short positions are taken. Stop loss and take profit conditions are also set to limit losses per trade.
Strategy Logic
The code defines two custom functions to calculate weighted standard deviation from time series and arrays. The key steps are:
- Calculate the weighted average price based on closing price and volume
- Calculate the squared error of each candle vs the average price
- Calculate variance based on sample size, weights and adjusted mean
- Take square root to derive standard deviation
This gives us a channel centered on the weighted average price, with upper and lower bounds at one standard deviation away. When price breaks through the channel bottom from below, go long. When it breaks through the top from above, go short.
Advantage Analysis
The biggest edge of this strategy is the combination of moving average and volatility analysis. The MA judges the market trend direction while the SD range defines a sensible band - both verify each other for higher reliability. Also, the volume weighting helps filter false breaks for higher success probability on actual breaks.
The stop loss and take profit points further help trade with the trend and avoid excessive losses on reversals. This is a subtlety that many novice traders fail to implement.
Risk Analysis
The main risk is from violent market swings. This can cause the SD channel to swing wildly too, making judgements difficult. Also, choosing too short periods risks getting misled by noise and errors.
The remedy is to smooth the parameters and period settings appropriately. Consider combining other indicators like RSI to improve breakout confirmation.
Optimization Directions
- Optimize period parameters - test 5min, 15min, 30mins etc for best combo
- Optimize stop loss/take profit ratios for maximum return
- Add filters eg volume to avoid false breaks
- Add candlestick filters on close price, wick etc to improve accuracy
Conclusion
This strategy successfully employs the weighted standard deviation indicator together with MA to track cryptocurrency trends. Reasonable stop loss/take profit setups also help trade market rhythm and avoid excessive reversal losses. Further optimizations via parameter tuning and multi-indicator confirmation can improve reliability for a solid algo trading strategy.
[/trans]
Strategy Arguments
| Argument | Default | Description |
|---|---|---|
| v_input_1 | 20 | len |
| v_input_2 | 3.11 | Stop Loss % |
| v_input_3 | 7.5 | Take Profit % |
Source (PineScript)
/*backtest
start: 2023-11-16 00:00:00
end: 2023-11-23 00:00:00
period: 45m
basePeriod: 5m
exchanges: [{"eid":"Futures_Binance","currency":"BTC_USDT"}]
*/

// This source code is subject to the terms of the Mozilla Public License 2.0 at https://mozilla.org/MPL/2.0/
// © rumpypumpydumpy   © cache_that_pass

//@version=4
strategy("[cache_that_pass] 1m 15m Function - Weighted Standard Deviation", overlay=true, pyramiding=0, default_qty_type=strategy.percent_of_equity, default_qty_value=20, initial_capital=10000, commission_type=strategy.commission.percent, commission_value=0.075)

f_weighted_sd_from_series(_src, _weight, _n) => //{
//  @function: Calculates weighted mean, variance, standard deviation, MSE and RMSE from time series variables
//  @parameters:
//      _src: time series variable of sample values
//      _weight: time series of corresponding weight values.
//      _n : number of samples
    _xw = _src * _weight
    _sum_weight = sum(_weight, _n)
    _mean = sum(_xw, _n) / _sum_weight
    float _sqerror_sum = 0
    int _nonzero_n = 0
    for _i = 0 to _n - 1
        _sqerror_sum := _sqerror_sum + pow(_mean - _src[_i], 2) * _weight[_i]
        _nonzero_n := _weight[_i] != 0 ? _nonzero_n + 1 : _nonzero_n
    _variance = _sqerror_sum / ((_nonzero_n - 1) * _sum_weight / _nonzero_n)
    _dev = sqrt(_variance)
    _mse = _sqerror_sum / _sum_weight
    _rmse = sqrt(_mse)
    [_mean, _variance, _dev, _mse, _rmse]
//}
// -----------------------------------------------------------------------------

f_weighted_sd_from_arrays(_a_src, _a_weight, _n) => //{
//  @function: Calculates weighted mean, variance, standard deviation, MSE and RMSE from arrays
//  Expects index 0 of the arrays to be the most recent sample and weight values!
//  @parameters:
//      _a_src: array of sample values
//      _a_weight: array of corresponding weight values.
//      _n : number of samples
    float _mean = na, float _variance = na, float _dev = na, float _mse = na
    float _rmse = na, float _sqerror_sum = na, float _sum_weight = na
    float[] _a_xw = array.new_float(_n)
    int _nonzero_n = 0
    if array.size(_a_src) >= _n
        _sum_weight := 0
        _sqerror_sum := 0
        for _i = 0 to _n - 1
            array.set(_a_xw, _i, array.get(_a_src, _i) * array.get(_a_weight, _i))
            _sum_weight := _sum_weight + array.get(_a_weight, _i)
            _nonzero_n := array.get(_a_weight, _i) != 0 ? _nonzero_n + 1 : _nonzero_n
        _mean := array.sum(_a_xw) / _sum_weight
        for _j = 0 to _n - 1
            _sqerror_sum := _sqerror_sum + pow(_mean - array.get(_a_src, _j), 2) * array.get(_a_weight, _j)
        _variance := _sqerror_sum / ((_nonzero_n - 1) * _sum_weight / _nonzero_n)
        _dev := sqrt(_variance)
        _mse := _sqerror_sum / _sum_weight
        _rmse := sqrt(_mse)
    [_mean, _variance, _dev, _mse, _rmse]
//}


// -----------------------------------------------------------------------------
// Example usage :
// -----------------------------------------------------------------------------

len = input(20)

// -----------------------------------------------------------------------------
// From series :
// -----------------------------------------------------------------------------
[m, v, d, mse, rmse] = f_weighted_sd_from_series(close, volume, len)


plot(m, color = color.blue)
plot(m + d * 2, color = color.blue)
plot(m - d * 2, color = color.blue)
// -----------------------------------------------------------------------------


// -----------------------------------------------------------------------------
// From arrays :
// -----------------------------------------------------------------------------
var float[] a_src = array.new_float()
var float[] a_weight = array.new_float()

if barstate.isfirst
    for i = 1 to len
        array.unshift(a_weight, i)

array.unshift(a_src, close)

if array.size(a_src) > len
    array.pop(a_src)

[a_m, a_v, a_d, a_mse, a_rmse] = f_weighted_sd_from_arrays(a_src, a_weight, len)

plot(a_m, color = color.orange)
plot(a_m + a_d * 2, color = color.orange)
plot(a_m - a_d * 2, color = color.orange)
// -----------------------------------------------------------------------------


series_text = "Mean : " + tostring(m) + "\nVariance : " + tostring(v) + "\nSD : " + tostring(d) + "\nMSE : " + tostring(mse) +  "\nRMSE : " + tostring(rmse)
array_text = "Mean : " + tostring(a_m) + "\nVariance : " + tostring(a_v) + "\nSD : " + tostring(a_d) + "\nMSE : " + tostring(a_mse) +  "\nRMSE : " + tostring(a_rmse)
debug_text = "Volume weighted from time series : \n" + series_text + "\n\nLinearly weighted from arrays : \n" + array_text

//debug = label.new(x = bar_index, y = close, text = debug_text, style = label.style_label_left)
//.delete(debug[1])

//test strategy
if low <= (m - d * 2)
    strategy.entry("LE", strategy.long)
if high >= (m + d * 2)
    strategy.entry("SE", strategy.short)

// User Options to Change Inputs (%)
stopPer = input(3.11, title='Stop Loss %', type=input.float) / 100
takePer = input(7.50, title='Take Profit %', type=input.float) / 100

// Determine where you've entered and in what direction
longStop = strategy.position_avg_price * (1 - stopPer)
shortStop = strategy.position_avg_price * (1 + stopPer)
shortTake = strategy.position_avg_price * (1 - takePer)
longTake = strategy.position_avg_price * (1 + takePer)

if strategy.position_size > 0
    strategy.exit(id="Close Long", stop=longStop, limit=longTake)
//    strategy.close("LE", when = (longStop) or (longTake), qty_percent = 100)
if strategy.position_size < 0
    strategy.exit(id="Close Short", stop=shortStop, limit=shortTake)
//    strategy.close("SE", when = (shortStop) or (shortTake), qty_percent = 100)
Detail
https://www.fmz.com/strategy/433096
Last Modified
2023-11-24 13:54:58