
249 lines
19 KiB
Markdown
249 lines
19 KiB
Markdown
|
|
> Name
|
|
|
|
固定范围成交量分布与锚定加权成交量平均价结合的趋势判断与动态止损策略-Fixed-Range-Volume-Profile-And-Anchored-VWAP-Trend-Identification-Strategy-With-Dynamic-Stop-Loss
|
|
|
|
> Author
|
|
|
|
ianzeng123
|
|
|
|
> Strategy Description
|
|
|
|
|
|
|
|
|
|
|
|
|
|
[trans]#### 概述
|
|
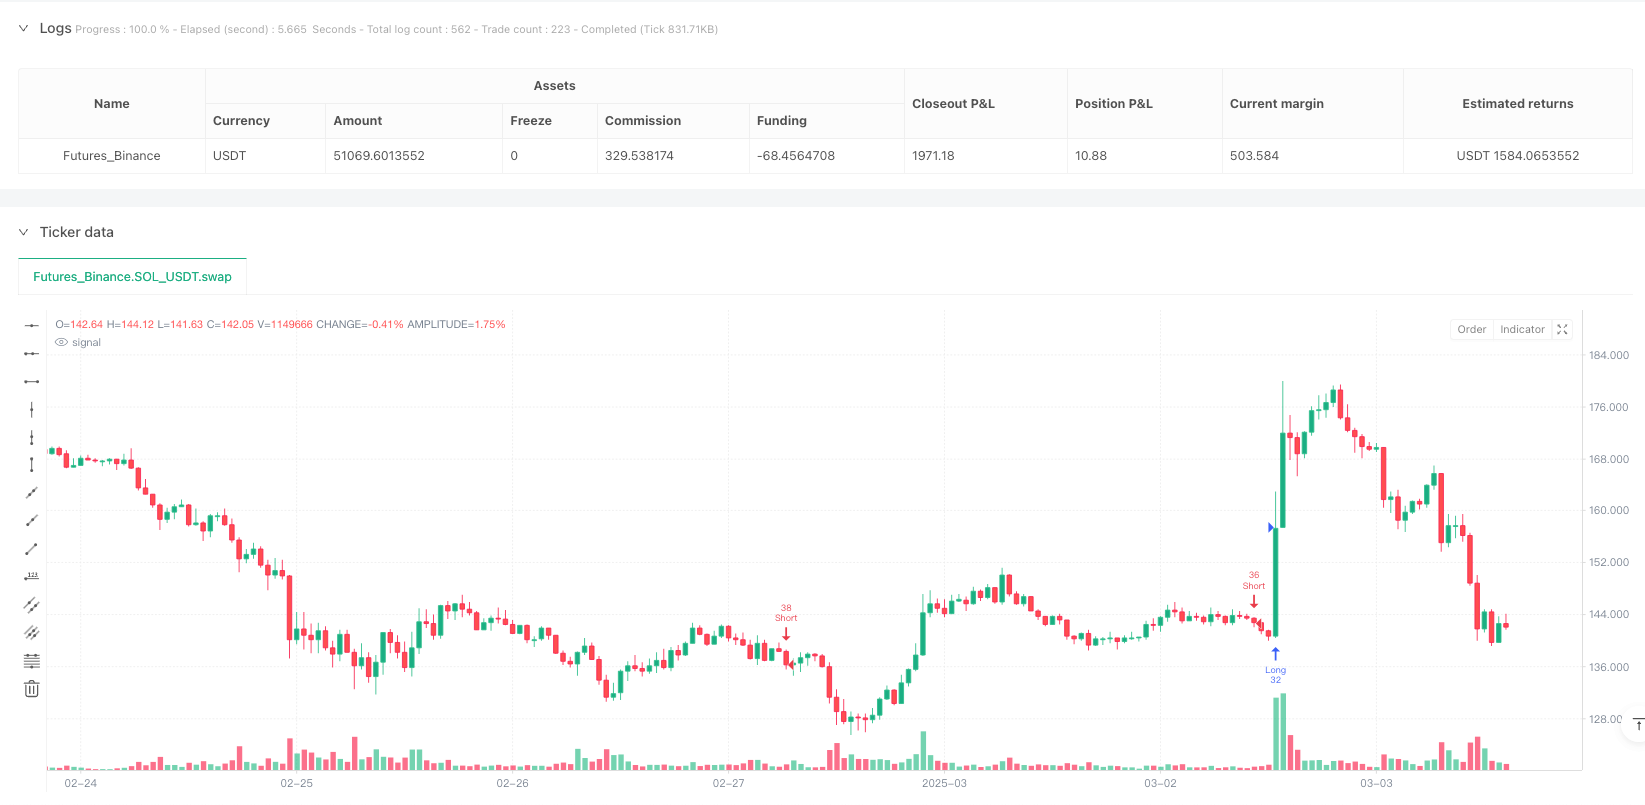
固定范围成交量分布与锚定加权成交量平均价结合的趋势判断与动态止损策略是一个综合性的交易系统,它巧妙地融合了固定范围成交量分布(FRVP)和锚定加权成交量平均价(AVWAP)两种强大的技术分析工具,并结合了RSI、EMA、MACD等多种动量指标,以及基于ATR的动态止损管理。该策略旨在捕捉价格趋势,同时通过多重过滤条件提高交易质量,减少虚假信号。系统采用体积分析与趋势跟踪相结合的方法,为交易者提供了一个全面且自适应的交易框架,特别适用于有明显趋势的市场环境。
|
|
|
|
#### 策略原理
|
|
该策略的核心原理是通过多维度分析市场结构和动力,结合成交量与价格行为做出交易决策。具体来说:
|
|
|
|
1. **锚定加权成交量平均价(AVWAP)**:作为动态支撑/阻力水平,通过加权成交量计算平均价格,为价格突破提供重要参考点。当价格突破AVWAP时,可能表明趋势方向已确立。
|
|
|
|
2. **固定范围成交量分布(FRVP)**:通过分析指定周期内的最高价和最低价,计算出中点价格(frvpMid),帮助识别市场结构的变化和关键价格水平。
|
|
|
|
3. **指数移动平均线(EMA)**:200周期EMA用作趋势过滤器,防止逆势交易。只有当价格位于EMA之上时才考虑做多,反之亦然。
|
|
|
|
4. **相对强弱指数(RSI)**:避免在超买/超卖区域交易,为入场提供额外确认。对于做多,要求RSI高于超卖水平;对于做空,要求RSI低于超买水平。
|
|
|
|
5. **MACD确认**:确保动量方向与交易方向一致,提高交易信号质量。
|
|
|
|
6. **成交量过滤器**:只在成交量高于20周期均值时交易,避免低流动性环境中的假突破。
|
|
|
|
7. **ATR基础的止损和追踪止损**:根据市场波动性动态调整止损位置,在保护资金的同时允许足够的价格呼吸空间。
|
|
|
|
入场条件严格要求所有指标一致确认,这大大提高了交易信号的可靠性。例如,做多要求价格突破AVWAP、位于EMA之上、RSI高于超卖水平、MACD确认上涨动量,且成交量充足。退出策略则采用ATR倍数计算的止损和追踪止损,使风险管理能够适应不同的市场波动环境。
|
|
|
|
#### 策略优势
|
|
该策略具有多方面的优势:
|
|
|
|
1. **多维度分析**:结合价格、成交量和动量指标进行全方位分析,形成更全面的市场视角,减少单一指标可能带来的错误信号。
|
|
|
|
2. **自适应性强**:ATR基础的止损和追踪止损机制能够根据市场波动性自动调整,使策略在不同市场环境中都能保持适当的风险管理。
|
|
|
|
3. **趋势与成交量结合**:AVWAP和FRVP提供了基于成交量的价格支撑与阻力水平,比单纯的价格分析更具说服力,因为它们反映了真实的市场参与度。
|
|
|
|
4. **严格的入场条件**:多重确认机制显著减少了虚假信号,提高了交易胜率,虽然可能减少交易频率,但质量得到保证。
|
|
|
|
5. **动态风险管理**:基于ATR的止损策略可以根据市场波动性自动调整止损距离,使风险控制更加精确和合理。
|
|
|
|
6. **过滤低成交量交易**:避免在低流动性环境中交易,减少滑点和假突破的风险。
|
|
|
|
7. **视觉反馈**:策略通过标签功能在图表上直观显示交易信号,帮助交易者更好地理解和评估系统表现。
|
|
|
|
#### 策略风险
|
|
尽管该策略设计全面,但仍存在一些潜在风险:
|
|
|
|
1. **参数敏感性**:多个指标和参数的组合可能导致过度优化风险。不同市场和时间框架可能需要不同的参数设置,需要进行充分的回测和验证。
|
|
|
|
2. **横盘市场表现**:在无明显趋势的横盘市场中,策略可能产生过多的假突破信号,导致连续亏损。可以考虑添加波动率过滤器,在低波动率环境中暂停交易。
|
|
|
|
3. **滞后性问题**:EMA和其他指标本质上具有滞后性,可能导致入场时机略晚,错过部分利润。可以考虑使用更快速的指标或调整现有指标参数来减轻这一问题。
|
|
|
|
4. **止损跳空风险**:在快速市场或隔夜跳空情况下,ATR基础的止损可能无法完全保护资金。建议设置最大损失限制或使用期权保护策略。
|
|
|
|
5. **过度依赖技术指标**:策略完全基于技术分析,忽略了基本面和市场情绪等因素。可以考虑整合市场情绪指标或基本面过滤器以获得更全面的市场视角。
|
|
|
|
6. **频繁交易成本**:如果参数设置不当,可能导致频繁交易,增加交易成本。应通过回测优化参数,找到交易频率与盈利能力之间的平衡点。
|
|
|
|
#### 策略优化方向
|
|
基于代码分析,该策略可以从以下几个方向进行优化:
|
|
|
|
1. **动态参数自适应**:可以实现RSI、EMA等参数的动态调整,根据市场波动性自动优化参数,使策略更具适应性。例如,在高波动性市场中使用较长的RSI周期,在低波动性市场中使用较短的周期。
|
|
|
|
2. **添加市场情绪指标**:整合VIX或其他市场情绪指标,在极端恐慌或贪婪时期调整策略行为,避免在市场极端情况下交易。
|
|
|
|
3. **时间过滤器**:添加时间过滤功能,避开市场开盘和收盘前的高波动时段,或者专注于特定的交易时段以提高胜率。
|
|
|
|
4. **多时间框架分析**:整合更高时间框架的确认信号,确保交易方向与更大趋势一致,减少逆势交易风险。
|
|
|
|
5. **改进盈利目标设置**:目前的代码中未明确定义盈利目标,主要依靠追踪止损锁定利润。可以基于关键阻力/支撑位、风险回报比或价格波动范围设置智能盈利目标。
|
|
|
|
6. **优化成交量分析**:可以进一步细化成交量分析,比如使用相对成交量变化率而非简单的均值比较,更精确地判断成交量异常。
|
|
|
|
7. **添加策略暂停机制**:在连续损失或特定市场条件下自动暂停交易,保护资金免受系统性风险影响,待条件恢复后再重新开始交易。
|
|
|
|
8. **资金管理优化**:目前策略使用固定百分比(10%)的资金管理方式,可以考虑实现基于波动率的头寸规模调整,在低波动期增加头寸,高波动期减少头寸。
|
|
|
|
#### 总结
|
|
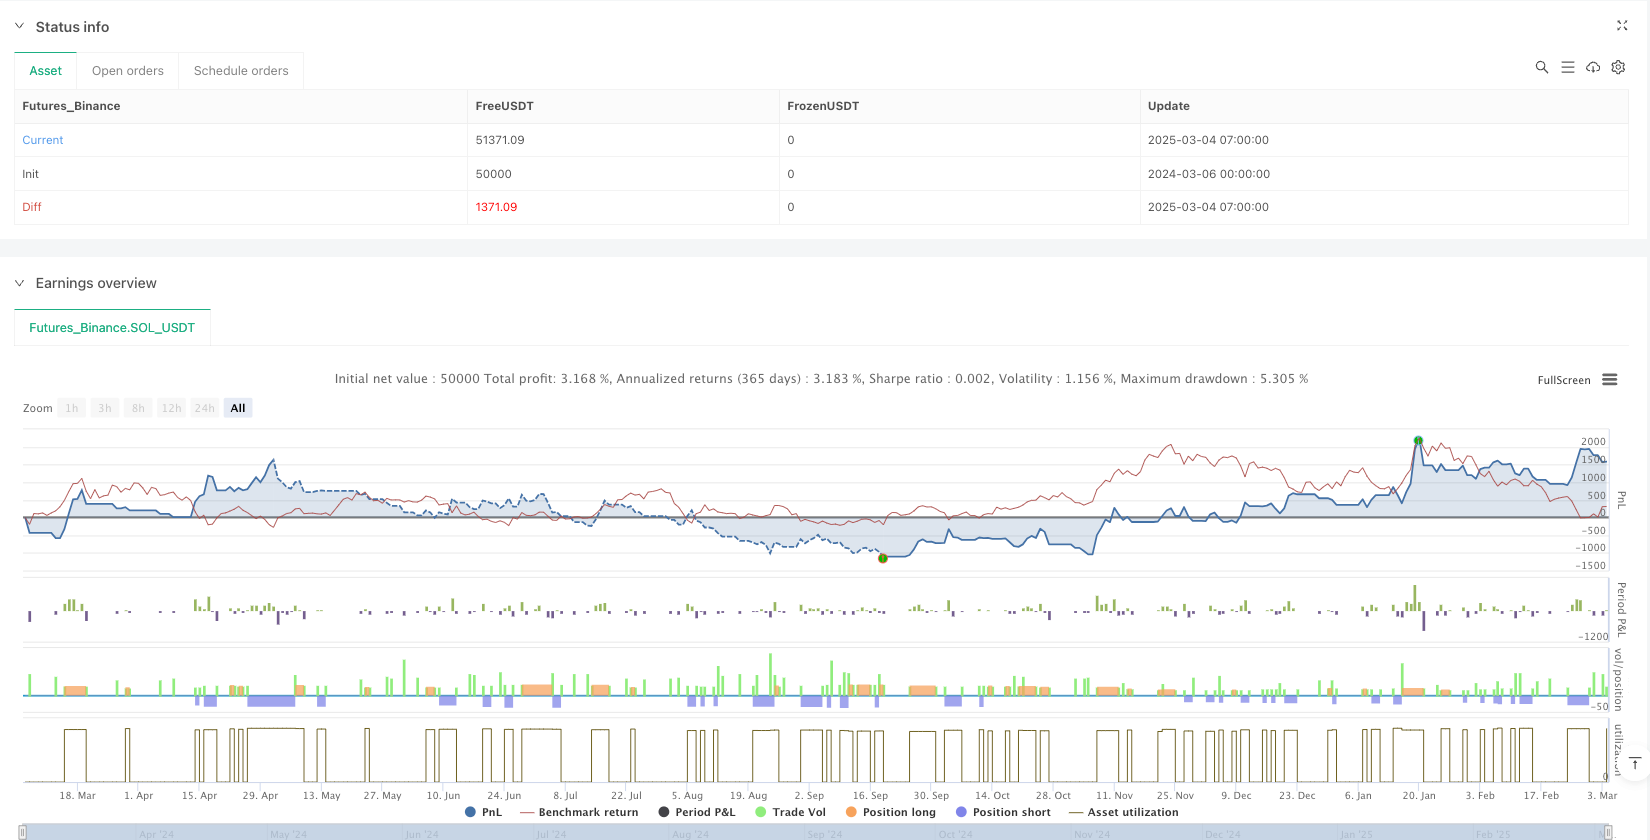
固定范围成交量分布与锚定加权成交量平均价结合的趋势判断与动态止损策略是一个设计精良的量化交易系统,它通过整合多种技术分析工具和指标,形成了一个全面且自适应的交易框架。策略的核心优势在于结合了基于成交量的价格分析(FRVP和AVWAP)与传统的趋势和动量指标(EMA、RSI、MACD),并辅以灵活的风险管理机制,使其能够在不同市场环境中保持稳定表现。
|
|
|
|
虽然存在参数敏感性、横盘市场表现不佳等潜在风险,但通过建议的优化方向,如动态参数自适应、多时间框架分析和改进的资金管理,这些问题大多可以得到有效缓解。特别是添加市场情绪指标和策略暂停机制的建议,有望进一步提高系统的稳健性和长期盈利能力。
|
|
|
|
对于寻求综合性交易策略的量化交易者而言,这个系统提供了一个坚实的基础,可以根据个人风险偏好和交易品种特性进行进一步定制和优化。通过严格的回测和逐步改进,该策略有潜力成为一个长期有效的交易工具。 || #### Overview
|
|
The Fixed Range Volume Profile And Anchored VWAP Trend Identification Strategy With Dynamic Stop-Loss is a comprehensive trading system that cleverly combines Fixed Range Volume Profile (FRVP) and Anchored Volume Weighted Average Price (AVWAP) with multiple momentum indicators including RSI, EMA, and MACD, along with ATR-based dynamic stop-loss management. This strategy aims to capture price trends while improving trade quality through multiple filtering conditions to reduce false signals. The system employs a combination of volume analysis and trend following methods, providing traders with a comprehensive and adaptive trading framework that is particularly suitable for markets with clear trending conditions.
|
|
|
|
#### Strategy Principles
|
|
The core principle of this strategy is to analyze market structure and momentum through multiple dimensions, combining volume and price behavior to make trading decisions. Specifically:
|
|
|
|
1. **Anchored Volume Weighted Average Price (AVWAP)**: Acts as a dynamic support/resistance level by calculating the average price weighted by volume, providing important reference points for price breakouts. When price breaks through the AVWAP, it may indicate that a trend direction has been established.
|
|
|
|
2. **Fixed Range Volume Profile (FRVP)**: Analyzes the highest and lowest prices within a specified period to calculate a midpoint price (frvpMid), helping to identify changes in market structure and key price levels.
|
|
|
|
3. **Exponential Moving Average (EMA)**: The 200-period EMA serves as a trend filter to prevent counter-trend trades. Long positions are only considered when price is above the EMA, and vice versa.
|
|
|
|
4. **Relative Strength Index (RSI)**: Avoids trading in overbought/oversold areas, providing additional confirmation for entries. For long positions, RSI must be above the oversold level; for short positions, RSI must be below the overbought level.
|
|
|
|
5. **MACD Confirmation**: Ensures that momentum direction aligns with trade direction, improving signal quality.
|
|
|
|
6. **Volume Filter**: Trades only when volume is above its 20-period average, avoiding false breakouts in low-liquidity environments.
|
|
|
|
7. **ATR-Based Stop-Loss and Trailing Stop**: Dynamically adjusts stop-loss positions based on market volatility, protecting capital while allowing sufficient price movement.
|
|
|
|
Entry conditions strictly require confirmation from all indicators, greatly improving the reliability of trading signals. For example, a long position requires price to break above AVWAP, be above the EMA, RSI above oversold level, MACD confirming upward momentum, and sufficient volume. The exit strategy employs stop-loss and trailing stop calculated as ATR multiples, allowing risk management to adapt to different market volatility environments.
|
|
|
|
#### Strategy Advantages
|
|
This strategy has multiple advantages:
|
|
|
|
1. **Multi-dimensional Analysis**: Combines price, volume, and momentum indicators for a comprehensive analysis, forming a more complete market perspective and reducing false signals that might come from using a single indicator.
|
|
|
|
2. **Strong Adaptability**: ATR-based stop-loss and trailing stop mechanisms automatically adjust according to market volatility, maintaining appropriate risk management in different market environments.
|
|
|
|
3. **Trend and Volume Combination**: AVWAP and FRVP provide volume-based support and resistance levels that are more convincing than pure price analysis, as they reflect actual market participation.
|
|
|
|
4. **Strict Entry Conditions**: Multiple confirmation mechanisms significantly reduce false signals and improve win rates. While this may reduce trading frequency, it ensures quality.
|
|
|
|
5. **Dynamic Risk Management**: ATR-based stop-loss strategy automatically adjusts stop distances based on market volatility, making risk control more precise and reasonable.
|
|
|
|
6. **Low Volume Trade Filtering**: Avoids trading in low liquidity environments, reducing the risk of slippage and false breakouts.
|
|
|
|
7. **Visual Feedback**: The strategy uses label functionality to visually display trading signals on the chart, helping traders better understand and evaluate system performance.
|
|
|
|
#### Strategy Risks
|
|
Despite its comprehensive design, the strategy still has some potential risks:
|
|
|
|
1. **Parameter Sensitivity**: The combination of multiple indicators and parameters may lead to over-optimization risk. Different markets and timeframes may require different parameter settings, necessitating thorough backtesting and validation.
|
|
|
|
2. **Ranging Market Performance**: In ranging markets without clear trends, the strategy may produce too many false breakout signals, leading to consecutive losses. Consider adding a volatility filter to pause trading in low-volatility environments.
|
|
|
|
3. **Lag Issues**: EMA and other indicators inherently have lag, which may lead to slightly delayed entries, missing part of the profit. Consider using faster indicators or adjusting existing indicator parameters to mitigate this issue.
|
|
|
|
4. **Gap Risk for Stop-Loss**: In fast markets or overnight gaps, ATR-based stops may not fully protect capital. Consider setting maximum loss limits or using options protection strategies.
|
|
|
|
5. **Over-reliance on Technical Indicators**: The strategy is completely based on technical analysis, ignoring factors such as fundamentals and market sentiment. Consider integrating market sentiment indicators or fundamental filters for a more comprehensive market view.
|
|
|
|
6. **Frequent Trading Costs**: Improper parameter settings may lead to frequent trading, increasing costs. Parameters should be optimized through backtesting to find the balance between trading frequency and profitability.
|
|
|
|
#### Strategy Optimization Directions
|
|
Based on code analysis, this strategy can be optimized in the following directions:
|
|
|
|
1. **Dynamic Parameter Adaptation**: Implement dynamic adjustment of parameters such as RSI and EMA based on market volatility, automatically optimizing parameters to make the strategy more adaptive. For example, use longer RSI periods in high-volatility markets and shorter periods in low-volatility markets.
|
|
|
|
2. **Add Market Sentiment Indicators**: Integrate VIX or other market sentiment indicators to adjust strategy behavior during periods of extreme fear or greed, avoiding trading in extreme market conditions.
|
|
|
|
3. **Time Filters**: Add time filtering functionality to avoid high-volatility periods around market open and close, or focus on specific trading sessions to improve win rates.
|
|
|
|
4. **Multi-timeframe Analysis**: Integrate confirmation signals from higher timeframes to ensure that trade direction aligns with larger trends, reducing the risk of counter-trend trading.
|
|
|
|
5. **Improved Profit Target Setting**: The current code does not explicitly define profit targets, mainly relying on trailing stops to lock in profits. Consider setting intelligent profit targets based on key resistance/support levels, risk-reward ratios, or price range.
|
|
|
|
6. **Optimize Volume Analysis**: Further refine volume analysis, such as using relative volume change rates rather than simple mean comparisons, to more accurately identify volume anomalies.
|
|
|
|
7. **Add Strategy Pause Mechanism**: Automatically pause trading after consecutive losses or under specific market conditions to protect capital from systemic risks, resuming trading when conditions improve.
|
|
|
|
8. **Optimize Money Management**: Currently, the strategy uses a fixed percentage (10%) for position sizing. Consider implementing volatility-based position sizing, increasing positions during low volatility and decreasing during high volatility.
|
|
|
|
#### Summary
|
|
The Fixed Range Volume Profile And Anchored VWAP Trend Identification Strategy With Dynamic Stop-Loss is a well-designed quantitative trading system that forms a comprehensive and adaptive trading framework by integrating multiple technical analysis tools and indicators. The core advantage of the strategy lies in combining volume-based price analysis (FRVP and AVWAP) with traditional trend and momentum indicators (EMA, RSI, MACD), supplemented by flexible risk management mechanisms, enabling it to maintain stable performance in different market environments.
|
|
|
|
While there are potential risks such as parameter sensitivity and poor performance in ranging markets, most of these issues can be effectively mitigated through the suggested optimization directions, including dynamic parameter adaptation, multi-timeframe analysis, and improved money management. In particular, the suggestions to add market sentiment indicators and a strategy pause mechanism are likely to further enhance the system's robustness and long-term profitability.
|
|
|
|
For quantitative traders seeking a comprehensive trading strategy, this system provides a solid foundation that can be further customized and optimized according to individual risk preferences and instrument characteristics. Through rigorous backtesting and gradual improvement, this strategy has the potential to become an effective long-term trading tool.[/trans]
|
|
|
|
|
|
|
|
> Source (PineScript)
|
|
|
|
``` pinescript
|
|
/*backtest
|
|
start: 2024-03-06 00:00:00
|
|
end: 2025-03-04 08:00:00
|
|
period: 1h
|
|
basePeriod: 1h
|
|
exchanges: [{"eid":"Futures_Binance","currency":"SOL_USDT"}]
|
|
*/
|
|
|
|
//@version=5
|
|
strategy("FRVP + AVWAP Improved By NgashCT", overlay=true, default_qty_type=strategy.percent_of_equity, default_qty_value=10)
|
|
|
|
// Inputs
|
|
length = input(50, title="AVWAP Length")
|
|
frvpLength = input(100, title="FRVP Length")
|
|
rsiLength = input(14, title="RSI Length")
|
|
rsiOverbought = input(70, title="RSI Overbought")
|
|
rsiOversold = input(30, title="RSI Oversold")
|
|
emaLength = input(200, title="EMA Length")
|
|
atrMultiplier = input(1.5, title="ATR Multiplier for Stop Loss")
|
|
trailStopMultiplier = input(2, title="ATR Multiplier for Trailing Stop")
|
|
|
|
// Indicators
|
|
avwap = ta.vwap(close)
|
|
ema = ta.ema(close, emaLength)
|
|
rsi = ta.rsi(close, rsiLength)
|
|
macdLine = ta.ema(close, 12) - ta.ema(close, 26)
|
|
signalLine = ta.ema(macdLine, 9)
|
|
atr = ta.atr(14)
|
|
|
|
// Volume Profile
|
|
highestHigh = ta.highest(high, frvpLength)
|
|
lowestLow = ta.lowest(low, frvpLength)
|
|
frvpMid = (highestHigh + lowestLow) / 2
|
|
|
|
// Entry Conditions
|
|
longCondition = ta.crossover(close, avwap) and close > ema and rsi > rsiOversold and macdLine > signalLine
|
|
shortCondition = ta.crossunder(close, avwap) and close < ema and rsi < rsiOverbought and macdLine < signalLine
|
|
|
|
// Volume Filter (Trade only when volume is above its moving average)
|
|
avgVolume = ta.sma(volume, 20)
|
|
volumeFilter = volume > avgVolume
|
|
|
|
longCondition := longCondition and volumeFilter
|
|
shortCondition := shortCondition and volumeFilter
|
|
|
|
// Debugging Prints
|
|
labelLong = longCondition ? "Long Signal" : ""
|
|
labelShort = shortCondition ? "Short Signal" : ""
|
|
label.new(bar_index, high, labelLong, color=color.green, textcolor=color.white)
|
|
label.new(bar_index, low, labelShort, color=color.red, textcolor=color.white)
|
|
|
|
// Strategy Orders
|
|
if longCondition
|
|
strategy.entry("Long", strategy.long)
|
|
strategy.exit("Exit Long", from_entry="Long", stop=close - atr * atrMultiplier, trail_points=atr * trailStopMultiplier)
|
|
|
|
if shortCondition
|
|
strategy.entry("Short", strategy.short)
|
|
strategy.exit("Exit Short", from_entry="Short", stop=close + atr * atrMultiplier, trail_points=atr * trailStopMultiplier)
|
|
|
|
```
|
|
|
|
> Detail
|
|
|
|
https://www.fmz.com/strategy/485128
|
|
|
|
> Last Modified
|
|
|
|
2025-03-06 11:14:10
|