
240 lines
11 KiB
Markdown
240 lines
11 KiB
Markdown
|
|
> Name
|
|
|
|
固定止盈止损出场的量化交易策略The-Quantitative-Trading-Strategy-Based-on-Dynamic-Moving-Average-Breakthrough-Entry
|
|
|
|
> Author
|
|
|
|
ChaoZhang
|
|
|
|
> Strategy Description
|
|
|
|
|
|
[trans]
|
|
## 概述
|
|
|
|
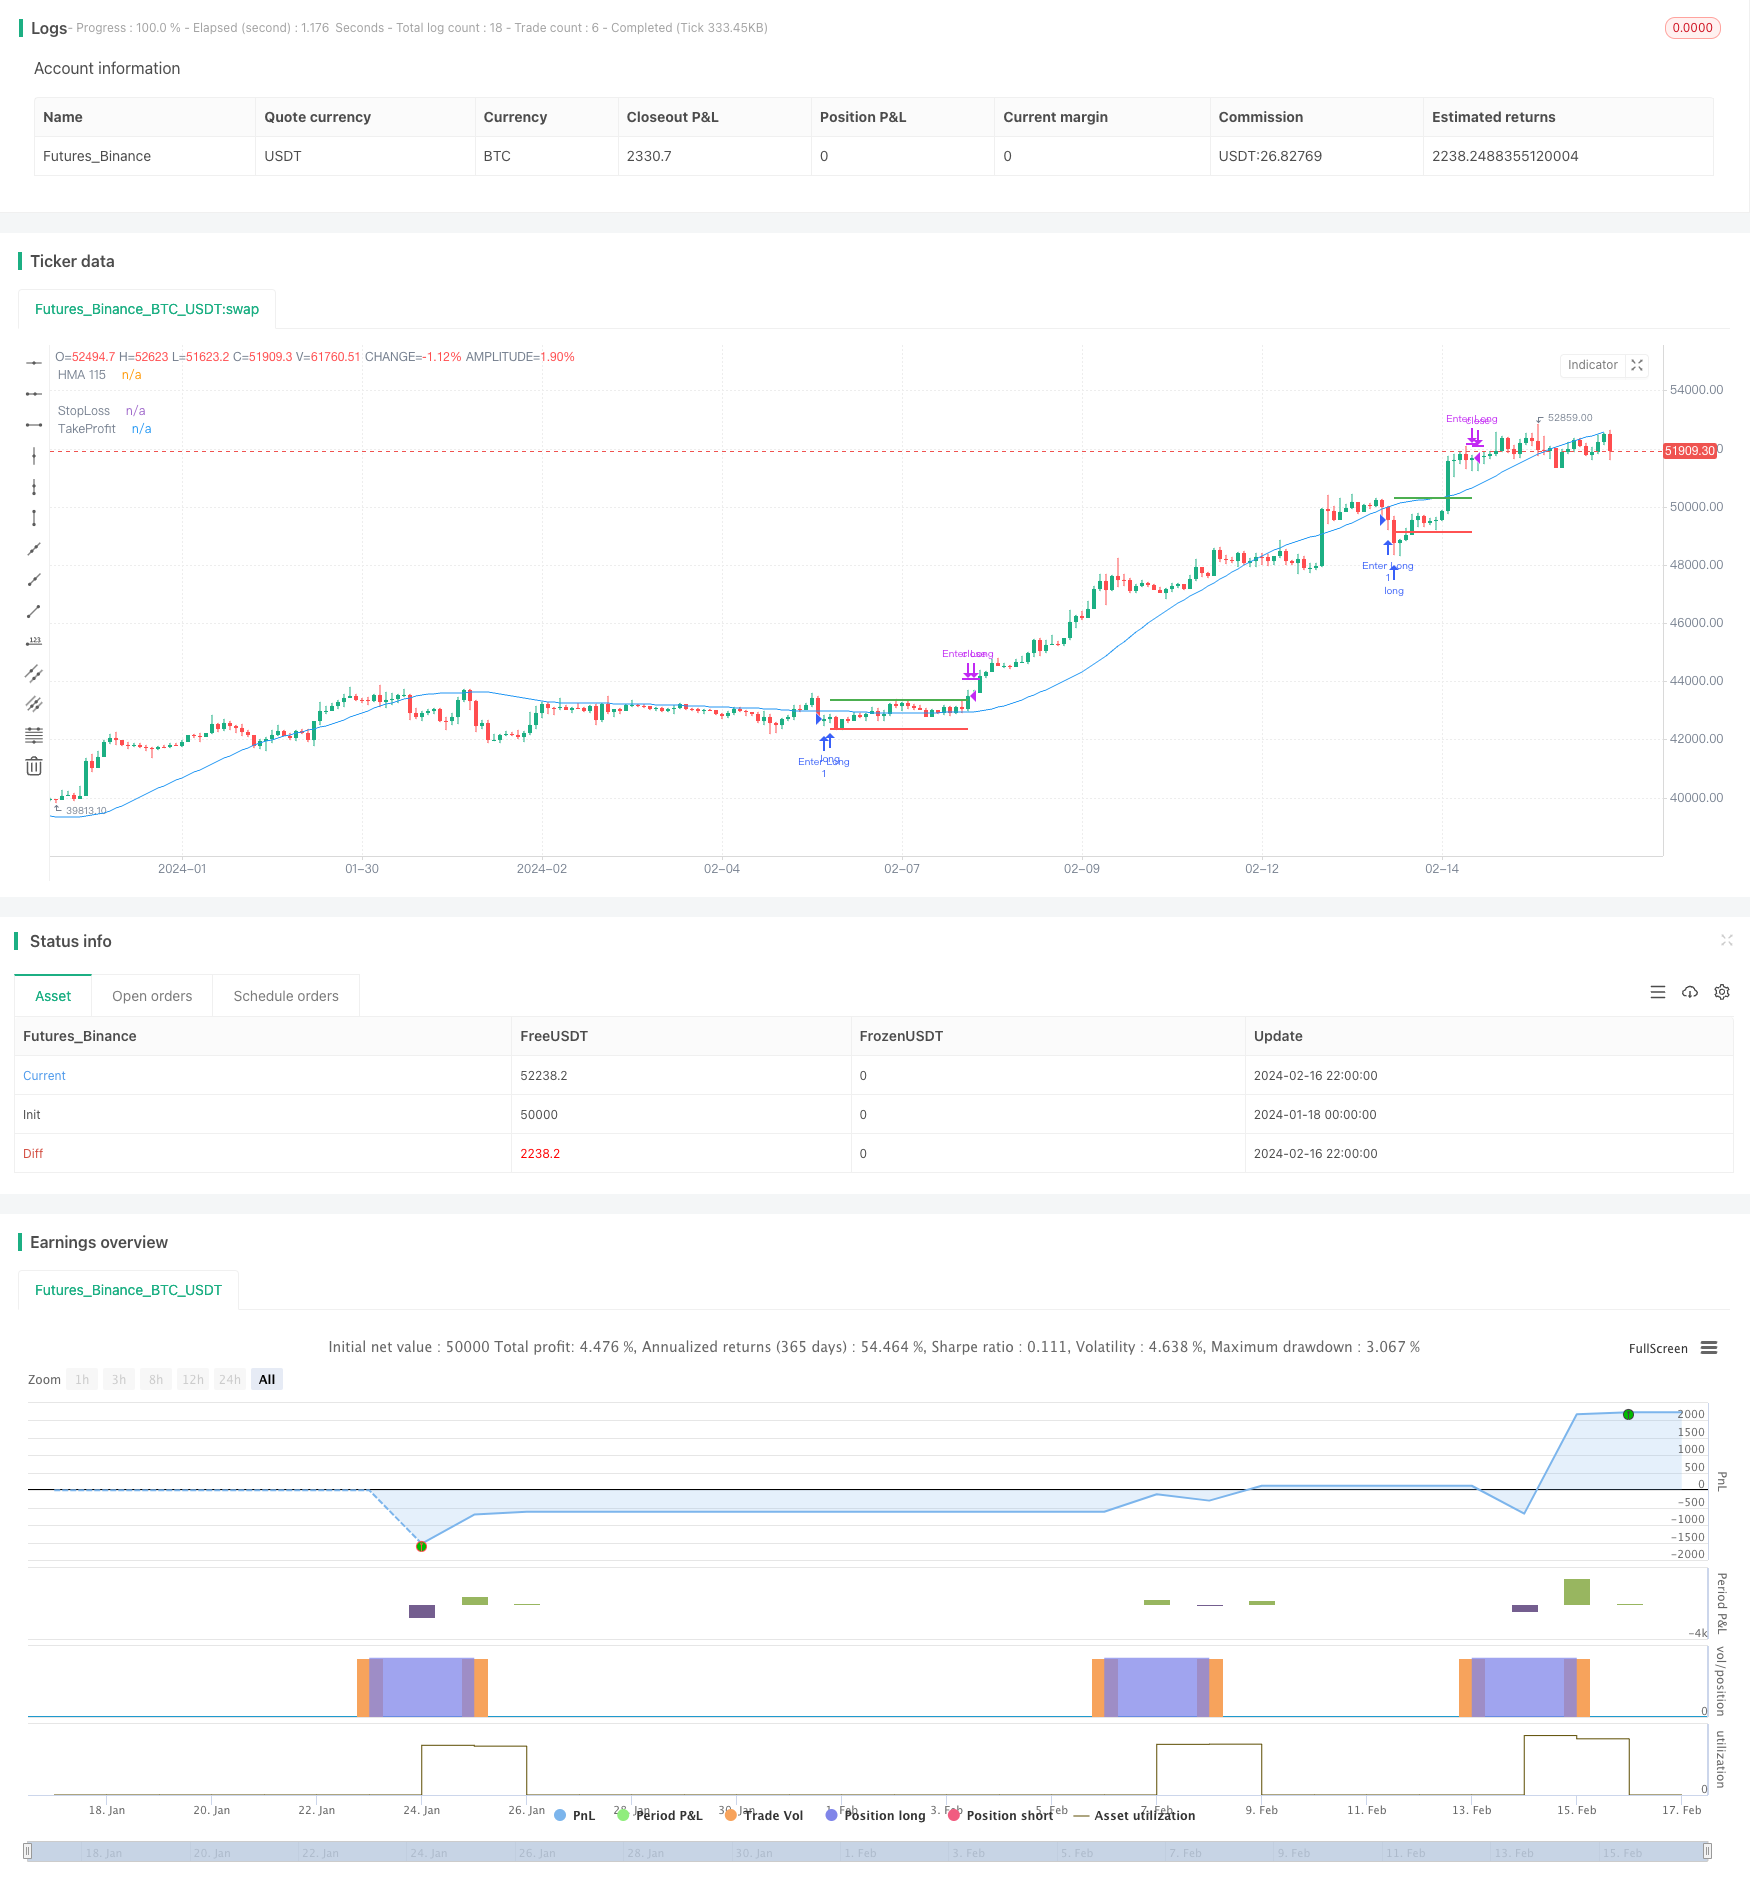
本策略名称为“动态移动平均线突破入场、固定止盈止损出场的量化交易策略”。该策略的主要思想是在每周一当日的交易时段,如果收盘价低于115周期的 Hull 动态移动平均线,那么进行长仓入场操作;在其后的每周三当日的交易时段,无条件进行平仓出场操作,同时设置固定的止盈止损点。
|
|
|
|
## 策略原理
|
|
|
|
该策略主要基于Hull移动平均线的指标信号和周期性的交易规则进行设计。
|
|
|
|
首先,在每周一的交易时段,判断收盘价是否低于115周期的Hull移动平均线,如果满足条件,进行长仓入场操作。Hull移动平均线相比普通移动平均线,能更快地响应价格变化,对趋势的识别更加敏感,因此该指标信号可以提高入场时机的准确性。
|
|
|
|
其次,无条件地在每周三的交易时段进行平仓出场。通过这种周期性的操作方式,可以避免被突发事件影响,降低回撤的概率。同时设置了固定比例的止盈止损点,以控制每次交易的风险和收益。
|
|
|
|
最后,由于每次交易持仓的时间跨度较短,交易频次较高,这可以在一定程度上调整仓位,降低单笔交易的风险。
|
|
|
|
## 优势分析
|
|
|
|
本策略具有以下几个优势:
|
|
|
|
1. 使用Hull移动平均线作为入场信号指标,可以提高入场时机选择的准确性,捕捉趋势机会。
|
|
|
|
2. 采用周期性的出场方式,可以规避非理性行为带来的风险,降低回撤概率。
|
|
|
|
3. 设置固定的止盈止损点,可以很好控制单笔交易的风险收益比。
|
|
|
|
4. 交易频次较高,有利于调整仓位,降低单笔交易的风险。
|
|
|
|
5. 策略规则简单清晰,容易理解与实现,适合量化交易的算法化。
|
|
|
|
|
|
## 风险分析
|
|
|
|
本策略也存在一些风险,主要包括:
|
|
|
|
1. 市场可能出现长时间盘整,导致入场后被套牢的概率较大。
|
|
|
|
2. 固定的止盈止损点设置不够灵活,可能出现止损过早或止盈过晚的情况。
|
|
|
|
3. 若出现重大且突发的行情事件,周期性的出场方式可能带来较大的亏损。
|
|
|
|
4. 频繁交易会增加交易成本和滑点的影响。
|
|
|
|
5. 参数设置(如计算周期长度等)不当可能影响策略表现。
|
|
|
|
|
|
为了降低上述风险,可以考虑以下几点优化措施:
|
|
|
|
1. 在入场前判断市场格局,避免在盘整时入场。
|
|
|
|
2. 设置动态滑动止盈止损或考虑事先设定多个固定止盈止损点。
|
|
|
|
3. 在重大事件前后暂停交易,避开行情剧烈波动的时段。
|
|
|
|
4. 适当减少交易频次,降低交易成本和滑点的影响。
|
|
|
|
5. 优化参数设置,进行稳健性检验,使策略更加稳定。
|
|
|
|
## 优化方向
|
|
|
|
本策略还有进一步优化的空间,主要包括以下几个方面:
|
|
|
|
1. 使用机器学习等方法动态优化移动平均线的参数,使指标信号更加准确。
|
|
|
|
2. 尝试结合多个指标进行组合,设计更加复杂的入场和出场规则。
|
|
|
|
3. 根据不同时间段和市场环境设计自适应的止盈止损机制。
|
|
|
|
4. 融入风险管理模型,实现更好的资金管理。
|
|
|
|
5. 设计断点复权模块,使策略能顺利完成股票拆股等重要事件。
|
|
|
|
6. 添加实盘验证模块,检验策略在实盘中的表现。
|
|
|
|
|
|
通过机器学习、指标组合、自适应止盈止损、风险管理等方式的融合与优化,本策略可以获得更强的稳定性与收益性。同时加入实盘验证机制是进一步完善策略的重要手段。这些都是本策略未来可以优化的主要方向。
|
|
|
|
## 总结
|
|
|
|
本策略基于 Hull 动态移动平均线指标信号入场以及固定周期出场的思路进行设计,具有指标信号准确、回撤概率低等优势,同时控制了单笔交易的止盈止损。但本策略也存在被套、止盈止损设置不合理等问题。未来的优化方向包括引入机器学习和更复杂的多指标组合入场,设计自适应的止盈止损机制,加入断点复权和实盘验证模块等。通过这些措施的综合运用,本策略的稳定性和盈利能力都将得到提升。
|
|
|
|
||
|
|
|
|
## Overview
|
|
|
|
The name of this strategy is "The Quantitative Trading Strategy Based on Dynamic Moving Average Breakthrough Entry and Fixed Profit-taking/Stop-loss Exit". The main idea of this strategy is to open long positions when the closing price is below the 115-period Hull Dynamic Moving Average on every Monday, and unconditionally close positions on every Wednesday afterwards, with fixed ratios of profit-target and stop-loss set simultaneously.
|
|
|
|
## Principles
|
|
|
|
This strategy is mainly designed based on the indicator signals of Hull Moving Average and periodic trading rules.
|
|
|
|
Firstly, during the trading session on every Monday, long positions will be opened if the closing price is below the 115-period Hull Moving Average. Compared to common moving averages, Hull Moving Average responds faster to price changes and identifies trends more sensitively. Therefore, the indicator signals can improve the accuracy of market entry.
|
|
|
|
Secondly, positions will be closed unconditionally during the trading sessions on every Wednesday. This periodic operation approach can avoid being impacted by contingent events and reduce the probability of drawdowns. Meanwhile, fixed ratios of stop-loss and profit-target are set to control the risk and reward of every trade.
|
|
|
|
Finally, as each trade holding period is relatively short with higher trading frequency, it can adjust positions to some extent and decrease single trade risk.
|
|
|
|
## Advantage Analysis
|
|
|
|
This strategy has the following advantages:
|
|
|
|
1. Using Hull Moving Average as the entry signal indicator improves the accuracy of timing market entry and captures trend opportunities.
|
|
|
|
2. The periodic exit method can avoid risks from irrational behaviors and reduce drawdown probability.
|
|
|
|
3. The fixed profit-target and stop-loss points can control risk-reward ratio of each trade effectively.
|
|
|
|
4. High trading frequency is beneficial to adjust positions and decrease single trade risk.
|
|
|
|
5. The trading rules are simple and easy to understand and implement, which is suitable for algorithmic quantitative trading.
|
|
|
|
## Risk Analysis
|
|
|
|
This strategy also has some risks:
|
|
|
|
1. Prolonged consolidation in the market may lead to higher probability of being trapped after entry.
|
|
|
|
2. The fixed profit-target and stop-loss points lack flexibility and may exit position too early or too late.
|
|
|
|
3. Periodic exit may lead to huge losses if contingent events happen.
|
|
|
|
4. Frequent trading increases cost and slippage influence.
|
|
|
|
5. Improper parameter settings (like period numbers) may affect strategy performance.
|
|
|
|
Some optimization measures can be considered to reduce the above risks:
|
|
|
|
1. Judge market condition before entry to avoid entering consolidation phases.
|
|
|
|
2. Set dynamic or multiple fixed ratios for profit-taking and stop-loss.
|
|
|
|
3. Suspend trading around significant events to avoid extreme volatility.
|
|
|
|
4. Lower trading frequency appropriately to reduce cost and slippage.
|
|
|
|
5. Optimize parameter settings and do robustness test to make the strategy more stable.
|
|
|
|
## Optimization Directions
|
|
|
|
This strategy can be further optimized in the following aspects:
|
|
|
|
1. Use machine learning models to optimize parameters of moving average dynamically for more accurate signals.
|
|
|
|
2. Try combining multiple indicators to design more complex entry and exit rules.
|
|
|
|
3. Design adaptive profit-taking and stop-loss mechanisms according to different periods and market environments.
|
|
|
|
4. Incorporate risk management models for better capital management.
|
|
|
|
5. Design rights adjustment module to handle events like stock splits smoothly.
|
|
|
|
6. Add real trading verification module to test strategy's performance in live markets.
|
|
|
|
By organically combining machine learning, indicator portfolio, adaptive profit-taking/stop-loss, risk management and other methods, this strategy can achieve stronger stability and profitability. Meanwhile, adding real trading verification mechanisms is also important for further perfecting the strategy. These are the main optimization directions for this strategy.
|
|
|
|
|
|
## Conclusion
|
|
|
|
This strategy is designed based on the ideas of Hull Dynamic Moving Average indicator signal entry and fixed cycle exit. It has advantages like accurate signals and low drawdown probability, while controlling single trade's profit-taking and stop-loss. But problems like being trapped and improper profit-taking/stop-loss settings also exist. Future optimization directions include introducing machine learning and more complex multi-indicator combinations for entry, designing adaptive profit-taking/stop-loss mechanisms, adding rights adjustment and real trading verification modules, etc. By comprehensively adopting these measures, the stability and profitability of this strategy will be enhanced.
|
|
|
|
[/trans]
|
|
|
|
> Strategy Arguments
|
|
|
|
|
|
|
|
|Argument|Default|Description|
|
|
|----|----|----|
|
|
|v_input_float_1|0.8|StopLoss %|
|
|
|v_input_float_2|1.5|Take Profit %|
|
|
|
|
|
|
> Source (PineScript)
|
|
|
|
``` pinescript
|
|
/*backtest
|
|
start: 2024-01-18 00:00:00
|
|
end: 2024-02-17 00:00:00
|
|
period: 2h
|
|
basePeriod: 15m
|
|
exchanges: [{"eid":"Futures_Binance","currency":"BTC_USDT"}]
|
|
*/
|
|
|
|
// This Pine Script™ code is subject to the terms of the Mozilla Public License 2.0 at https://mozilla.org/MPL/2.0/
|
|
// © gnatskiller
|
|
|
|
//@version=5
|
|
strategy("Strategia HMA + LUN/MER", overlay=true)
|
|
|
|
// Inputs: stoploss %, takeProfit %
|
|
stopLossPercentage = input.float(defval=0.8, title='StopLoss %', minval=0.1, step=0.2) / 100
|
|
takeProfit = input.float(defval=1.5, title='Take Profit %', minval=0.3, step=0.2) / 100
|
|
|
|
// Calculate HMA 115
|
|
hma115 = ta.hma(close, 115)
|
|
|
|
// Exit and Entry Conditions - Check current day, session time, and price below HMA 115
|
|
isLong = dayofweek == dayofweek.monday and not na(time(timeframe.period, "1000-1101")) and close < hma115
|
|
isExit = dayofweek == dayofweek.wednesday and not na(time(timeframe.period, "1000-1101"))
|
|
|
|
// Calculate Stoploss and Take Profit values
|
|
SL = strategy.position_avg_price * (1 - stopLossPercentage)
|
|
TP = strategy.position_avg_price * (1 + takeProfit)
|
|
|
|
// Strategy Enter, and exit when conditions are met
|
|
if isLong
|
|
strategy.entry("Enter Long", strategy.long)
|
|
if strategy.position_size > 0
|
|
if isExit
|
|
strategy.close("Enter Long", comment="Exit")
|
|
strategy.exit("Exit", "Exit", stop=SL, limit=TP)
|
|
|
|
// Plot Stoploss and TakeProfit lines
|
|
plot(strategy.position_size > 0 ? SL : na, style=plot.style_linebr, color=color.red, linewidth=2, title="StopLoss")
|
|
plot(strategy.position_size > 0 ? TP : na, style=plot.style_linebr, color=color.green, linewidth=2, title="TakeProfit")
|
|
|
|
// Plot HMA 115
|
|
plot(hma115, color=color.blue, title="HMA 115")
|
|
|
|
```
|
|
|
|
> Detail
|
|
|
|
https://www.fmz.com/strategy/441955
|
|
|
|
> Last Modified
|
|
|
|
2024-02-18 09:53:48
|