
9.5 KiB
Name
四重指标均线回转策略Four-Indicator-Momentum-Reversal-Strategy
Author
ChaoZhang
Strategy Description
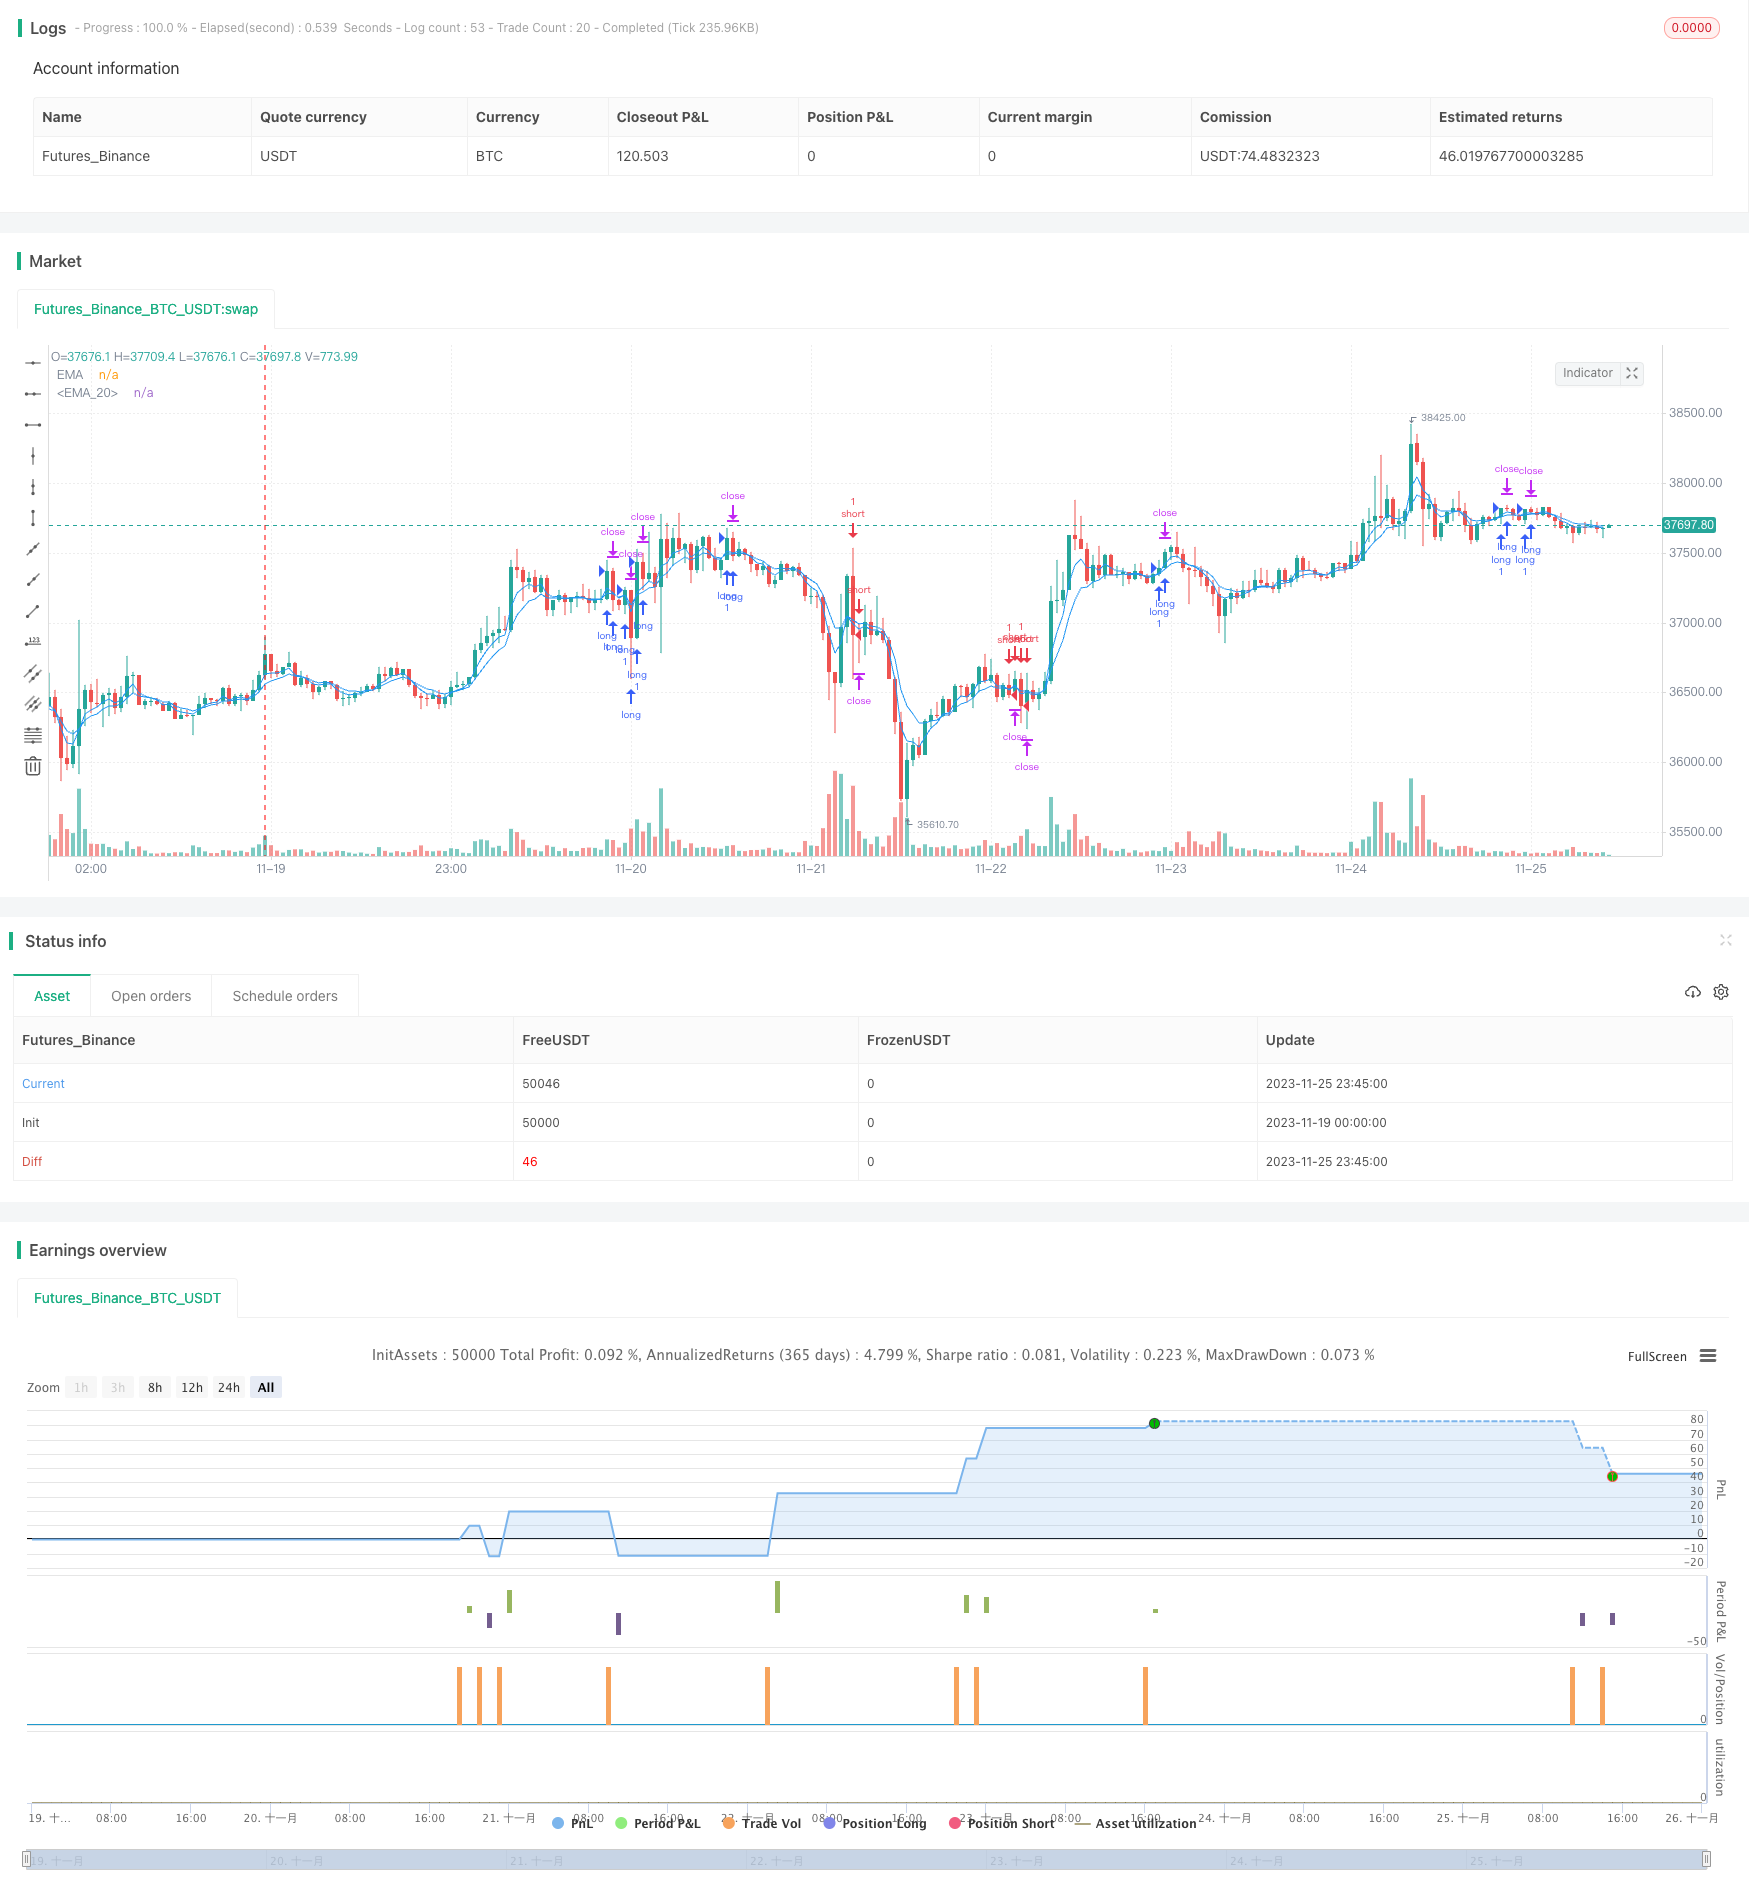 [trans]
概述
该策略利用了移动平均线EMA、相对强弱指标RSI、商品信道指标CCI三大主流指标结合,通过EMA均线是否回转识别价格趋势,然后使用过买过卖的RSI和CCI指标进行辅助判断,形成交易信号。属于中间期交易策略。
策略原理
-
用4周期和8周期的EMA均线交叉来判断价格趋势,4周期快速判断,8周期慢速确定;
-
EMA均线向上回转时,即4周期线上穿8周期线,再辅助判断RSI指标高于65(相对超买区)和CCI指标高于0(代表没有超买超卖),满足则产生做多信号;
-
EMA均线向下回转时,即4周期线下穿8周期线,再辅助判断RSI指标低于35(相对超卖区)和CCI指标低于0(代表没有超买超卖),满足则产生做空信号;
-
形成信号后,根据输入的止损距离和止盈距离来设置止损和止盈价格。
总体来说,该策略综合考量了中短期价格趋势和短期指标超买超卖区间避让,比较稳定,同时止损止盈设置也会有效控制单次交易的最大损失。
优势分析
-
多指标综合判断,避免误判概率较大的单一指标交易策略;
-
EMA均线判断主趋势,避免被短期波动误导判断;RSI和CCI指标避让超买超卖区,增加胜率;
-
自动设置止损和止盈控制单笔交易风险,有效防止极端行情导致亏损扩大;
-
该策略属于技术面交易策略,不受基本面影响,市场任何단位周期都可以使用,易于实盘。
风险分析
-
突发重大利空/利好消息面前技术指标容易失效;
-
股价剧烈波动时,止损可能被突破,应适当放宽止损幅度;
-
该策略属于短线频繁交易策略,交易成本会对盈利造成一定影响,适合具有成本优势的高频策略。
优化方向
-
增加机器学习算法,结合股票基本面情况自动调整参数;
-
增加自适应止损机制,而不是固定的止损距离。
总结
该交易策略综合多个指标判断,在合理参数设置下,可以获得比较稳定的中短期交易盈利,属于易于实盘的技术面策略。但同时也应注意防范突发重大基本消息,适当放宽止损距离等风险防范措施,这也是未来可以进一步优化的方向。 ||
Overview
This strategy utilizes three mainstream technical indicators: the moving average EMA, the relative strength index RSI and the commodity channel index CCI to identify price momentum through EMA crossovers and further entries confirmed by oversold/overbought readings from RSI and CCI. This intermediate-term trading strategy aims to capture momentum reversals.
Strategy Logic
-
Use crossovers between 4-period and 8-period EMA to determine price momentum – the faster 4-period EMA to swiftly react and the slower 8-period EMA to confirm;
-
When EMAs turn upward, i.e. the 4-period EMA crossing above the 8-period EMA, check that RSI (over 65) and CCI (above 0) are not overbought to give a long signal;
-
When EMAs turn downward, i.e. the 4-period EMA crossing below the 8-period EMA, check that RSI (below 35) and CCI (below 0) are oversold to give a short signal;
-
Set stop loss and take profit prices based on input distances once trade signals are triggered.
In summary, this strategy considers medium-term trend and short-term overbought/oversold levels to form relatively stable signals, while stop losses and take profits effectively limit loss per trade.
Advantage Analysis
-
Multiple indicators mitigate false signals from individual oscillators;
-
EMAs determine the main trend while RSI and CCI avoid overheated areas to improve win rate;
-
Automatic stop loss and take profit setup constrains loss in extreme moves;
-
Purely technical nature makes this strategy easily implementable across any timeframe.
Risk Analysis
-
Major fundamental news can override technical levels;
-
Stop loss may be taken out by huge volatility calls for wider stops;
-
Frequent trading drives higher transaction costs thus best left for high frequency algorithms.
Enhancement Opportunities
-
Incorporate machine learning models to auto-adjust parameters based on fundamentals;
-
Build adaptive stops reacting to volatility rather than fixed distances.
Conclusion
This multifaceted strategy can deliver consistent medium-term profits under optimized parameters, making it an accessible technical system. Still, allowance needs to be given to black swan events via expanded stops etc, presenting areas for ongoing refinements.
[/trans]
Strategy Arguments
| Argument | Default | Description |
|---|---|---|
| v_input_1 | 4 | Length_MA4 |
| v_input_2_close | 0 | Source: close |
| v_input_3 | false | Offset |
| v_input_4 | 8 | Length_MA8 |
| v_input_5_close | 0 | Source: close |
| v_input_6 | false | Offset |
| v_input_7 | 14 | Length |
| v_input_8 | 6 | CCI Turbo Length |
| v_input_9 | 14 | CCI 14 Length |
| v_input_10 | 12 | a |
| v_input_11 | 15 | b |
| v_input_12 | 120 | tp |
| v_input_13 | 96 | sl |
Source (PineScript)
/*backtest
start: 2023-11-19 00:00:00
end: 2023-11-26 00:00:00
period: 45m
basePeriod: 5m
exchanges: [{"eid":"Futures_Binance","currency":"BTC_USDT"}]
*/

// This source code is subject to the terms of the Mozilla Public License 2.0 at https://mozilla.org/MPL/2.0/
// © SoftKill21

//@version=4


strategy(title="Moving Average Exponential", shorttitle="EMA", overlay=true)


len4 = input(4, minval=1, title="Length_MA4")
src4 = input(close, title="Source")
offset4 = input(title="Offset", type=input.integer, defval=0, minval=-500, maxval=500)
out4 = ema(src4, len4)
plot(out4, title="EMA", color=color.blue, offset=offset4)

len8 = input(8, minval=1, title="Length_MA8")
src8 = input(close, title="Source")
offset8 = input(title="Offset", type=input.integer, defval=0, minval=-500, maxval=500)
out8 = ema(src8, len8)
plot(out8, title="EMA", color=color.blue, offset=offset8)


//rsioma
src = close, len = input(14, minval=1, title="Length")
up = rma(max(change(ema(src, len)), 0), len)
down = rma(-min(change(ema(src, len)), 0), len)
rsi = down == 0 ? 100 : up == 0 ? 0 : 100 - (100 / (1 + up / down))
//plot(rsi, color=color.blue)
//band1 = hline(80)
//band0 = hline(20)
//fill(band1, band0, color=color.purple, transp=90)
//hline(50, color=color.gray, linestyle=plot.style_line)
sig = ema(rsi, 21)
//plot(sig, color=color.purple)

//woodie
cciTurboLength = input(title="CCI Turbo Length", type=input.integer, defval=6, minval=3, maxval=14)
cci14Length = input(title="CCI 14 Length", type=input.integer, defval=14, minval=7, maxval=20)

source = close

cciTurbo = cci(source, cciTurboLength)
cci14 = cci(source, cci14Length)

last5IsDown = cci14[5] < 0 and cci14[4] < 0 and cci14[3] < 0 and cci14[2] < 0 and cci14[1] < 0
last5IsUp = cci14[5] > 0 and cci14[4] > 0 and cci14[3] > 0 and cci14[2] > 0 and cci14[1] > 0
histogramColor = last5IsUp ? color.green : last5IsDown ? color.red : cci14 < 0 ? color.green : color.red


// Exit Condition
// Exit Condition
a = input(12)*10
b = input(15)*10
c = a*syminfo.mintick
d = b*syminfo.mintick


longCondition = crossover(out4, out8) and (rsi >= 65 and cci14>=0)
shortCondition = crossunder(out4, out8) and (rsi <=35 and cci14<=0)


long_stop_level     = float(na)
long_profit_level1  = float(na)
long_profit_level2  = float(na)
long_even_level     = float(na)

short_stop_level    = float(na)
short_profit_level1 = float(na)
short_profit_level2 = float(na)
short_even_level    = float(na)

long_stop_level     := longCondition  ? close - c : long_stop_level     [1]
long_profit_level1  := longCondition  ? close + d : long_profit_level1  [1]
//long_profit_level2  := longCondition  ? close + d : long_profit_level2  [1]
//long_even_level     := longCondition  ? close + 0 : long_even_level     [1]

short_stop_level    := shortCondition ? close + c : short_stop_level    [1]
short_profit_level1 := shortCondition ? close - d : short_profit_level1 [1]
//short_profit_level2 := shortCondition ? close - d : short_profit_level2 [1]
//short_even_level    := shortCondition ? close + 0 : short_even_level    [1]


//ha
// === Input ===
//ma1_len = input(1, title="MA 01")
//ma2_len = input(40, title="MA 02")

// === MA 01 Filter ===
//o=ema(open,ma1_len)
//cc=ema(close,ma1_len)
//h=ema(high,ma1_len)
//l=ema(low,ma1_len)

// === HA calculator ===
//ha_t = heikinashi(syminfo.tickerid)
//ha_o = security(ha_t, timeframe.period, o)
//ha_c = security(ha_t, timeframe.period, cc)
//ha_h = security(ha_t, timeframe.period, h)
//ha_l = security(ha_t, timeframe.period, l)

// === MA 02 Filter ===
//o2=ema(ha_o, ma2_len)
//c2=ema(ha_c, ma2_len)
//h2=ema(ha_h, ma2_len)
//l2=ema(ha_l, ma2_len)

// === Color def ===
//ha_col=o2>c2 ? color.red : color.lime

// ===  PLOTITING===
//plotcandle(o2, h2, l2, c2, title="HA Smoothed", color=ha_col)

tp=input(120)
sl=input(96)

strategy.entry("long", strategy.long, when = longCondition)
//strategy.close("long", when = o2>c2 , comment="ha_long")
strategy.entry("short", strategy.short , when =shortCondition )
//strategy.close("short", when = o2<=c2 , comment = "ha_short" )

//strategy.close("long",when=long_profit_level1 or long_stop_level  , comment="tp/sl")
//strategy.close("short",when=short_profit_level1 or short_stop_level , comment="tp/sl")

strategy.exit("x_long","long",profit = tp, loss = sl) //when = o2>c2)
strategy.exit("x_short","short",profit = tp, loss = sl) //when = o2<c2)
Detail
https://www.fmz.com/strategy/433431
Last Modified
2023-11-27 15:51:01