
251 lines
9.0 KiB
Markdown
251 lines
9.0 KiB
Markdown
|
|
> Name
|
|
|
|
唐奇安渠道突破策略Donchian-Channel-Breakout-Strategy
|
|
|
|
> Author
|
|
|
|
ChaoZhang
|
|
|
|
> Strategy Description
|
|
|
|
|
|
[trans]
|
|
|
|
## 概述
|
|
|
|
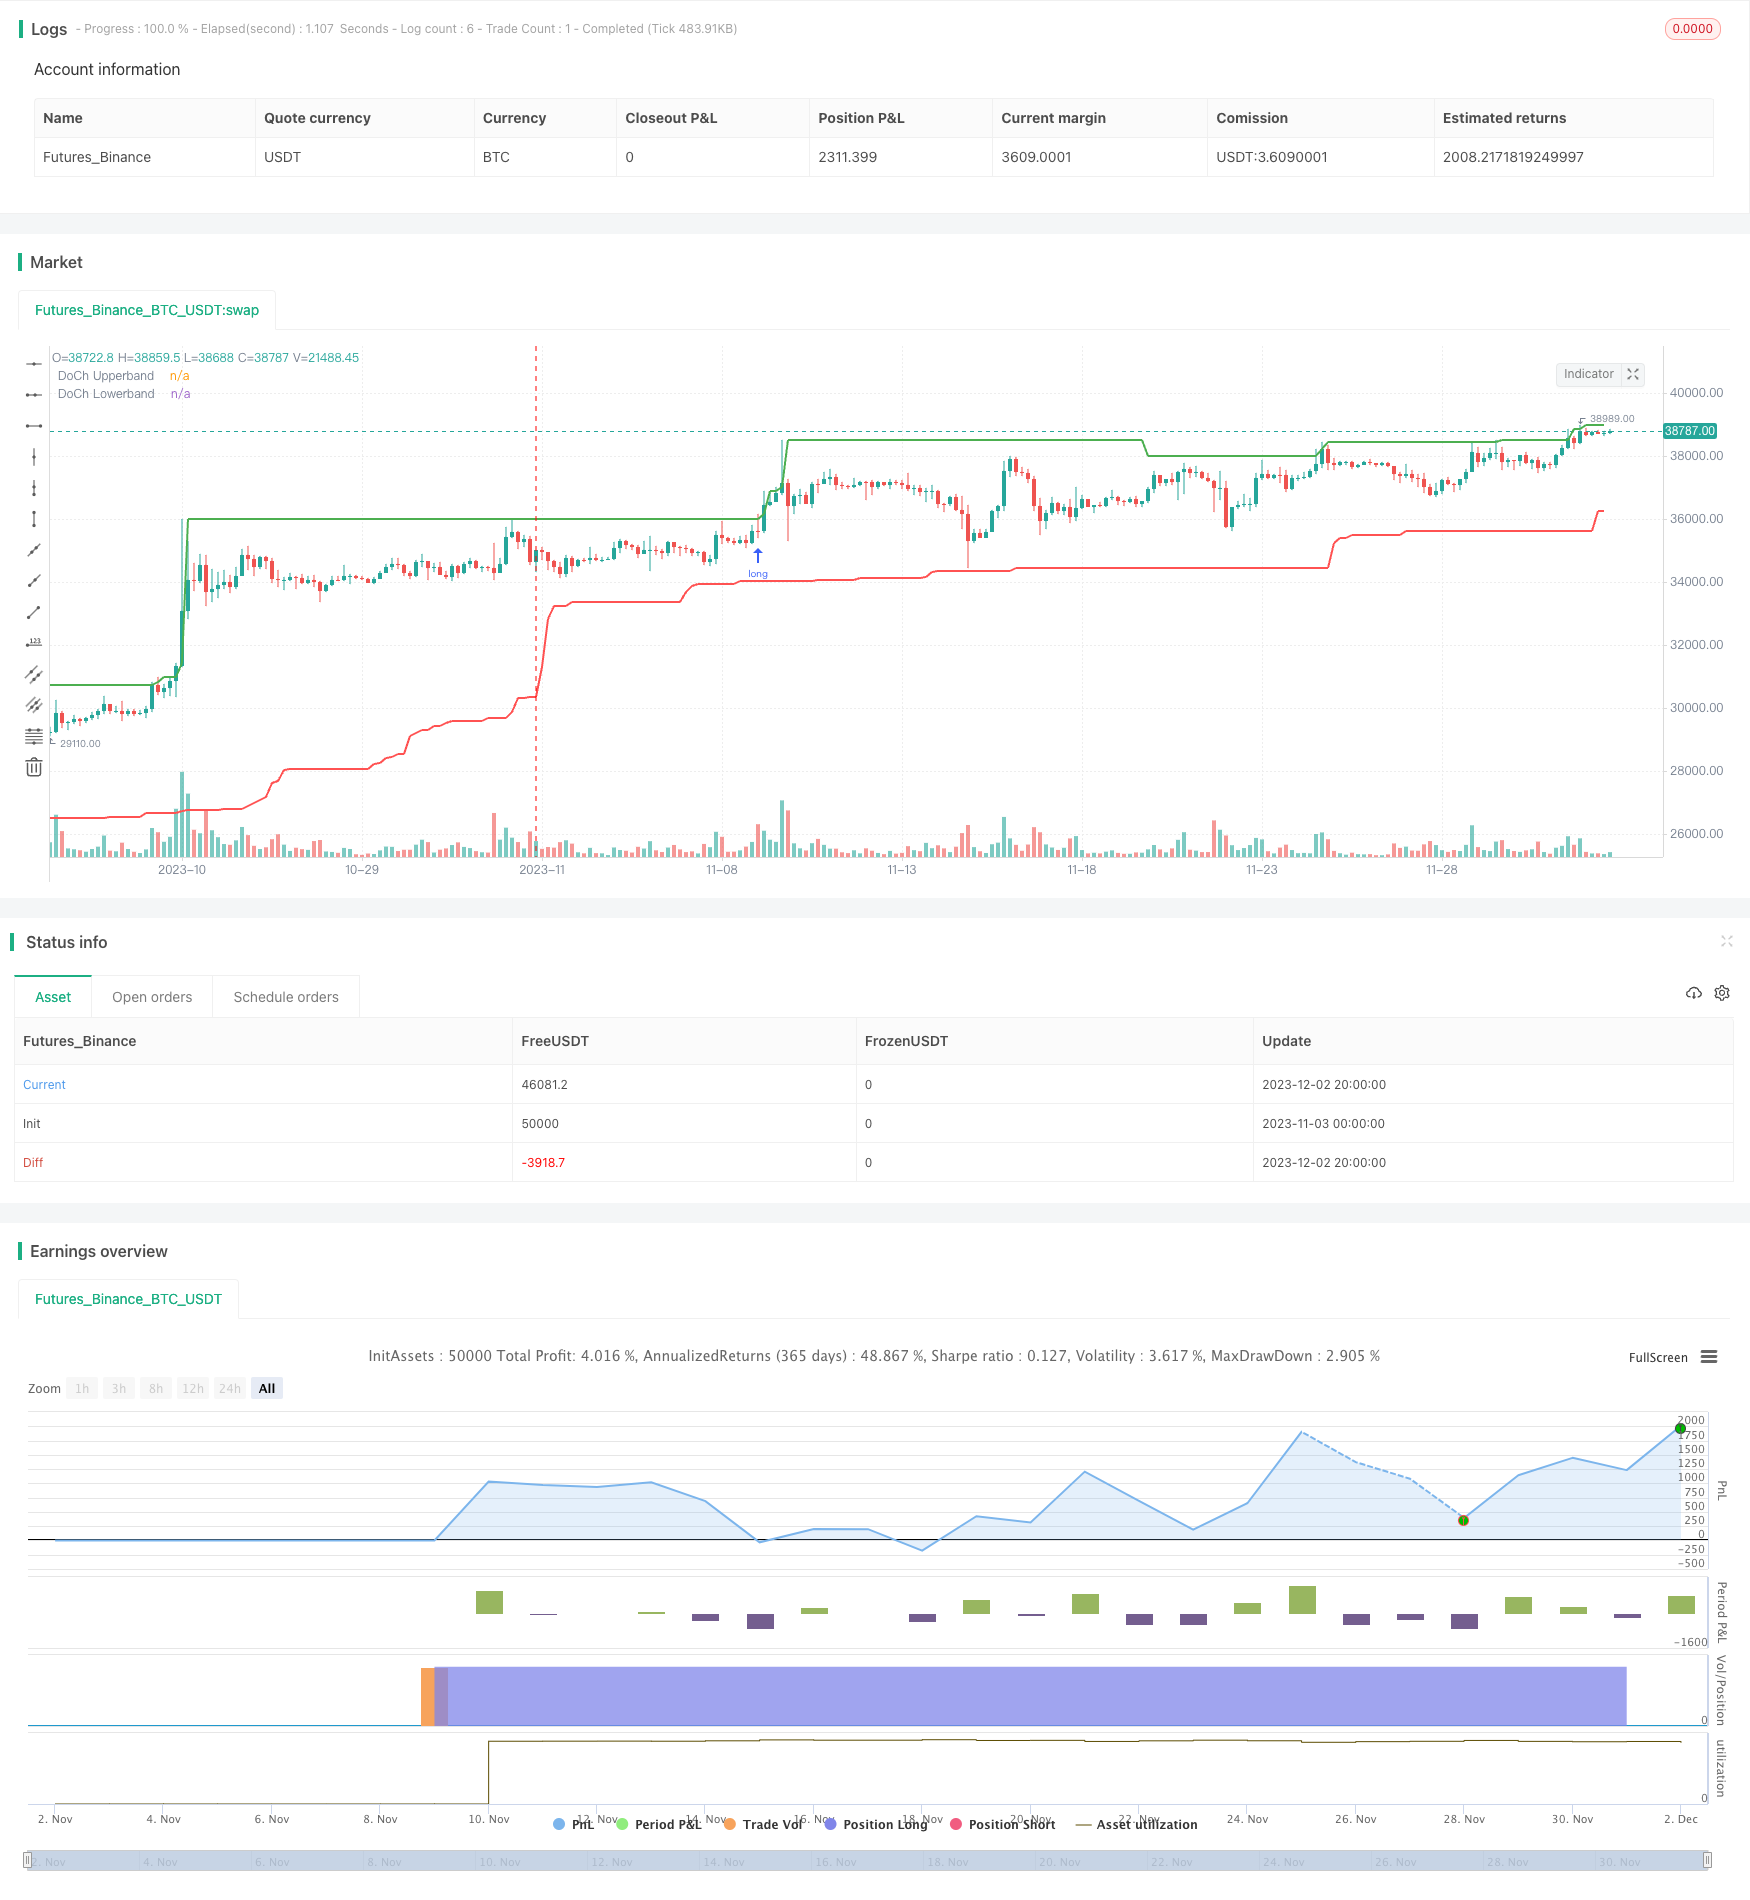
唐奇安渠道突破策略是一种基于价格行为和趋势的突破交易策略。它利用唐奇安通道上下轨来识别潜在的突破点,在价格突破通道时打开多头或空头头寸。
|
|
|
|
## 策略原理
|
|
|
|
该策略的核心逻辑是:
|
|
|
|
1. 使用 Ta.highest 和 Ta.lowest 函数计算一定周期(如60根K线)的最高价和最低价,构建唐奇安通道的上轨和下轨。
|
|
|
|
2. 当价格突破上轨时,认为行情可能进入多头趋势,所以在上轨突破下一根K线开盘时做多;当价格突破下轨时,认为行情可能进入空头趋势,所以在下轨突破下一根K线开盘时做空。
|
|
|
|
3. 一旦价格重新跌破上轨或重新涨破下轨,则认为趋势发生转折,此时平掉当前的多头或空头头寸。
|
|
|
|
4. 为控制风险,做多做空后的止损点设定为开仓价格减去或加上一个最小跳价。
|
|
|
|
这种基于通道突破的策略简单而直接,既考虑了价格行为又结合了趋势特征,容易操作而稳定。
|
|
|
|
## 优势分析
|
|
|
|
该策略具有以下几个优势:
|
|
|
|
1. 策略逻辑清晰简洁,容易理解和实施,实操性强。
|
|
|
|
2. 利用唐奇安通道判断趋势方向,可以有效过滤噪音,识别可靠的突破信号。
|
|
|
|
3. 做多做空后的止损设置合理,可以很好控制单笔损失。
|
|
|
|
4. 无论行情处于何种状态,只要价格发生有效突破,该策略都可以顺势而为,抓住潜在趋势。
|
|
|
|
5. 策略参数较少,不易过拟合,参数优化空间大,可塑性强。
|
|
|
|
|
|
## 风险分析
|
|
|
|
该策略也存在一些风险:
|
|
|
|
1. 趋势following策略,无法抓住反转行情。
|
|
|
|
2. 停损点过近可能会被价格短线波动止损。
|
|
|
|
3. 通道长度设置不当会增加假突破的概率。
|
|
|
|
针对上述风险,可以采取以下应对措施:
|
|
|
|
1. 结合其他指标识别潜在反转信号,避免强行following。
|
|
|
|
2. 设置合理的尾随止损以锁定盈利,而不是死撑初始止损。
|
|
|
|
3. 测试不同参数取值,找出最佳参数组合。
|
|
|
|
## 优化方向
|
|
|
|
该策略还具有进一步优化的空间:
|
|
|
|
1. 尝试双通道突破策略,一个通道用于确定入场点,另一个通道用于确定止损或止盈点。
|
|
|
|
2. 在价格突破通道一定ticks后再开仓,以过滤部分假突破。
|
|
|
|
3. 添加交易量或波动率指标过滤,避免在价格剧烈波动时出现失误交易。
|
|
|
|
4. 尝试不同持仓策略,如趋势following策略或反转策略,多种组合可能获得更好结果。
|
|
|
|
5. 添加风险管理模块,控制单日最大损失、最大回撤等等。
|
|
|
|
|
|
## 总结
|
|
|
|
唐奇安渠道突破策略整体来说是一种非常实用的短期跟随趋势策略。它通过价格行为判断,识别潜在趋势的变化,利用通道突破打开仓位。策略逻辑简洁,容易操作,在多种市场中都可能获得不错的效果。通过进一步优化参数设定、止损机制、反转识别等等,该策略的表现还具有很大的提升空间。它可以作为量化交易的一个很好的起点策略。
|
|
|
|
||
|
|
|
|
## Overview
|
|
|
|
The Donchian Channel Breakout Strategy is a price action and trend following breakout trading strategy. It uses the upper and lower bands of the Donchian Channel to identify potential breakout points and takes long or short positions when prices break out of the channel.
|
|
|
|
## Strategy Logic
|
|
|
|
The core logic of this strategy is:
|
|
|
|
1. Use Ta.highest and Ta.lowest functions to calculate highest high and lowest low over a certain period (e.g. 60 bars) to construct the upper and lower bands of the Donchian Channel.
|
|
|
|
2. When prices break above the upper band, it indicates an uptrend may be starting, so go long at next bar's open after the upper band breakout. When prices break below the lower band, it indicates a downtrend may be starting, so go short at next bar's open after lower band breakout.
|
|
|
|
3. Once prices fall back below upper band or rise back above lower band, it indicates a trend reversal, so flatten existing long or short positions.
|
|
|
|
4. To control risks, set stop loss at entry price minus/plus one minimum tick after initiating long/short positions.
|
|
|
|
|
|
This kind of channel breakout strategy is simple and straightforward, taking into account both price action and trend following, easy to execute and stable.
|
|
|
|
## Advantages
|
|
|
|
This strategy has several advantages:
|
|
|
|
1. The logic is clear, simple and easy to understand, with high executability.
|
|
|
|
2. Using Donchian Channel to determine trend direction can effectively filter out noise and identify reliable breakout signals.
|
|
|
|
3. Reasonable stop loss setting after entry can well control single trade loss.
|
|
|
|
4. No matter the market condition, the strategy can trade along with trend once valid breakout happens and catch potential big moves.
|
|
|
|
5. Very few parameters, not prone to overfitting, with large tuning space and high plasticity.
|
|
|
|
|
|
## Risks
|
|
|
|
There are also some risks with this strategy:
|
|
|
|
1. As a trend following strategy, it cannot catch reversal moves.
|
|
|
|
2. Stop loss too close may get stopped out by short-term price swings.
|
|
|
|
3. Improper channel length setting increases false breakout probabilities.
|
|
|
|
Some counter measures:
|
|
|
|
1. Incorporate other indicators to identify potential reversals, avoid blindly following trends.
|
|
|
|
2. Use reasonable trailing stop to lock in profits instead of sticking to initial hard stop loss.
|
|
|
|
3. Test different parameter values to find optimal combination.
|
|
|
|
|
|
## Optimization Directions
|
|
|
|
There is room for further optimization:
|
|
|
|
1. Try double Donchian channel breakout strategy, one for entry and one for stop loss/profit taking.
|
|
|
|
2. Only taking trades after the breakout exceeds certain amount of ticks to filter some false breaks.
|
|
|
|
3. Add volume or volatility filter to avoid bad trades when prices swing violently.
|
|
|
|
4. Try different holding strategies like trend following or mean reversion in combination for better results.
|
|
|
|
5. Add risk management modules to limit max daily loss, max drawdown etc.
|
|
|
|
|
|
## Conclusion
|
|
|
|
In summary, the Donchian Channel Breakout Strategy is a very practical short-term trend following strategy. It identifies potential trend changes through price action, and utilizes channel breakouts to enter trades. The logic is simple and easy to execute, and can achieve decent results across various markets. With further optimizations like parameter tuning, stop loss mechanisms, reversal identification etc., significant performance lift can be expected. It serves as a great starting point strategy for algo trading.
|
|
|
|
[/trans]
|
|
|
|
> Strategy Arguments
|
|
|
|
|
|
|
|
|Argument|Default|Description|
|
|
|----|----|----|
|
|
|v_input_int_1|60|Price action and breackout Channel Forexrn|
|
|
|v_input_bool_1|true|Use Position Sizing?|
|
|
|v_input_int_2|10|ATR Length|
|
|
|v_input_float_1|4|ATR Risk Offset Multiple|
|
|
|v_input_float_2|2|Max Position Risk %|
|
|
|v_input_float_3|10|Max Position Exposure %|
|
|
|v_input_int_3|10|Margin %|
|
|
|
|
|
|
> Source (PineScript)
|
|
|
|
``` pinescript
|
|
/*backtest
|
|
start: 2023-11-03 00:00:00
|
|
end: 2023-12-03 00:00:00
|
|
period: 4h
|
|
basePeriod: 15m
|
|
exchanges: [{"eid":"Futures_Binance","currency":"BTC_USDT"}]
|
|
*/
|
|
|
|
//@version=5
|
|
// Step 1. Define strategy settings
|
|
strategy(title="Price action and breakout Channel Forexrn", overlay=true,
|
|
pyramiding=0, initial_capital=100000,
|
|
commission_type=strategy.commission.cash_per_order,
|
|
commission_value=4, slippage=2)
|
|
|
|
dochLen = input.int(60, title="Price action and breackout Channel Forexrn")
|
|
|
|
// Position sizing inputs
|
|
usePosSize = input.bool(true, title="Use Position Sizing?")
|
|
atrLen = input.int(10, title="ATR Length")
|
|
atrRiskOffset = input.float(4, title="ATR Risk Offset Multiple", step=0.25)
|
|
|
|
maxRisk = input.float(2, title="Max Position Risk %", step=.25,
|
|
minval=0.25, maxval=15)
|
|
maxExposure = input.float(10, title="Max Position Exposure %", step=1,
|
|
minval=1, maxval=100)
|
|
marginPerc = input.int(10, title="Margin %", minval=1, maxval=100)
|
|
|
|
// Step 2. Calculate strategy values
|
|
upperband = ta.highest(high, dochLen)[1]
|
|
lowerband = ta.lowest(low, dochLen)[1]
|
|
|
|
// Calculate position size
|
|
riskEquity = (maxRisk * 0.01) * strategy.equity
|
|
riskTrade = (ta.atr(atrLen) * atrRiskOffset) * syminfo.pointvalue
|
|
|
|
maxPos = ((maxExposure * 0.01) * strategy.equity) /
|
|
((marginPerc * 0.01) * (close * syminfo.pointvalue))
|
|
|
|
posSize = usePosSize ? math.min(math.floor(riskEquity / riskTrade), maxPos) : 1
|
|
|
|
// Step 3. Output strategy data
|
|
plot(upperband, color=color.green, linewidth=2, title="DoCh Upperband")
|
|
plot(lowerband, color=color.red, linewidth=2, title="DoCh Lowerband")
|
|
|
|
// Step 4. Determine trading conditions
|
|
tradeWindow = true
|
|
|
|
tradeAllowed = tradeWindow and bar_index > dochLen
|
|
|
|
// Step 5. Submit entry orders
|
|
if tradeAllowed
|
|
if strategy.position_size < 1
|
|
strategy.entry("EL", strategy.long, qty=posSize,
|
|
stop=upperband + syminfo.mintick)
|
|
|
|
if strategy.position_size > -1
|
|
strategy.entry("ES", strategy.short, qty=posSize,
|
|
stop=lowerband - syminfo.mintick)
|
|
|
|
// Step 6. Submit exit orders
|
|
if not tradeWindow
|
|
strategy.close_all()
|
|
```
|
|
|
|
> Detail
|
|
|
|
https://www.fmz.com/strategy/434172
|
|
|
|
> Last Modified
|
|
|
|
2023-12-04 14:16:33
|