
9.3 KiB
Name
唐奇安波动通道交易策略Donchian-Channel-Breakout-Trading-Strategy
Author
ChaoZhang
Strategy Description
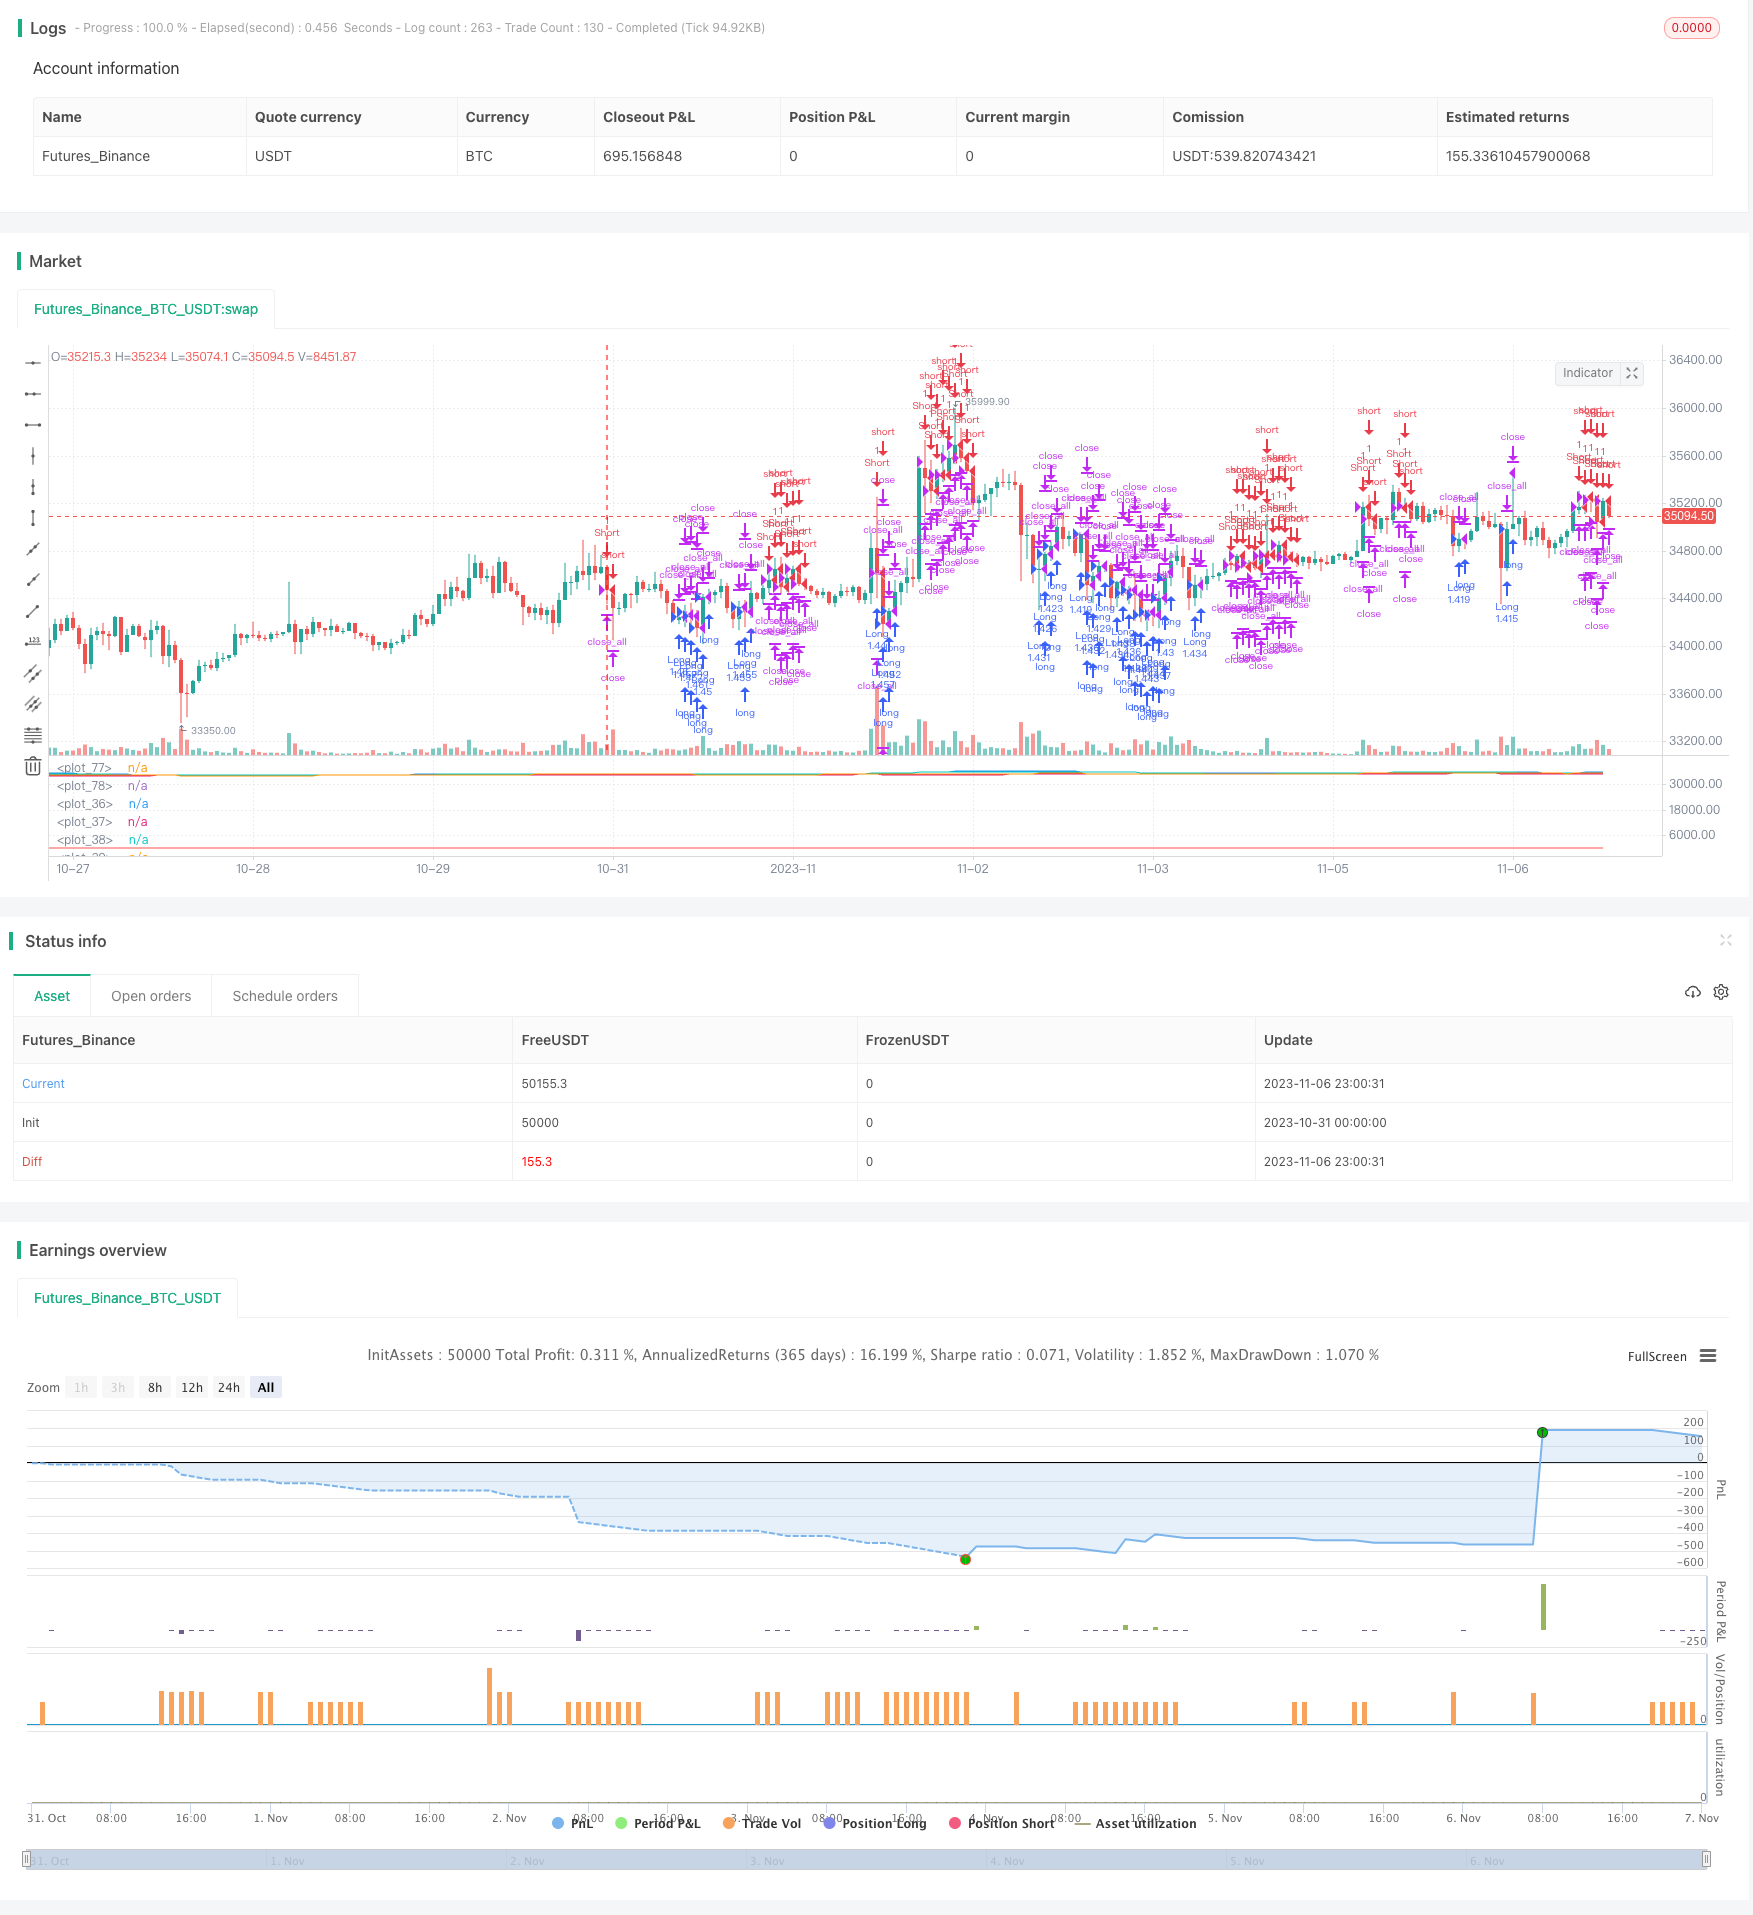
[trans]
概述
唐奇安波动通道交易策略通过计算一定周期内的最高价和最低价的通道来判断当前价格趋势,并结合突破通道进行long和short交易。该策略适用于高波动的股票和数字货币交易。
策略原理
该策略通过计算last(history)周期内的最高价pcmax和最低价pcmin构建通道。通道上轨和下轨计算方法为:
上轨yh = pcmax - (pcmax - pcmin) * (100 - percentDev)/100
下轨yl = pcmin + (pcmax - pcmin) * percentDev/100
其中percentDev默认为13。
当价格突破上轨时,产生long信号;当价格突破下轨时,产生short信号。
具体交易信号的产生判断方法如下:
-
boundup = high > yh 判断是否突破上轨
-
bounddn = low < yl 判断是否突破下轨
-
upsign = sma(bounddn, 2) == 1 通过bounddn的均线判断持续突破下轨
-
dnsign = sma(boundup, 2) == 1 通过boundup的均线判断持续突破上轨
-
exitup = dnsign 突破上轨产生平仓信号
-
exitdn = upsign 突破下轨产生平仓信号
-
if upsign 突破下轨产生做多信号
-
if dnsign 突破上轨产生做空信号
该策略同时设定了起止交易时间,避免不必要的隔夜仓位。
策略优势
-
使用唐奇安通道判断趋势,回测效果较好
-
同时设定做多和做空信号,可以双向交易
-
通过均线过滤判断信号,避免错误交易
-
设定止损方式可选,可控制风险
-
设定起止交易时间,避免隔夜仓位风险
策略风险
-
唐奇安通道对参数history和percentDev敏感,需要优化参数以适应不同品种
-
震荡行情中可能产生错误信号
-
没有考虑订单管理因素,实盘中可能会对盈利造成影响
-
没有考虑仓位管理因素,实盘中可能存在仓位过大的风险
-
没有考虑资金管理因素,实盘中需要合理设置交易资金
策略优化方向
-
优化参数history和percentDev,使之更好适应不同品种
-
增加过滤器,避免震荡行情中的错误信号
-
加入仓位管理模块,控制单笔仓位占用资金比例
-
加入资金管理模块,限制总仓位占用资金比例
-
加入订单管理功能,优化下单方式
总结
唐奇安波动通道交易策略通过通道突破来判断趋势和交易信号,回测效果较好,同时具备双向交易能力。但该策略也存在一些风险,需要对参数、过滤器、仓位管理、资金管理、订单管理等方面进行优化,才能在实盘中稳定盈利。总体来说,该策略为一种较为传统的趋势跟随策略,经过优化改进后,可以成为一种可靠的量化交易策略。
||
Overview
The Donchian channel breakout trading strategy judges current price trends by calculating the channel of highest and lowest prices over a certain period and trades long and short based on channel breakouts. This strategy is suitable for highly volatile stocks and cryptocurrencies.
Strategy Logic
This strategy constructs a channel by calculating the highest price pcmax and lowest price pcmin over the last history periods. The calculation methods for the upper and lower rail of the channel are:
Upper rail yh = pcmax - (pcmax - pcmin) * (100 - percentDev)/100
Lower rail yl = pcmin + (pcmax - pcmin) * percentDev/100
where percentDev defaults to 13.
A long signal is generated when the price breaks through the upper rail. A short signal is generated when the price breaks through the lower rail.
The specific logic to generate trading signals is:
-
boundup = high > yh to determine if the upper rail is broken
-
bounddn = low < yl to determine if the lower rail is broken
-
upsign = sma(bounddn, 2) == 1 uses sma of bounddn to determine persistent breakout of lower rail
-
dnsign = sma(boundup, 2) == 1 uses sma of boundup to determine persistent breakout of upper rail
-
exitup = dnsign breakout of upper rail generates exit signal
-
exitdn = upsign breakout of lower rail generates exit signal
-
if upsign breakout of lower rail generates long signal
-
if dnsign breakout of upper rail generates short signal
The strategy also sets start and end trading times to avoid unnecessary overnight positions.
Advantages of the Strategy
-
Uses Donchian channel to determine trends, good backtest results
-
Has both long and short signals, allows two-way trading
-
Uses SMA to filter signals and avoid bad trades
-
Optional stop loss to control risks
-
Sets start and end trading times to avoid overnight risks
Risks of the Strategy
-
Sensitive to history and percentDev parameters, needs optimization for different products
-
May generate false signals in range-bound markets
-
Does not consider order management, may impact profitability in live trading
-
Does not consider position sizing, risks of oversized positions
-
Does not consider money management, needs reasonable trading capital
Enhancement Ideas
-
Optimize history and percentDev parameters for different products
-
Add filters to avoid false signals in ranging markets
-
Add position sizing module to control single position size
-
Add money management module to limit total position size
-
Add order management for optimal order execution
Conclusion
The Donchian channel breakout strategy uses channel breakouts to determine trends and trading signals, with good backtest results and ability to trade both long and short. However, risks exist regarding parameter optimization, filters, position sizing, money management, order management etc. Proper enhancements in these areas are needed before stable live trading. Overall, it is a traditional trend following strategy, and with optimizations can become a reliable quantitative trading strategy.
[/trans]
Strategy Arguments
| Argument | Default | Description |
|---|---|---|
| v_input_1 | 20 | history |
| v_input_2 | 13 | percentDev |
| v_input_3 | 100 | capital |
| v_input_4 | true | Long |
| v_input_5 | true | Short |
| v_input_6 | true | Stop Loss |
| v_input_7 | 3.8 | Stop loss multiplicator |
| v_input_8 | 2018 | From Year |
| v_input_9 | 2100 | To Year |
| v_input_10 | true | From Month |
| v_input_11 | 12 | To Month |
| v_input_12 | true | From day |
| v_input_13 | 31 | To day |
Source (PineScript)
/*backtest
start: 2023-10-31 00:00:00
end: 2023-11-07 00:00:00
period: 1h
basePeriod: 15m
exchanges: [{"eid":"Futures_Binance","currency":"BTC_USDT"}]
*/

////////////////////////////////////////////////////////////
//  Copyright by AlexInc v1.0 02/07/2018  @aav_1980
// PriceChannel strategy
// If you find this script helpful, you can also help me by sending donation to
// BTC 16d9vgFvCmXpLf8FiKY6zsy6pauaCyFnzS
// LTC LQ5emyqNRjdRMqHPHEqREgryUJqmvYhffM
////////////////////////////////////////////////////////////
//@version=3
strategy("AlexInc PriceChannel Str", overlay=false)
history = input(20)
percentDev = input(13)
capital = input(100)

needlong = input(true, defval = true, title = "Long")
needshort = input(true, defval = true, title = "Short")
usestoploss = input(true, defval = true, title = "Stop Loss")
stoplossmult = input(3.8, defval = 3.8, minval = 1, maxval = 10, title = "Stop loss multiplicator")


fromyear = input(2018, defval = 2018, minval = 1900, maxval = 2100, title = "From Year")
toyear = input(2100, defval = 2100, minval = 1900, maxval = 2100, title = "To Year")
frommonth = input(01, defval = 01, minval = 01, maxval = 12, title = "From Month")
tomonth = input(12, defval = 12, minval = 01, maxval = 12, title = "To Month")
fromday = input(01, defval = 01, minval = 01, maxval = 31, title = "From day")
today = input(31, defval = 31, minval = 01, maxval = 31, title = "To day")

bodymin = min( open, close)
bodymax = max(open, close)

pcmax = highest(bodymax, history)
pcmin = lowest(bodymin, history)

yh = ((pcmax - pcmin) / 100 * (100 - percentDev)) + pcmin
yl = ((pcmax - pcmin) / 100 * percentDev) + pcmin

plot(pcmax)
plot(pcmin)
plot(yh)
plot(yl)

//1
bounddn = low < yl ? 1 : 0
boundup = high > yh ? 1 : 0
upsign = sma(bounddn, 2) == 1
dnsign = sma(boundup, 2) == 1
//2
//upsign = crossover(bodymin, yl)
//dnsign = crossunder(bodymax , yh)


exitup = dnsign
exitdn = upsign

lot = strategy.equity / close * capital / 100


xATR = atr(history)
nLoss = usestoploss ? stoplossmult * xATR : na

stop_level_long = 0.0
stop_level_long := nz(stop_level_long[1])

stop_level_short = 0.0
stop_level_short := nz(stop_level_short[1])

pos = strategy.position_size
if pos >0 and pos[1] <= 0 //crossover(pos, 0.5)
    stop_level_long = strategy.position_avg_price - nLoss
if pos < 0 and pos[1] >= 0 //crossunder(pos, -0.5)
    stop_level_short = strategy.position_avg_price + nLoss
if pos == 0
    stop_level_long = bodymin - nLoss
    stop_level_short = bodymax + nLoss

//plot(bodymax + nLoss, color=red)
//plot(bodymin - nLoss, color=red)
plot(stop_level_long, color=red)
plot(stop_level_short, color=red)

if upsign
    strategy.entry("Long", strategy.long, needlong == false ? 0 : lot)

if dnsign
    strategy.entry("Short", strategy.short, needshort == false ? 0 : na)

if true
    strategy.close_all()


//if strategy.position_size != 0
//    strategy.exit("Exit Long", from_entry = "Long", stop = stop_level_long)
//    strategy.exit("Exit Short", from_entry = "Short", stop = stop_level_short)
Detail
https://www.fmz.com/strategy/431502
Last Modified
2023-11-08 12:31:56