
229 lines
12 KiB
Markdown
229 lines
12 KiB
Markdown
|
|
> Name
|
|
|
|
双移动平均线与MACD结合的趋势跟踪动态止盈智能交易系统-Dual-Moving-Average-and-MACD-Combined-Trend-Following-Dynamic-Take-Profit-Smart-Trading-System
|
|
|
|
> Author
|
|
|
|
ChaoZhang
|
|
|
|
> Strategy Description
|
|
|
|
|
|
|
|
[trans]
|
|
#### 概述
|
|
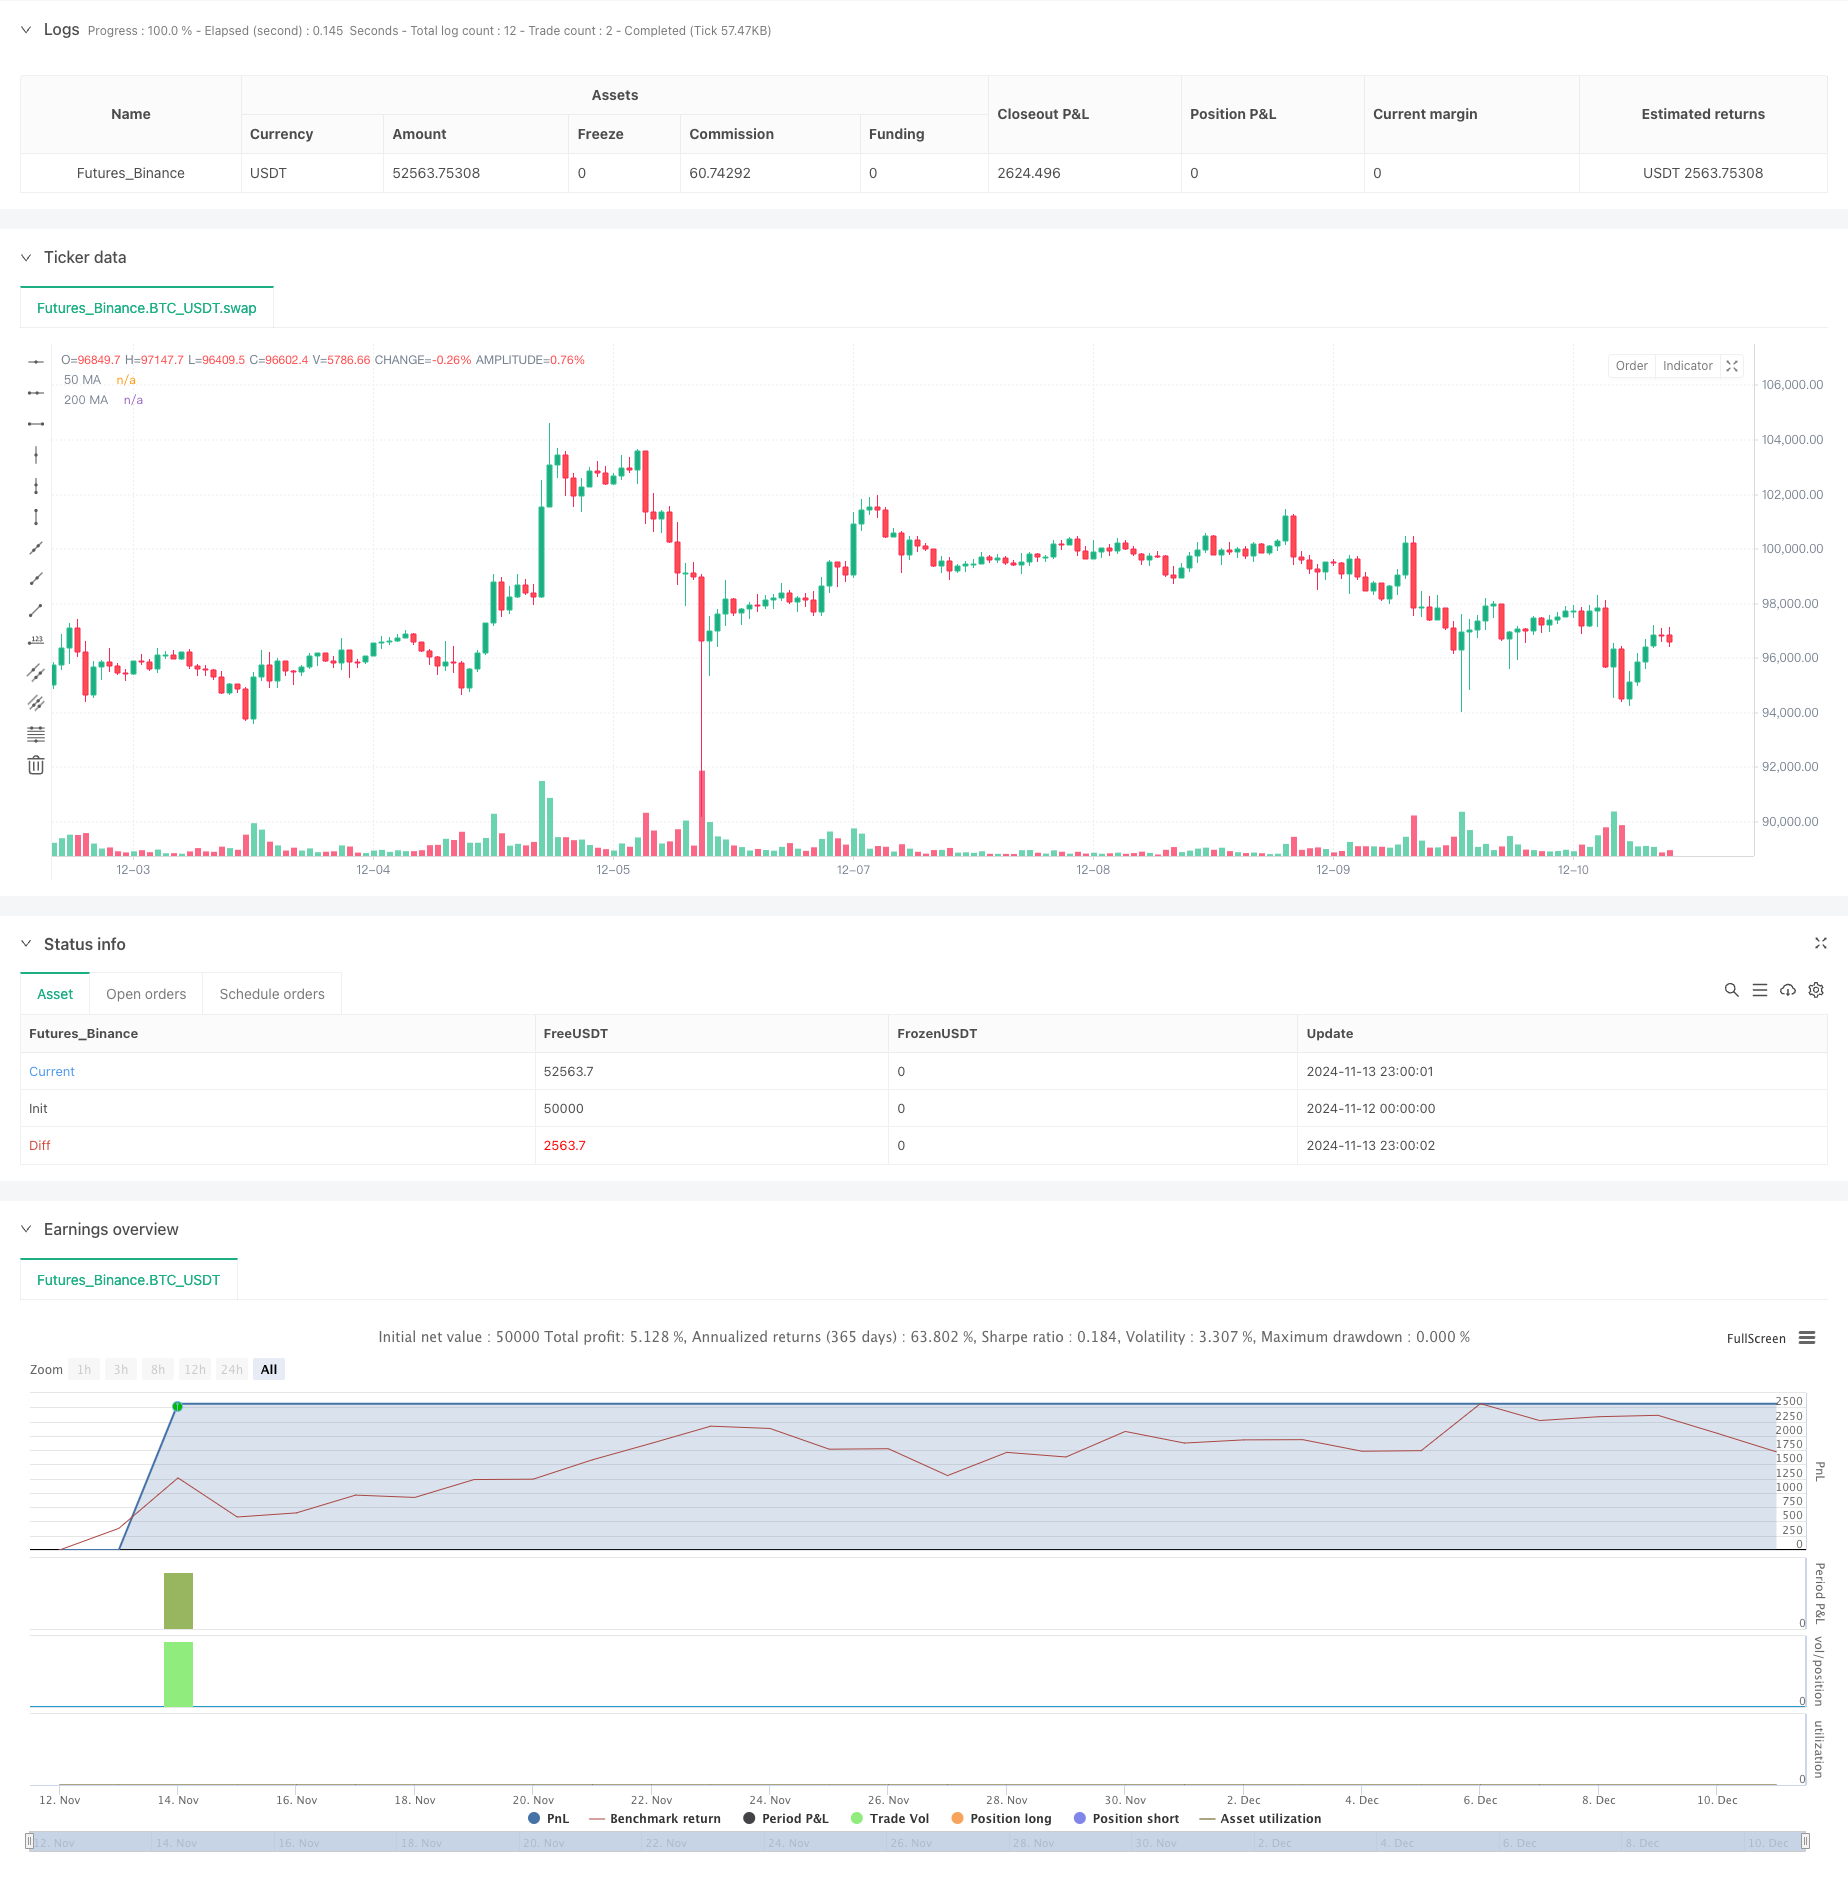
该策略是一个结合了双移动平均线和MACD指标的趋势跟踪系统。它利用50期和200期移动平均线来确定趋势方向,同时使用MACD指标捕捉具体的入场时机。策略采用了动态的止盈止损机制,并通过多重过滤条件来提高交易质量。这是一个在15分钟时间框架上运行的完整交易系统,具有精确的入场和出场规则。
|
|
|
|
#### 策略原理
|
|
策略的核心逻辑建立在以下几个关键要素上:
|
|
1. 趋势判断:使用50均线和200均线的位置关系判断整体趋势,当快速均线在慢速均线之上时判断为上升趋势,反之为下降趋势。
|
|
2. 入场信号:在确认趋势方向后,使用MACD指标的交叉来触发具体的入场信号。在上升趋势中,MACD线上穿信号线时入场做多;在下降趋势中,MACD线下穿信号线时入场做空。
|
|
3. 交易过滤:引入了最小交易间隔、趋势强度和MACD阈值等多重过滤机制,以避免在波动剧烈的市场环境中过度交易。
|
|
4. 风险控制:采用固定点数的止损和可调节的止盈机制,同时结合移动均线和MACD的反向信号作为动态退场条件。
|
|
|
|
#### 策略优势
|
|
1. 趋势跟踪与动量结合:通过结合移动均线和MACD指标,既能把握大趋势,又能准确定位入场时机。
|
|
2. 完善的风险管理:设置了多重止损机制,包括固定止损和技术指标触发的动态止损。
|
|
3. 灵活的参数设置:关键参数如止损止盈点数、均线周期等都可以根据市场情况灵活调整。
|
|
4. 智能过滤机制:通过多重过滤条件减少假信号,提高交易质量。
|
|
5. 完整的性能统计:内置了详细的交易统计功能,包括胜率、平均盈亏等关键指标的实时计算。
|
|
|
|
#### 策略风险
|
|
1. 震荡市场风险:在横盘震荡市场中可能产生频繁的假信号,建议增加趋势确认指标。
|
|
2. 滑点风险:小周期交易容易受到滑点影响,建议适当放宽止损设置。
|
|
3. 参数敏感性:策略表现对参数设置较为敏感,需要经过充分的参数优化。
|
|
4. 市场环境依赖:策略在强趋势市场表现较好,但在其他市场环境中效果可能不稳定。
|
|
|
|
#### 策略优化方向
|
|
1. 动态止损优化:可以根据ATR指标动态调整止损幅度,使其更适应市场波动。
|
|
2. 入场时机优化:可以添加RSI等辅助指标来确认入场时机,提高交易准确率。
|
|
3. 仓位管理优化:引入基于波动率的动态仓位管理系统,更好地控制风险。
|
|
4. 市场环境识别:增加市场环境识别模块,在不同市场条件下使用不同的参数组合。
|
|
|
|
#### 总结
|
|
这是一个设计合理、逻辑完整的趋势跟踪交易系统。通过结合经典的技术指标和现代的风险管理方法,该策略在把握趋势的同时也注重对风险的控制。尽管存在一些需要优化的地方,但整体而言是一个具有实用价值的交易策略。建议交易者在实盘使用前进行充分的回测,并根据具体的交易品种和市场环境对参数进行适当调整。 ||
|
|
|
|
#### Overview
|
|
This strategy is a trend following system that combines dual moving averages and MACD indicators. It uses 50-period and 200-period moving averages to determine trend direction while utilizing MACD indicator for specific entry timing. The strategy employs dynamic stop-loss and take-profit mechanisms, along with multiple filtering conditions to enhance trade quality. It is a complete trading system operating on a 15-minute timeframe with precise entry and exit rules.
|
|
|
|
#### Strategy Principles
|
|
The core logic is built on several key elements:
|
|
1. Trend Determination: Uses the relative position of 50MA and 200MA to judge overall trend, with uptrend confirmed when fast MA is above slow MA, and downtrend vice versa.
|
|
2. Entry Signals: After trend confirmation, uses MACD crossovers for specific entry signals. Enters long when MACD line crosses above signal line in uptrends; enters short when MACD line crosses below signal line in downtrends.
|
|
3. Trade Filtering: Incorporates multiple filtering mechanisms including minimum trade interval, trend strength, and MACD threshold to avoid overtrading in volatile market conditions.
|
|
4. Risk Control: Uses fixed-point stop-loss and adjustable take-profit mechanisms, combined with moving average and MACD reverse signals as dynamic exit conditions.
|
|
|
|
#### Strategy Advantages
|
|
1. Trend Following and Momentum Combination: Combines moving averages and MACD indicators to capture both major trends and precise entry timing.
|
|
2. Comprehensive Risk Management: Implements multiple stop-loss mechanisms, including fixed stops and technical indicator-triggered dynamic stops.
|
|
3. Flexible Parameter Settings: Key parameters such as stop-loss/take-profit points and MA periods can be adjusted according to market conditions.
|
|
4. Smart Filtering Mechanism: Reduces false signals through multiple filtering conditions to improve trade quality.
|
|
5. Complete Performance Statistics: Built-in detailed trade statistics including win rate and average profit/loss calculations in real-time.
|
|
|
|
#### Strategy Risks
|
|
1. Choppy Market Risk: May generate frequent false signals in sideways markets; consider adding trend confirmation indicators.
|
|
2. Slippage Risk: Short-term trading is susceptible to slippage; consider widening stop-loss settings.
|
|
3. Parameter Sensitivity: Strategy performance is sensitive to parameter settings, requiring thorough optimization.
|
|
4. Market Environment Dependency: Strategy performs well in strong trend markets but may be unstable in other market conditions.
|
|
|
|
#### Strategy Optimization Directions
|
|
1. Dynamic Stop-Loss Optimization: Can adjust stop-loss range dynamically based on ATR indicator to better adapt to market volatility.
|
|
2. Entry Timing Optimization: Can add RSI or other auxiliary indicators to confirm entry timing and improve trade accuracy.
|
|
3. Position Management Optimization: Introduce volatility-based dynamic position management system for better risk control.
|
|
4. Market Environment Recognition: Add market environment recognition module to use different parameter combinations under different market conditions.
|
|
|
|
#### Summary
|
|
This is a well-designed trend following trading system with complete logic. By combining classic technical indicators with modern risk management methods, the strategy balances trend capture with risk control. While there are areas for optimization, it is overall a practically valuable trading strategy. Traders are advised to conduct thorough backtesting before live implementation and adjust parameters according to specific trading instruments and market environments.[/trans]
|
|
|
|
|
|
|
|
> Source (PineScript)
|
|
|
|
``` pinescript
|
|
/*backtest
|
|
start: 2024-11-12 00:00:00
|
|
end: 2024-12-11 08:00:00
|
|
period: 1h
|
|
basePeriod: 1h
|
|
exchanges: [{"eid":"Futures_Binance","currency":"BTC_USDT"}]
|
|
*/
|
|
|
|
// This Pine Script™ code is subject to the terms of the Mozilla Public License 2.0 at https://mozilla.org/MPL/2.0/
|
|
// © WolfofAlgo
|
|
|
|
//@version=5
|
|
strategy("Trend Following Scalping Strategy", overlay=true, initial_capital=10000, default_qty_type=strategy.percent_of_equity, default_qty_value=200)
|
|
|
|
// Input Parameters
|
|
stopLossPips = input.float(5.0, "Stop Loss in Pips", minval=1.0)
|
|
takeProfitPips = input.float(10.0, "Take Profit in Pips", minval=1.0)
|
|
useFixedTakeProfit = input.bool(true, "Use Fixed Take Profit")
|
|
|
|
// Moving Average Parameters
|
|
fastMA = input.int(50, "Fast MA Period")
|
|
slowMA = input.int(200, "Slow MA Period")
|
|
|
|
// MACD Parameters
|
|
macdFastLength = input.int(12, "MACD Fast Length")
|
|
macdSlowLength = input.int(26, "MACD Slow Length")
|
|
macdSignalLength = input.int(9, "MACD Signal Length")
|
|
|
|
// Trade Filter Parameters (Adjusted to be less strict)
|
|
minBarsBetweenTrades = input.int(5, "Minimum Bars Between Trades", minval=1)
|
|
trendStrengthPeriod = input.int(10, "Trend Strength Period")
|
|
minTrendStrength = input.float(0.4, "Minimum Trend Strength", minval=0.1, maxval=1.0)
|
|
macdThreshold = input.float(0.00005, "MACD Threshold", minval=0.0)
|
|
|
|
// Variables for trade management
|
|
var int barsLastTrade = 0
|
|
barsLastTrade := nz(barsLastTrade[1]) + 1
|
|
|
|
// Calculate Moving Averages
|
|
ma50 = ta.sma(close, fastMA)
|
|
ma200 = ta.sma(close, slowMA)
|
|
|
|
// Calculate MACD
|
|
[macdLine, signalLine, _] = ta.macd(close, macdFastLength, macdSlowLength, macdSignalLength)
|
|
|
|
// Calculate trend strength (simplified)
|
|
trendDirection = ta.ema(close, trendStrengthPeriod) > ta.ema(close, trendStrengthPeriod * 2)
|
|
isUptrend = close > ma50 and ma50 > ma200
|
|
isDowntrend = close < ma50 and ma50 < ma200
|
|
|
|
// Calculate pip value
|
|
pointsPerPip = syminfo.mintick * 10
|
|
|
|
// Entry Conditions with Less Strict Filters
|
|
macdCrossUp = ta.crossover(macdLine, signalLine) and math.abs(macdLine - signalLine) > macdThreshold
|
|
macdCrossDown = ta.crossunder(macdLine, signalLine) and math.abs(macdLine - signalLine) > macdThreshold
|
|
|
|
// Long and Short Conditions
|
|
longCondition = close > ma50 and macdCrossUp and barsLastTrade >= minBarsBetweenTrades and isUptrend
|
|
shortCondition = close < ma50 and macdCrossDown and barsLastTrade >= minBarsBetweenTrades and isDowntrend
|
|
|
|
// Exit Conditions (made more lenient)
|
|
exitLongCondition = macdCrossDown or close < ma50
|
|
exitShortCondition = macdCrossUp or close > ma50
|
|
|
|
// Reset bars counter on new trade
|
|
if (longCondition or shortCondition)
|
|
barsLastTrade := 0
|
|
|
|
// Calculate stop loss and take profit levels
|
|
longStopPrice = strategy.position_avg_price - (stopLossPips * pointsPerPip)
|
|
longTakeProfitPrice = strategy.position_avg_price + (takeProfitPips * pointsPerPip)
|
|
shortStopPrice = strategy.position_avg_price + (stopLossPips * pointsPerPip)
|
|
shortTakeProfitPrice = strategy.position_avg_price - (takeProfitPips * pointsPerPip)
|
|
|
|
// Plot Moving Averages
|
|
plot(ma50, "50 MA", color=color.blue)
|
|
plot(ma200, "200 MA", color=color.red)
|
|
|
|
// Plot Entry Signals
|
|
plotshape(longCondition, "Long Signal", shape.triangleup, location.belowbar, color.green, size=size.small)
|
|
plotshape(shortCondition, "Short Signal", shape.triangledown, location.abovebar, color.red, size=size.small)
|
|
|
|
// Strategy Entry Rules
|
|
if (longCondition and strategy.position_size == 0)
|
|
strategy.entry("Long", strategy.long)
|
|
|
|
if (shortCondition and strategy.position_size == 0)
|
|
strategy.entry("Short", strategy.short)
|
|
|
|
// Strategy Exit Rules
|
|
if (strategy.position_size > 0 and exitLongCondition)
|
|
strategy.close("Long")
|
|
|
|
if (strategy.position_size < 0 and exitShortCondition)
|
|
strategy.close("Short")
|
|
|
|
// Stop Loss and Take Profit Management
|
|
if (strategy.position_size > 0)
|
|
strategy.exit("Long TP/SL", "Long", stop=longStopPrice, limit=useFixedTakeProfit ? longTakeProfitPrice : na)
|
|
|
|
if (strategy.position_size < 0)
|
|
strategy.exit("Short TP/SL", "Short", stop=shortStopPrice, limit=useFixedTakeProfit ? shortTakeProfitPrice : na)
|
|
|
|
// Performance Metrics
|
|
var float totalTrades = 0
|
|
var float winningTrades = 0
|
|
var float totalProfitPips = 0
|
|
var float totalLossPips = 0
|
|
|
|
if (strategy.closedtrades > 0)
|
|
totalTrades := strategy.closedtrades
|
|
winningTrades := strategy.wintrades
|
|
totalProfitPips := strategy.grossprofit / pointsPerPip
|
|
totalLossPips := math.abs(strategy.grossloss) / pointsPerPip
|
|
|
|
// Display Stats
|
|
var label statsLabel = na
|
|
label.delete(statsLabel[1])
|
|
|
|
// Create performance stats text
|
|
var string stats = ""
|
|
if (strategy.closedtrades > 0)
|
|
winRate = (winningTrades / math.max(totalTrades, 1)) * 100
|
|
avgWin = totalProfitPips / math.max(winningTrades, 1)
|
|
avgLoss = totalLossPips / math.max(totalTrades - winningTrades, 1)
|
|
plRatio = avgWin / math.max(avgLoss, 1)
|
|
|
|
stats := "Win Rate: " + str.tostring(winRate, "#.##") + "%\n" +
|
|
"Avg Win: " + str.tostring(avgWin, "#.##") + " pips\n" +
|
|
"Avg Loss: " + str.tostring(avgLoss, "#.##") + " pips\n" +
|
|
"P/L Ratio: " + str.tostring(plRatio, "#.##") + "\n" +
|
|
"Total Trades: " + str.tostring(totalTrades, "#")
|
|
|
|
statsLabel := label.new(x=bar_index, y=high, text=stats, style=label.style_label_down, color=color.new(color.blue, 80))
|
|
|
|
```
|
|
|
|
> Detail
|
|
|
|
https://www.fmz.com/strategy/474972
|
|
|
|
> Last Modified
|
|
|
|
2024-12-13 11:23:00
|