
170 lines
7.0 KiB
Markdown
170 lines
7.0 KiB
Markdown
|
|
> Name
|
|
|
|
双移动均线交叉反转策略Dual-Moving-Average-Reversal-Strategy
|
|
|
|
> Author
|
|
|
|
ChaoZhang
|
|
|
|
> Strategy Description
|
|
|
|
|
|
|
|
[trans]
|
|
|
|
## 概述
|
|
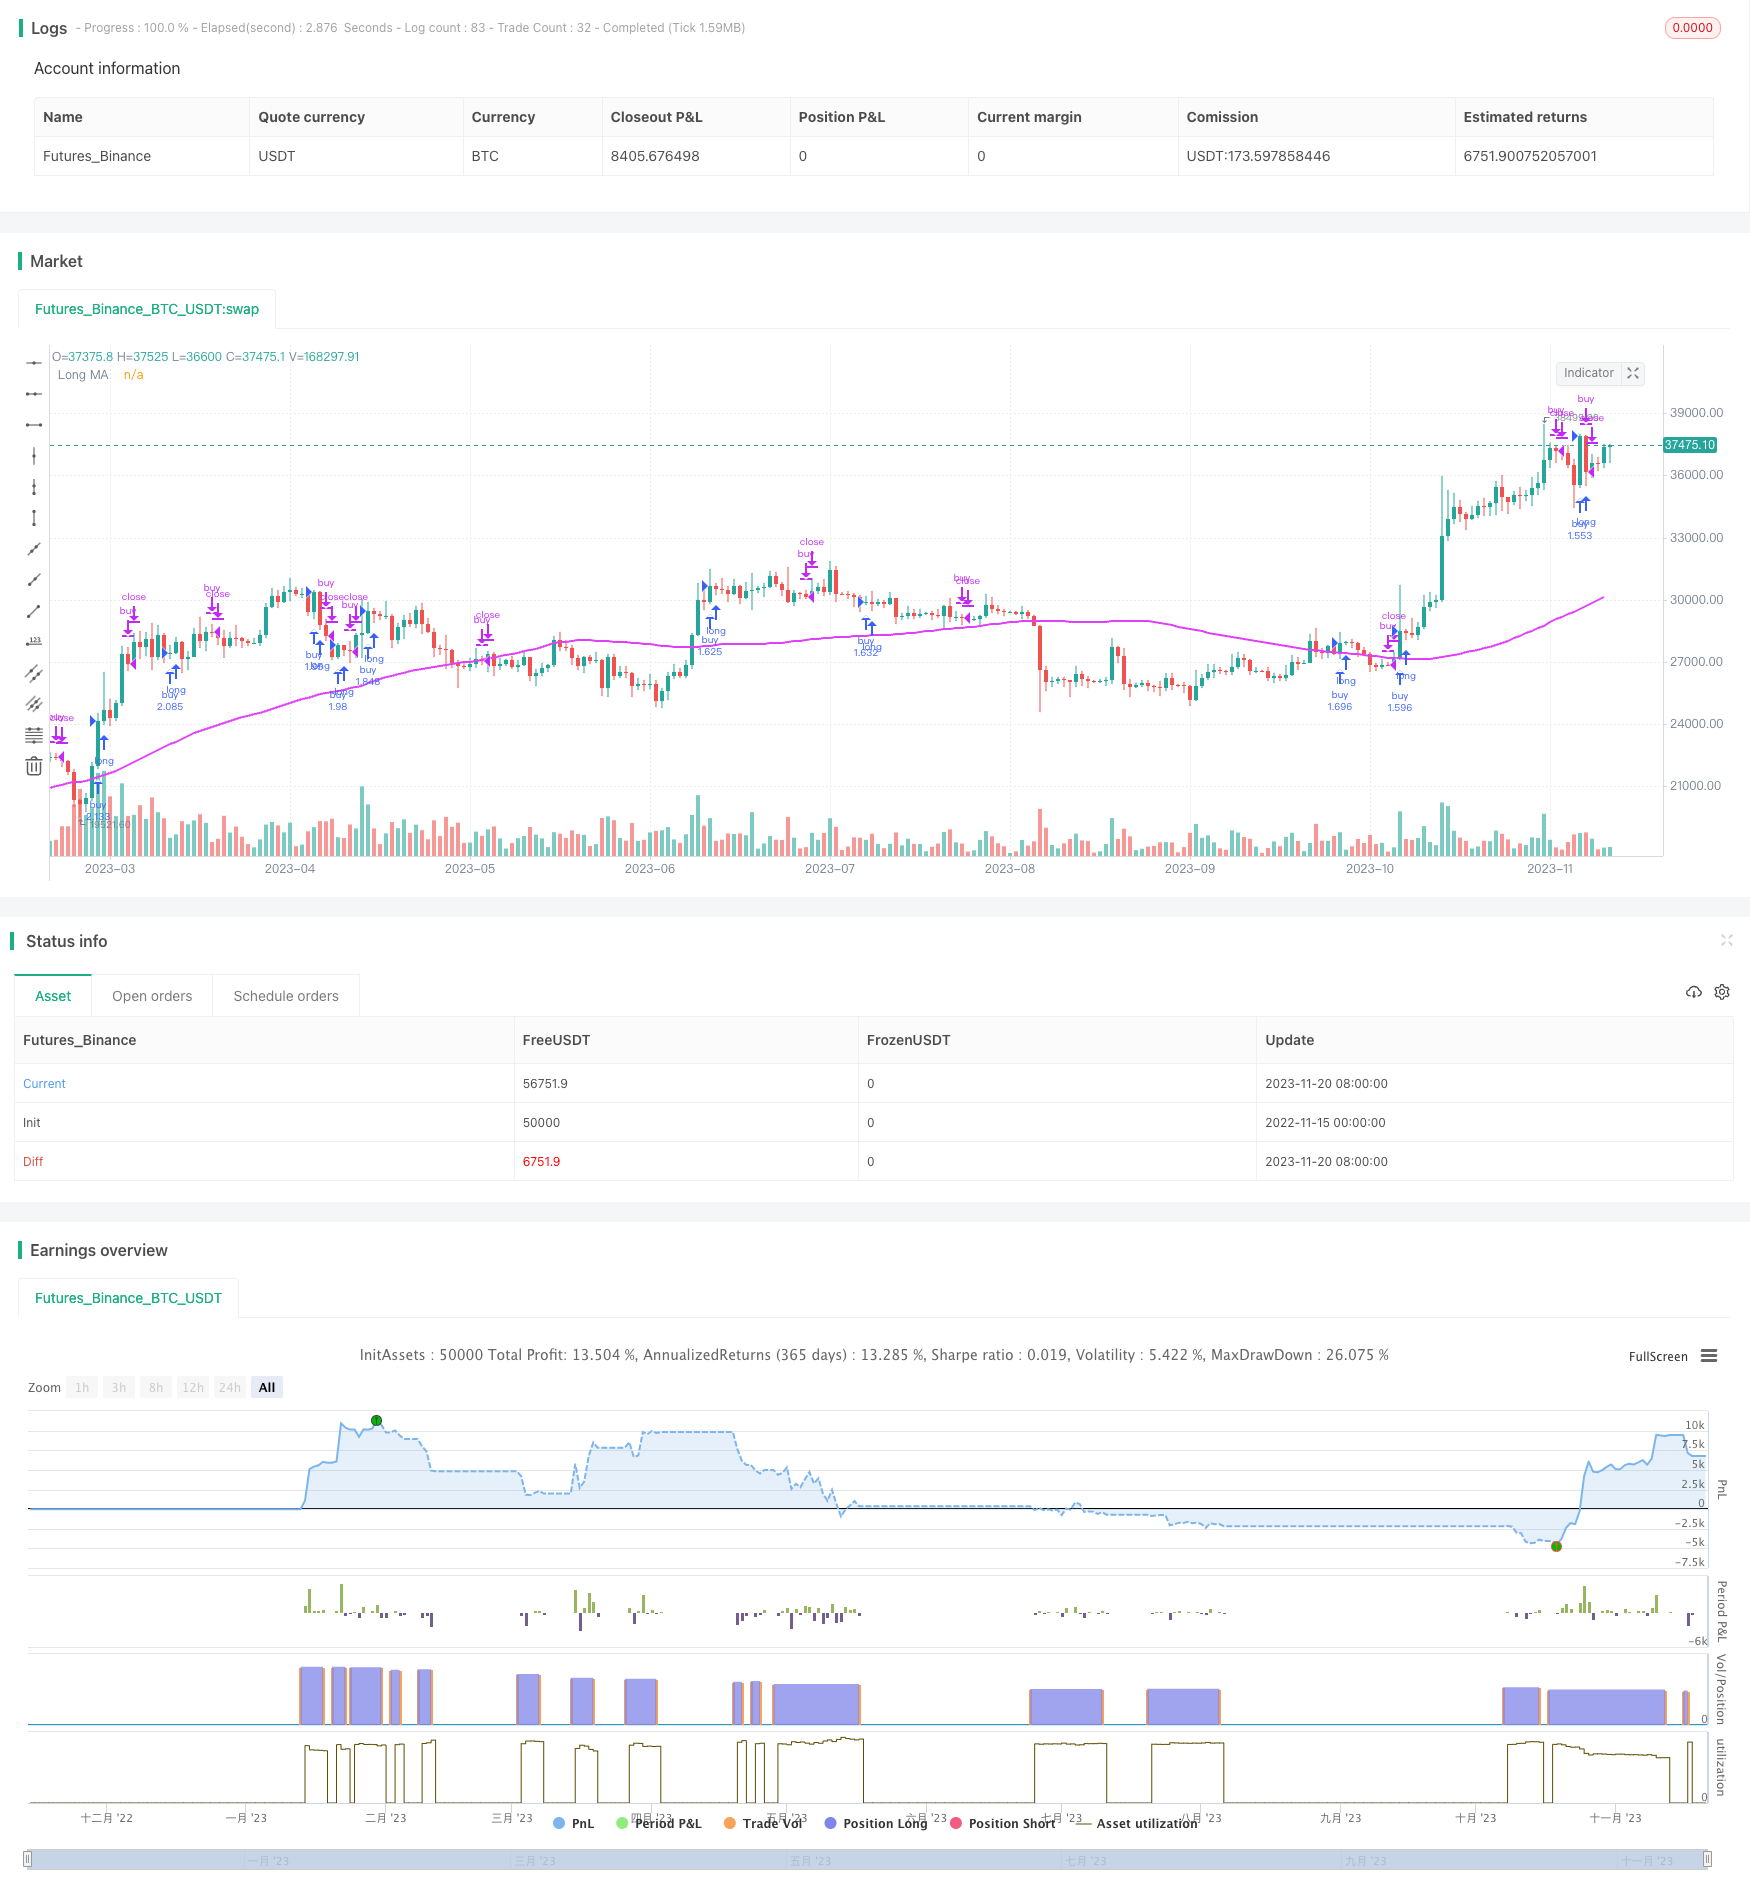
该策略的主要思想是利用快速移动均线和慢速移动均线的交叉来判断市场趋势,并在短线和长线均线发生反转时入场,实现追踪趋势的效果。
|
|
|
|
## 策略原理
|
|
1. 设置快速移动均线周期shortma(默认7天)和慢速移动均线周期longma(默认77天)
|
|
2. 当短线均线上穿长线时判断为买入信号,记录barssince(mabuy),长线意味着进入趋势;当短线均线下穿长线时判断为卖出信号,记录barssince(masell),长线意味着趋势结束
|
|
3. 比较barssince的大小,短线均线从上向下交叉的bar数越多表示趋势持续时间越长;反之,短线均线从下向上交叉栏数越多表示反转信号越强
|
|
4. 当卖出信号的bar数大于买入信号的bar数时发出买入信号;当买入信号的bar数大于卖出信号的bar数时发出卖出信号
|
|
5. such策略本质上是双均线的反转策略,通过快速均线和慢速均线的反转来判断趋势转折点
|
|
|
|
## 策略优势
|
|
1. 使用双均线判断,过滤了部分噪音交易信号
|
|
2. 增加了barssince比较,避免了假断和 Close 价格反转带来的错误信号
|
|
3. 容易理解和实现
|
|
4. 可自定义移动均线参数,适用于不同周期和市场
|
|
|
|
## 策略风险
|
|
1. 双均线策略容易产生较多信号,交易频繁
|
|
2. 移动均线参数设置不当可能错过较长的趋势机会
|
|
3. 当突破长期均线时,止盈点可能会很远,存在较大的回撤
|
|
4. 不能有效过滤螺旋和震荡市
|
|
|
|
## 策略优化方向
|
|
1. 增加其他指标过滤,避免在震荡行情中被套住
|
|
2. 增加止损机制
|
|
3. 优化移动均线参数组合
|
|
4. 根据市场周期动态调整移动均线参数
|
|
|
|
## 总结
|
|
该策略整体来说逻辑清晰易懂,通过快速均线和慢速均线反转来判断市场趋势转折点,在理论上能够有效跟踪趋势。但实际运用中仍需要针对策略算法本身以及参数设置进行优化,使其更加稳定和实战。
|
|
|
|
||
|
|
|
|
|
|
## Overview
|
|
The main idea of this strategy is to use the crossover of fast and slow moving averages to judge market trends and take positions when short-term and long-term moving averages reverse, so as to achieve the effect of tracking trends.
|
|
|
|
## Strategy Logic
|
|
1. Set short-term moving average period shortma (default 7 days) and long-term moving average period longma (default 77 days)
|
|
2. When the short MA crosses over the long MA, it is determined as a buy signal and record barssince(mabuy). The long MA implies an uptrend has begun. When the short MA crosses below the long MA, it is determined as a sell signal and record barssince(masell). The long MA implies the uptrend has ended.
|
|
3. Compare the barssince values. The more bars since the short MA crossed down, the longer the uptrend has persisted. The more bars since the short MA crossed up, the stronger the reversal signal.
|
|
4. When barssince for the sell signal is greater than barssince for the buy signal, a buy signal is triggered. When barssince for the buy signal is greater than barssince for the sell signal, a sell signal is triggered.
|
|
5. Essentially this is a dual MA reversal strategy, using crossover reversals of fast and slow MAs to detect trend reversal points.
|
|
|
|
## Advantages
|
|
1. Uses dual MAs to filter some false signals
|
|
2. Added barssince comparision avoids false breaks and close price reversals
|
|
3. Easy to understand and implement
|
|
4. Customizable MA parameters suit different periods and markets
|
|
|
|
## Risks
|
|
1. Dual MA strategies tend to produce more frequent trading signals
|
|
2. Poor MA parameter tuning may miss longer trends
|
|
3. Stop loss when breaking long term MAs may be distant, leading to larger drawdowns
|
|
4. Cannot effectively filter out coils and oscillations
|
|
|
|
## Enhancement Directions
|
|
1. Add other indicators to avoid whipsaws in ranging markets
|
|
2. Add stop loss mechanisms
|
|
3. Optimize MA parameter combinations
|
|
4. Dynamically tune MA parameters based on market cycle
|
|
|
|
## Summary
|
|
The strategy overall has clear, easy to understand logic, using fast and slow MA reversals to detect trend reversal points. In theory it can effectively track trends. But in actual implementation it still needs optimization of the algorithm itself and tuning of parameters to make it more robust and practical.
|
|
|
|
[/trans]
|
|
|
|
> Strategy Arguments
|
|
|
|
|
|
|
|
|Argument|Default|Description|
|
|
|----|----|----|
|
|
|v_input_1|77|Long MA Input|
|
|
|v_input_2|7|Short MA Input|
|
|
|v_input_3|2017|Backtest Start Year|
|
|
|v_input_4|true|Backtest Start Month|
|
|
|v_input_5|2|Backtest Start Day|
|
|
|v_input_6|2019|Backtest Stop Year|
|
|
|v_input_7|7|Backtest Stop Month|
|
|
|v_input_8|30|Backtest Stop Day|
|
|
|v_input_9|true|Color Background?|
|
|
|
|
|
|
> Source (PineScript)
|
|
|
|
``` pinescript
|
|
/*backtest
|
|
start: 2022-11-15 00:00:00
|
|
end: 2023-11-21 00:00:00
|
|
period: 1d
|
|
basePeriod: 1h
|
|
exchanges: [{"eid":"Futures_Binance","currency":"BTC_USDT"}]
|
|
*/
|
|
|
|
//@version=3
|
|
strategy("Up Down", "Up Down", precision = 6, pyramiding = 1, default_qty_type = strategy.percent_of_equity, default_qty_value = 99, commission_type = strategy.commission.percent, commission_value = 0.0, initial_capital = 1000, overlay = true)
|
|
|
|
buy = close > open and open > close[1]
|
|
sell = close < open and open < close[1]
|
|
|
|
longma = input(77,"Long MA Input")
|
|
shortma = input(7,"Short MA Input")
|
|
long = sma(close,longma)
|
|
short = sma(close, shortma)
|
|
mabuy = crossover(short,long) or buy and short > long
|
|
masell = crossunder(short,long) or sell and short > long
|
|
|
|
num_bars_buy = barssince(mabuy)
|
|
num_bars_sell = barssince(masell)
|
|
//plot(num_bars_buy, color = teal)
|
|
//plot(num_bars_sell, color = orange)
|
|
|
|
xbuy = crossover(num_bars_sell, num_bars_buy)
|
|
xsell = crossunder(num_bars_sell, num_bars_buy)
|
|
plotshape(xbuy,"Buy Up Arrow", shape.triangleup, location.belowbar, white, size = size.tiny)
|
|
plotshape(xsell,"Sell Down Arrow", shape.triangledown, location.abovebar, white, size = size.tiny)
|
|
plot(long,"Long MA", fuchsia, 2)
|
|
|
|
// Component Code Start
|
|
// Example usage:
|
|
// if testPeriod()
|
|
// strategy.entry("LE", strategy.long)
|
|
testStartYear = input(2017, "Backtest Start Year")
|
|
testStartMonth = input(01, "Backtest Start Month")
|
|
testStartDay = input(2, "Backtest Start Day")
|
|
testPeriodStart = timestamp(testStartYear,testStartMonth,testStartDay,0,0)
|
|
|
|
testStopYear = input(2019, "Backtest Stop Year")
|
|
testStopMonth = input(7, "Backtest Stop Month")
|
|
testStopDay = input(30, "Backtest Stop Day")
|
|
testPeriodStop = timestamp(testStopYear,testStopMonth,testStopDay,0,0)
|
|
|
|
// A switch to control background coloring of the test period
|
|
testPeriodBackground = input(title="Color Background?", type=bool, defval=true)
|
|
testPeriodBackgroundColor = testPeriodBackground and (time >= testPeriodStart) and (time <= testPeriodStop) ? #00FF00 : na
|
|
bgcolor(testPeriodBackgroundColor, transp=97)
|
|
|
|
testPeriod() => true
|
|
// Component Code Stop
|
|
|
|
if testPeriod()
|
|
strategy.entry("buy", true, when = xbuy, limit = close)
|
|
strategy.close("buy", when = xsell)
|
|
|
|
```
|
|
|
|
> Detail
|
|
|
|
https://www.fmz.com/strategy/432848
|
|
|
|
> Last Modified
|
|
|
|
2023-11-22 10:07:19
|