
269 lines
18 KiB
Markdown
269 lines
18 KiB
Markdown
|
|
> Name
|
|
|
|
双指数移动平均趋势震荡器策略基于标准差动态调整的量化交易模型-Dual-Exponential-Moving-Average-Trend-Oscillator-Strategy-A-Standard-Deviation-Based-Dynamic-Quantitative-Trading-Model
|
|
|
|
> Author
|
|
|
|
ianzeng123
|
|
|
|
> Strategy Description
|
|
|
|
|
|
|
|
|
|
|
|
|
|
[trans]
|
|
|
|
# 概述
|
|
|
|
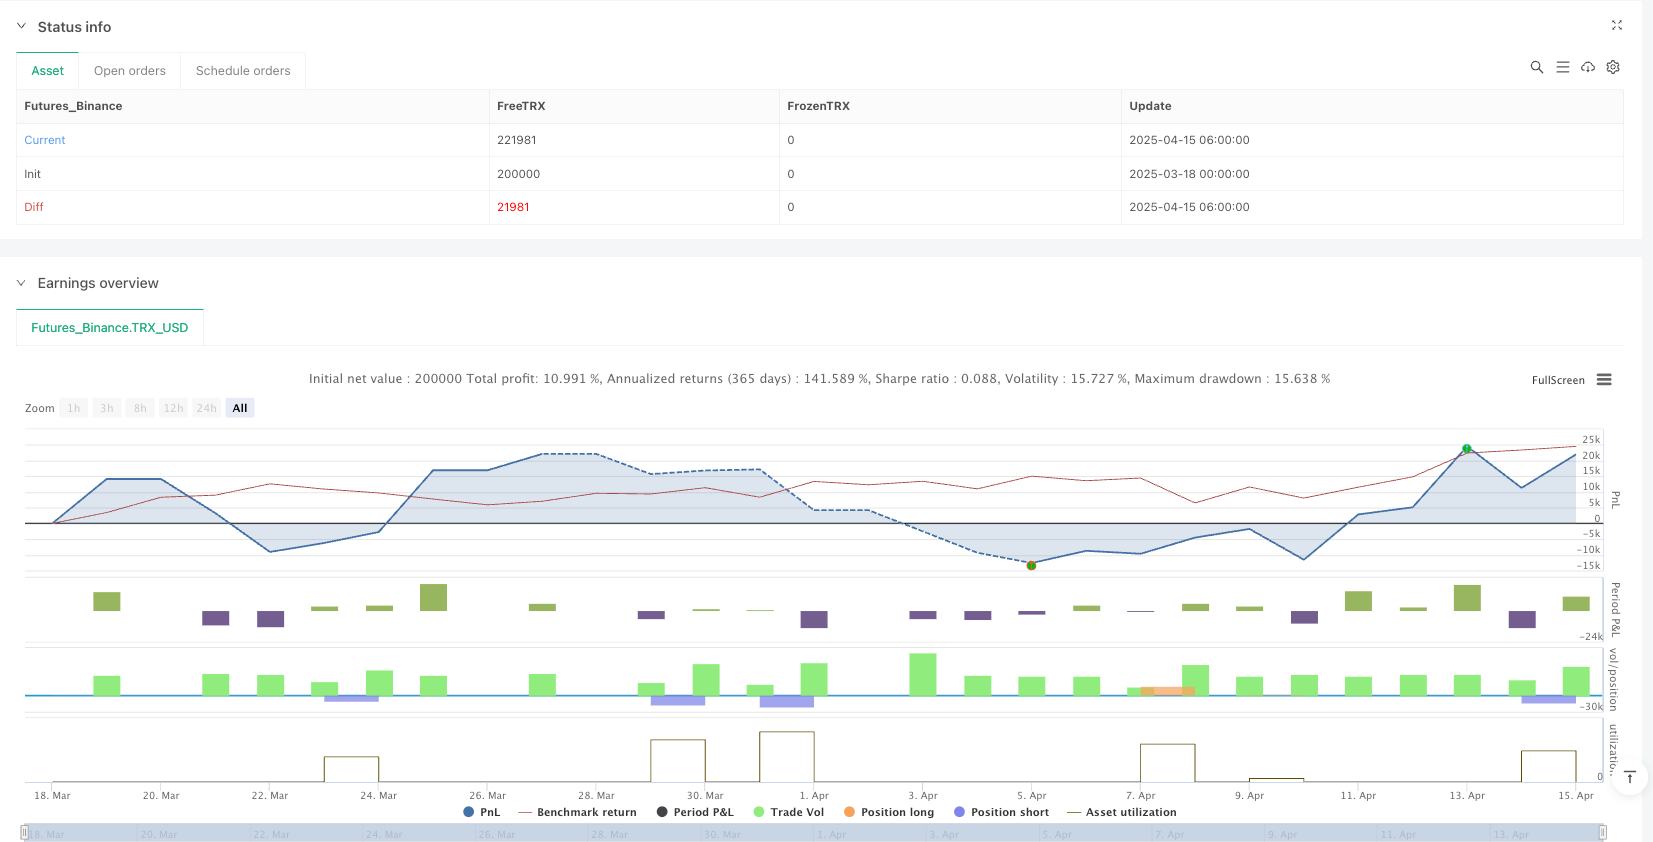
双指数移动平均趋势震荡器策略是一种动态趋势跟踪方法,基于标准化的DEMA震荡器和标准差波动带。该策略能实时适应市场波动性,旨在提高入场准确度并优化风险管理。核心机制是通过将DEMA值标准化到0-100区间,直观识别趋势强度,并结合双柱确认过滤器和ATR倍数追踪止损,以提高策略的可靠性和盈利能力。这是一个适用于各种市场条件的综合量化交易系统,特别适合寻求在趋势市场中获得一致性表现的交易者。
|
|
|
|
#### 策略原理
|
|
|
|
双指数移动平均趋势震荡器策略的核心逻辑建立在多层技术指标融合基础上:
|
|
|
|
1. 双指数移动平均线(DEMA)计算:通过函数F_DEMA实现,公式为2 * E1 - E2,其中E1是价格的EMA,E2是E1的EMA。这种计算方法减少了延迟,使指标对价格变动更加敏感。
|
|
|
|
2. 标准化过程:策略使用BASE(DEMA的SMA)和SD(DEMA的标准差乘以2)创建上下波动带(upperSD和lowerSD)。随后通过公式NormBase = 100 * (DEMA - lowerSD)/(upperSD - lowerSD)将DEMA值标准化到0-100范围内。
|
|
|
|
3. 入场条件:
|
|
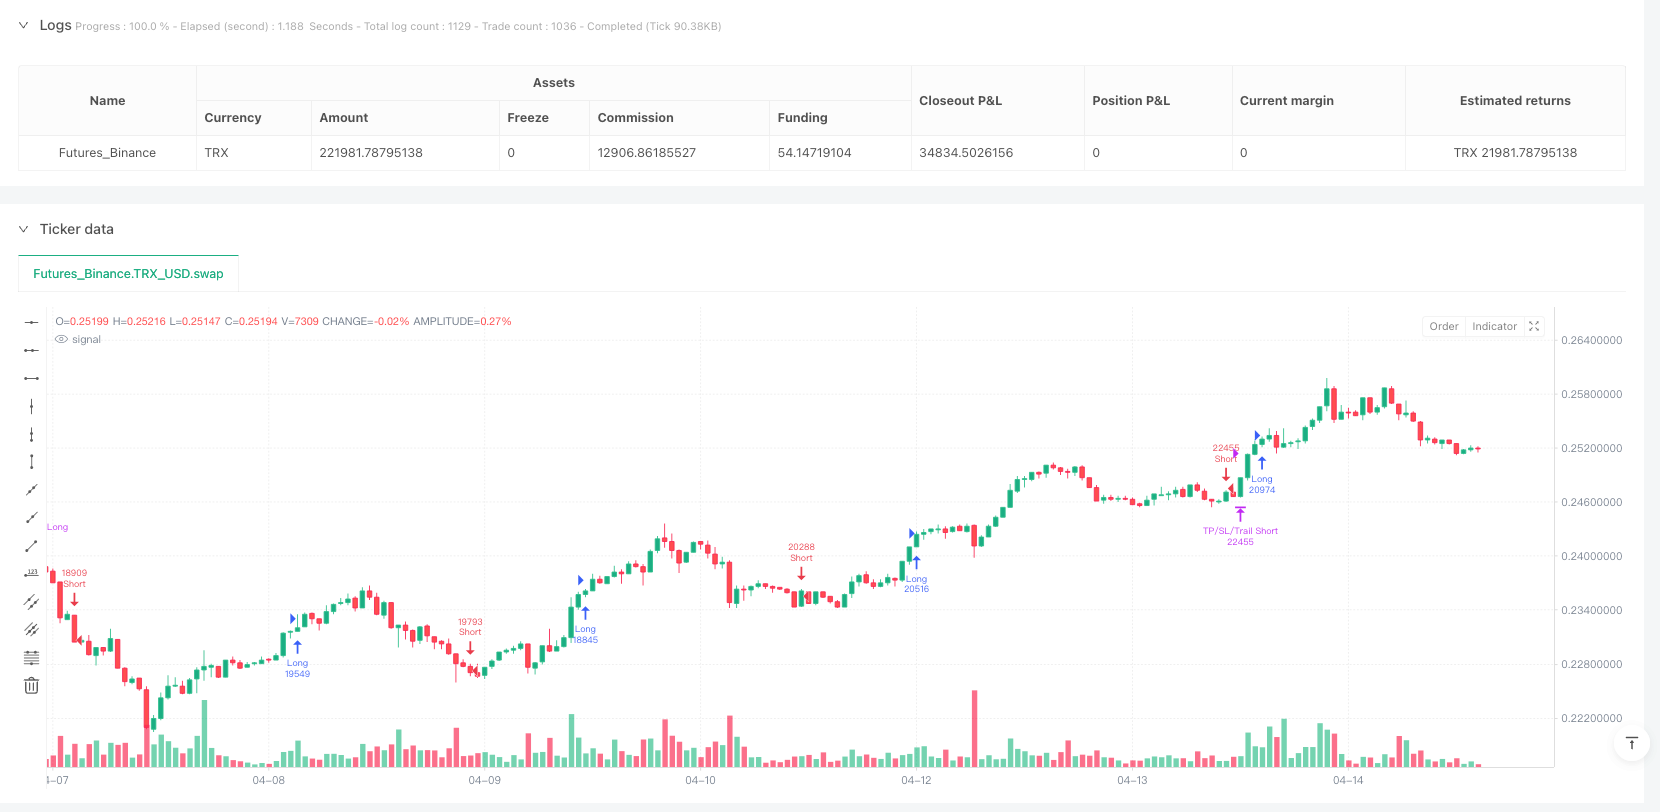
- 多头入场:当NormBase > 55且蜡烛低点高于上SD带,同时前一蜡烛形成看涨形态
|
|
- 空头入场:当NormBase < 45且蜡烛高点低于下SD带,同时前一蜡烛形成看跌形态
|
|
|
|
4. 风险管理:策略采用三重退出机制 - 固定止损位于SD带,动态止盈设置为风险回报比1.5倍,以及基于ATR的追踪止损(默认为ATR的2倍)。
|
|
|
|
5. 交易方向控制:通过lastDirection变量确保不会在同一方向连续入场,提高资金使用效率。
|
|
|
|
代码实现了参数可调整性,使交易者能根据不同市场条件和个人风险偏好进行优化。
|
|
|
|
#### 策略优势
|
|
|
|
通过深入分析代码,双指数移动平均趋势震荡器策略展现出多方面优势:
|
|
|
|
1. 减少信号延迟:DEMA本身比传统EMA和SMA具有更低的滞后性,对价格变动响应更快,加上标准化处理,使趋势识别更加及时准确。
|
|
|
|
2. 智能过滤机制:要求两个连续的看涨或看跌蜡烛作为确认,显著减少了市场噪音,降低了虚假信号的可能性。
|
|
|
|
3. 自适应波动带:通过标准差动态调整波动带宽度,使策略能够自动适应不同的市场波动条件,在低波动期间收缩,高波动期间扩张。
|
|
|
|
4. 多层风险管理:结合固定止损、风险回报比率止盈和ATR追踪止损的三重保护机制,既保护资金安全,又能在强趋势中最大化收益。
|
|
|
|
5. 视觉直观性:策略在图表上显示上下SD波动带和入场信号箭头,使交易者能够直观理解市场状态和策略逻辑。
|
|
|
|
6. 参数灵活性:所有核心参数均可调整,包括DEMA周期、基线长度、入场阈值和风险管理设置,使策略能适应不同交易品种和时间框架。
|
|
|
|
7. 代码结构清晰:策略实现简洁明了,便于理解和后续优化,降低了策略实施的技术门槛。
|
|
|
|
#### 策略风险
|
|
|
|
尽管该策略设计精良,仍存在几个值得注意的风险点:
|
|
|
|
1. 震荡市场表现不佳:作为一个趋势跟踪策略,在无明显趋势的盘整市场中可能产生频繁的虚假信号,导致连续小额亏损。解决方法是增加趋势强度过滤器或在识别到盘整市场时暂停交易。
|
|
|
|
2. 参数敏感性:策略性能对DEMA周期、入场阈值和SD乘数等参数高度敏感。不当的参数设置可能导致过拟合或响应过慢。建议通过回测在多个市场周期验证参数稳健性。
|
|
|
|
3. 止损压力:在高波动市场,固定止损位于SD带可能相对较近,导致在价格正常波动中被触发。可考虑根据市场波动性动态调整止损距离。
|
|
|
|
4. 方向转换延迟:由于策略使用lastDirection变量控制交易方向,可能在剧烈反转市场中错过重要的反向信号。可以考虑增加趋势反转检测机制。
|
|
|
|
5. 资金管理风险:代码默认使用账户权益百分比(100%)进行仓位管理,对于实盘交易过于激进。应当根据个人风险承受能力调低此值,建议不超过5-10%。
|
|
|
|
6. 执行延迟:在实际交易中,订单执行延迟和滑点可能导致入场价格与理想条件有偏差。建议在回测中加入更现实的滑点设置(已包含2点滑点),并考虑使用限价单替代市价单。
|
|
|
|
#### 策略优化方向
|
|
|
|
基于代码分析,策略可在以下几个方向进一步优化:
|
|
|
|
1. 市场环境自适应:引入市场类型识别机制,如ADX或波动率基准,在低趋势性市场自动调整阈值或暂停交易,从而避免震荡市场的频繁亏损。
|
|
|
|
2. 动态参数优化:实现DEMA周期和阈值的动态调整,根据不同时间框架的市场波动特性自动优化参数,提高策略适应性。
|
|
|
|
3. 多时间框架确认:增加更高时间框架的趋势确认,只在与更高时间框架趋势一致时入场,提高信号质量和胜率。
|
|
|
|
4. 改进退出机制:当前的固定风险回报比率可能不适应所有市场条件,考虑基于支撑阻力位、波动率百分比或动态目标的智能止盈策略。
|
|
|
|
5. 仓位规模优化:引入基于波动率的动态仓位调整,在低波动高确定性环境增加仓位,高波动环境减少仓位,优化资金曲线平滑度。
|
|
|
|
6. 增强过滤机制:除双柱确认外,可增加交易量确认、价格形态识别或关键价位突破确认,进一步减少虚假信号。
|
|
|
|
7. 情绪指标整合:考虑整合市场情绪指标如RSI或MACD背离,识别潜在的趋势疲软或反转信号,提高策略的预测性。
|
|
|
|
8. 回测稳健性:扩展回测区间跨越不同市场环境,并实施步进优化以验证参数稳定性,避免过拟合特定市场周期。
|
|
|
|
以上优化有助于提高策略的稳健性、适应性和长期盈利能力,特别是在面对不同市场条件时的表现。
|
|
|
|
#### 总结
|
|
|
|
双指数移动平均趋势震荡器策略是一个设计精良的量化交易系统,通过融合DEMA技术指标、标准差波动带和ATR追踪止损,创建了一个平衡响应速度和信号准确性的解决方案。其核心优势在于自适应市场波动的能力和多层风险管理机制,使策略在趋势市场中表现出色。
|
|
|
|
通过双柱确认过滤和标准化处理,该策略有效减少了假信号,提高了入场准确性。同时,三重退出机制确保了在保护资金的同时最大化利润潜力。策略的可视化元素和清晰的代码结构使其易于理解和操作,适合各经验水平的交易者使用。
|
|
|
|
尽管该策略在震荡市场可能面临挑战,但通过建议的优化方向,尤其是市场环境识别和多时间框架确认,可以进一步增强其适应性和稳健性。最终,双指数移动平均趋势震荡器策略提供了一个坚实的框架,交易者可以根据个人风险偏好和市场环境进行定制和调整,实现长期一致的交易表现。 ||
|
|
|
|
# Overview
|
|
|
|
The Dual Exponential Moving Average Trend Oscillator Strategy is a dynamic trend-following approach based on the Normalized DEMA Oscillator and Standard Deviation bands. It adapts in real-time to market volatility with the goal of improving entry accuracy and optimizing risk management. The core mechanism involves normalizing DEMA values on a 0-100 scale for intuitive identification of trend strength, combined with a two-bar confirmation filter and ATR-multiple trailing stops to enhance reliability and profitability. This is a comprehensive quantitative trading system suitable for various market conditions, particularly for traders seeking consistent performance in trending markets.
|
|
|
|
#### Strategy Principles
|
|
|
|
The Dual Exponential Moving Average Trend Oscillator Strategy's core logic is built on multiple layers of technical indicators:
|
|
|
|
1. Dual Exponential Moving Average (DEMA) calculation: Implemented through the F_DEMA function with the formula 2 * E1 - E2, where E1 is the EMA of price and E2 is the EMA of E1. This calculation method reduces lag, making the indicator more responsive to price movements.
|
|
|
|
2. Normalization process: The strategy uses BASE (SMA of DEMA) and SD (standard deviation of DEMA multiplied by 2) to create upper and lower bands (upperSD and lowerSD). Subsequently, DEMA values are normalized to a 0-100 range using the formula NormBase = 100 * (DEMA - lowerSD)/(upperSD - lowerSD).
|
|
|
|
3. Entry conditions:
|
|
- Long entry: When NormBase > 55 and the candle low is above the upper SD band, with the previous candle forming a bullish pattern
|
|
- Short entry: When NormBase < 45 and the candle high is below the lower SD band, with the previous candle forming a bearish pattern
|
|
|
|
4. Risk management: The strategy employs a triple exit mechanism - fixed stop-loss at the SD band, dynamic take-profit set at a risk-reward ratio of 1.5, and an ATR-based trailing stop (default at 2x ATR).
|
|
|
|
5. Trade direction control: The lastDirection variable ensures no consecutive entries in the same direction, improving capital efficiency.
|
|
|
|
The code implements parameter adjustability, allowing traders to optimize based on different market conditions and individual risk preferences.
|
|
|
|
#### Strategy Advantages
|
|
|
|
Through in-depth code analysis, the Dual Exponential Moving Average Trend Oscillator Strategy demonstrates multiple advantages:
|
|
|
|
1. Reduced signal lag: DEMA itself has lower lag than traditional EMA and SMA, responding faster to price movements. With normalization processing, trend identification becomes more timely and accurate.
|
|
|
|
2. Intelligent filtering mechanism: Requiring two consecutive bullish or bearish candles for confirmation significantly reduces market noise and the possibility of false signals.
|
|
|
|
3. Adaptive volatility bands: The standard deviation dynamically adjusts band width, enabling the strategy to automatically adapt to different market volatility conditions, contracting during low volatility and expanding during high volatility.
|
|
|
|
4. Multi-layered risk management: The triple protection mechanism combining fixed stop-loss, risk-reward ratio take-profit, and ATR trailing stop both protects capital safety and maximizes returns in strong trends.
|
|
|
|
5. Visual intuitiveness: The strategy displays upper and lower SD bands and entry signal arrows on the chart, allowing traders to visually understand market conditions and strategy logic.
|
|
|
|
6. Parameter flexibility: All core parameters are adjustable, including DEMA period, base length, entry thresholds, and risk management settings, making the strategy adaptable to different trading instruments and timeframes.
|
|
|
|
7. Clear code structure: The strategy implementation is concise and easy to understand, facilitating subsequent optimization and lowering the technical barrier to strategy implementation.
|
|
|
|
#### Strategy Risks
|
|
|
|
Despite its well-designed structure, several noteworthy risks exist:
|
|
|
|
1. Poor performance in ranging markets: As a trend-following strategy, it may generate frequent false signals in consolidating markets without clear trends, leading to consecutive small losses. The solution is to add a trend strength filter or pause trading when ranging markets are identified.
|
|
|
|
2. Parameter sensitivity: Strategy performance is highly sensitive to parameters such as DEMA period, entry thresholds, and SD multiplier. Inappropriate parameter settings may lead to overfitting or slow response. It's recommended to validate parameter robustness through backtesting across multiple market cycles.
|
|
|
|
3. Stop-loss pressure: In highly volatile markets, fixed stop-loss at the SD band may be relatively close, triggering during normal price fluctuations. Consider dynamically adjusting stop-loss distance based on market volatility.
|
|
|
|
4. Direction change delay: As the strategy uses the lastDirection variable to control trade direction, it may miss important reversal signals in rapidly reversing markets. Consider adding a trend reversal detection mechanism.
|
|
|
|
5. Capital management risk: The code defaults to using account equity percentage (100%) for position sizing, which is too aggressive for live trading. This value should be adjusted according to personal risk tolerance, preferably not exceeding 5-10%.
|
|
|
|
6. Execution delay: In actual trading, order execution delays and slippage may cause entry prices to deviate from ideal conditions. It's advisable to include more realistic slippage settings in backtesting (2 pips slippage is already included) and consider using limit orders instead of market orders.
|
|
|
|
#### Strategy Optimization Directions
|
|
|
|
Based on code analysis, the strategy can be further optimized in the following directions:
|
|
|
|
1. Market environment adaptation: Introduce market type recognition mechanisms, such as ADX or volatility benchmarks, to automatically adjust thresholds or pause trading in low-trend markets, thereby avoiding frequent losses in ranging conditions.
|
|
|
|
2. Dynamic parameter optimization: Implement dynamic adjustment of DEMA periods and thresholds, automatically optimizing parameters based on market volatility characteristics across different timeframes, improving strategy adaptability.
|
|
|
|
3. Multi-timeframe confirmation: Add higher timeframe trend confirmation, only entering when aligned with higher timeframe trends, improving signal quality and win rate.
|
|
|
|
4. Improved exit mechanism: The current fixed risk-reward ratio may not adapt to all market conditions. Consider intelligent take-profit strategies based on support/resistance levels, volatility percentages, or dynamic targets.
|
|
|
|
5. Position size optimization: Introduce volatility-based dynamic position adjustment, increasing position size in low-volatility high-certainty environments and decreasing in high-volatility environments, optimizing equity curve smoothness.
|
|
|
|
6. Enhanced filtering mechanism: In addition to two-bar confirmation, add volume confirmation, price pattern recognition, or key level breakout confirmation to further reduce false signals.
|
|
|
|
7. Sentiment indicator integration: Consider integrating market sentiment indicators such as RSI or MACD divergence to identify potential trend weakness or reversal signals, enhancing strategy predictiveness.
|
|
|
|
8. Backtesting robustness: Extend backtesting intervals across different market environments and implement walk-forward optimization to verify parameter stability, avoiding overfitting to specific market cycles.
|
|
|
|
These optimizations help improve the strategy's robustness, adaptability, and long-term profitability, especially when facing different market conditions.
|
|
|
|
#### Summary
|
|
|
|
The Dual Exponential Moving Average Trend Oscillator Strategy is a well-designed quantitative trading system that creates a solution balancing response speed and signal accuracy by integrating DEMA technical indicators, standard deviation bands, and ATR trailing stops. Its core advantages lie in its ability to adapt to market volatility and its multi-layered risk management mechanisms, enabling the strategy to excel in trending markets.
|
|
|
|
Through two-bar confirmation filtering and normalization processing, the strategy effectively reduces false signals and improves entry accuracy. Meanwhile, the triple exit mechanism ensures profit potential is maximized while protecting capital. The strategy's visualization elements and clear code structure make it easy to understand and operate, suitable for traders of all experience levels.
|
|
|
|
Although the strategy may face challenges in ranging markets, through the suggested optimization directions, particularly market environment recognition and multi-timeframe confirmation, its adaptability and robustness can be further enhanced. Ultimately, the Dual Exponential Moving Average Trend Oscillator Strategy provides a solid framework that traders can customize and adjust according to personal risk preferences and market environments to achieve long-term consistent trading performance.[/trans]
|
|
|
|
|
|
|
|
> Source (PineScript)
|
|
|
|
``` pinescript
|
|
/*backtest
|
|
start: 2025-03-18 00:00:00
|
|
end: 2025-04-15 08:00:00
|
|
period: 1h
|
|
basePeriod: 1h
|
|
exchanges: [{"eid":"Futures_Binance","currency":"TRX_USD"}]
|
|
*/
|
|
|
|
// This Pine Script® code is subject to the terms of the Mozilla Public License 2.0 at https://mozilla.org/MPL/2.0/
|
|
// © PakunFX
|
|
|
|
//@version=6
|
|
strategy("DEMA Trend Oscillator Strategy", overlay=true, default_qty_type=strategy.percent_of_equity, default_qty_value=100)
|
|
|
|
// === INPUTS ===
|
|
src_dema = input.source(close, "Calculation src_dema (Dema)")
|
|
len_dema = input.int(40, "Dema Period")
|
|
base_len = input.int(20, 'Base length')
|
|
Lu = input.float(55, 'Long Threshold')
|
|
Su = input.float(45, 'Short Threshold')
|
|
RR = input.float(1.5, "Risk Reward Ratio", step=0.1)
|
|
trailATRmult = input.float(2.0, "ATR Multiplier for Trailing Stop", step=0.1)
|
|
|
|
// === FUNCTION ===
|
|
F_DEMA(SRC, LEN) =>
|
|
E1 = ta.ema(SRC, LEN)
|
|
E2 = ta.ema(E1, LEN)
|
|
2 * E1 - E2
|
|
|
|
// === DEMA & NORMALIZATION ===
|
|
DEMA = F_DEMA(src_dema, len_dema)
|
|
BASE = ta.sma(DEMA, base_len)
|
|
SD = ta.stdev(DEMA, base_len) * 2
|
|
upperSD = BASE + SD
|
|
lowerSD = BASE - SD
|
|
NormBase = 100 * (DEMA - lowerSD)/(upperSD - lowerSD)
|
|
|
|
// === ENTRY CONDITIONS ===
|
|
long_cond = NormBase > Lu and low > upperSD
|
|
short_cond = NormBase < Su and high < lowerSD
|
|
|
|
// === DELAYED ENTRY TRIGGERS ===
|
|
long_trigger = long_cond[1]
|
|
short_trigger = short_cond[1]
|
|
|
|
// === ATR-BASED TRAILING STOP ===
|
|
atr = ta.atr(14)
|
|
trail_offset = atr * trailATRmult
|
|
trail_points = trail_offset / syminfo.mintick
|
|
|
|
// === TRADE DIRECTION CONTROL ===
|
|
var string lastDirection = "none"
|
|
|
|
// === ENTRY LOGIC ===
|
|
if long_trigger and lastDirection != "long"
|
|
strategy.entry("Long", strategy.long)
|
|
strategy.exit("TP/SL/Trail Long", from_entry="Long", stop=upperSD, limit=close + (close - upperSD) * RR, trail_points=trail_points, trail_offset=trail_points)
|
|
lastDirection := "long"
|
|
|
|
if short_trigger and lastDirection != "short"
|
|
strategy.entry("Short", strategy.short)
|
|
strategy.exit("TP/SL/Trail Short", from_entry="Short", stop=lowerSD, limit=close - (lowerSD - close) * RR, trail_points=trail_points, trail_offset=trail_points)
|
|
lastDirection := "short"
|
|
|
|
```
|
|
|
|
> Detail
|
|
|
|
https://www.fmz.com/strategy/491035
|
|
|
|
> Last Modified
|
|
|
|
2025-04-18 09:19:05
|