
155 lines
7.1 KiB
Markdown
155 lines
7.1 KiB
Markdown
|
|
> Name
|
|
|
|
双均线RSI趋势动量策略-Dual-Moving-Average-RSI-Trend-Momentum-Strategy
|
|
|
|
> Author
|
|
|
|
ChaoZhang
|
|
|
|
> Strategy Description
|
|
|
|
|
|
|
|
[trans]
|
|
#### 概述
|
|
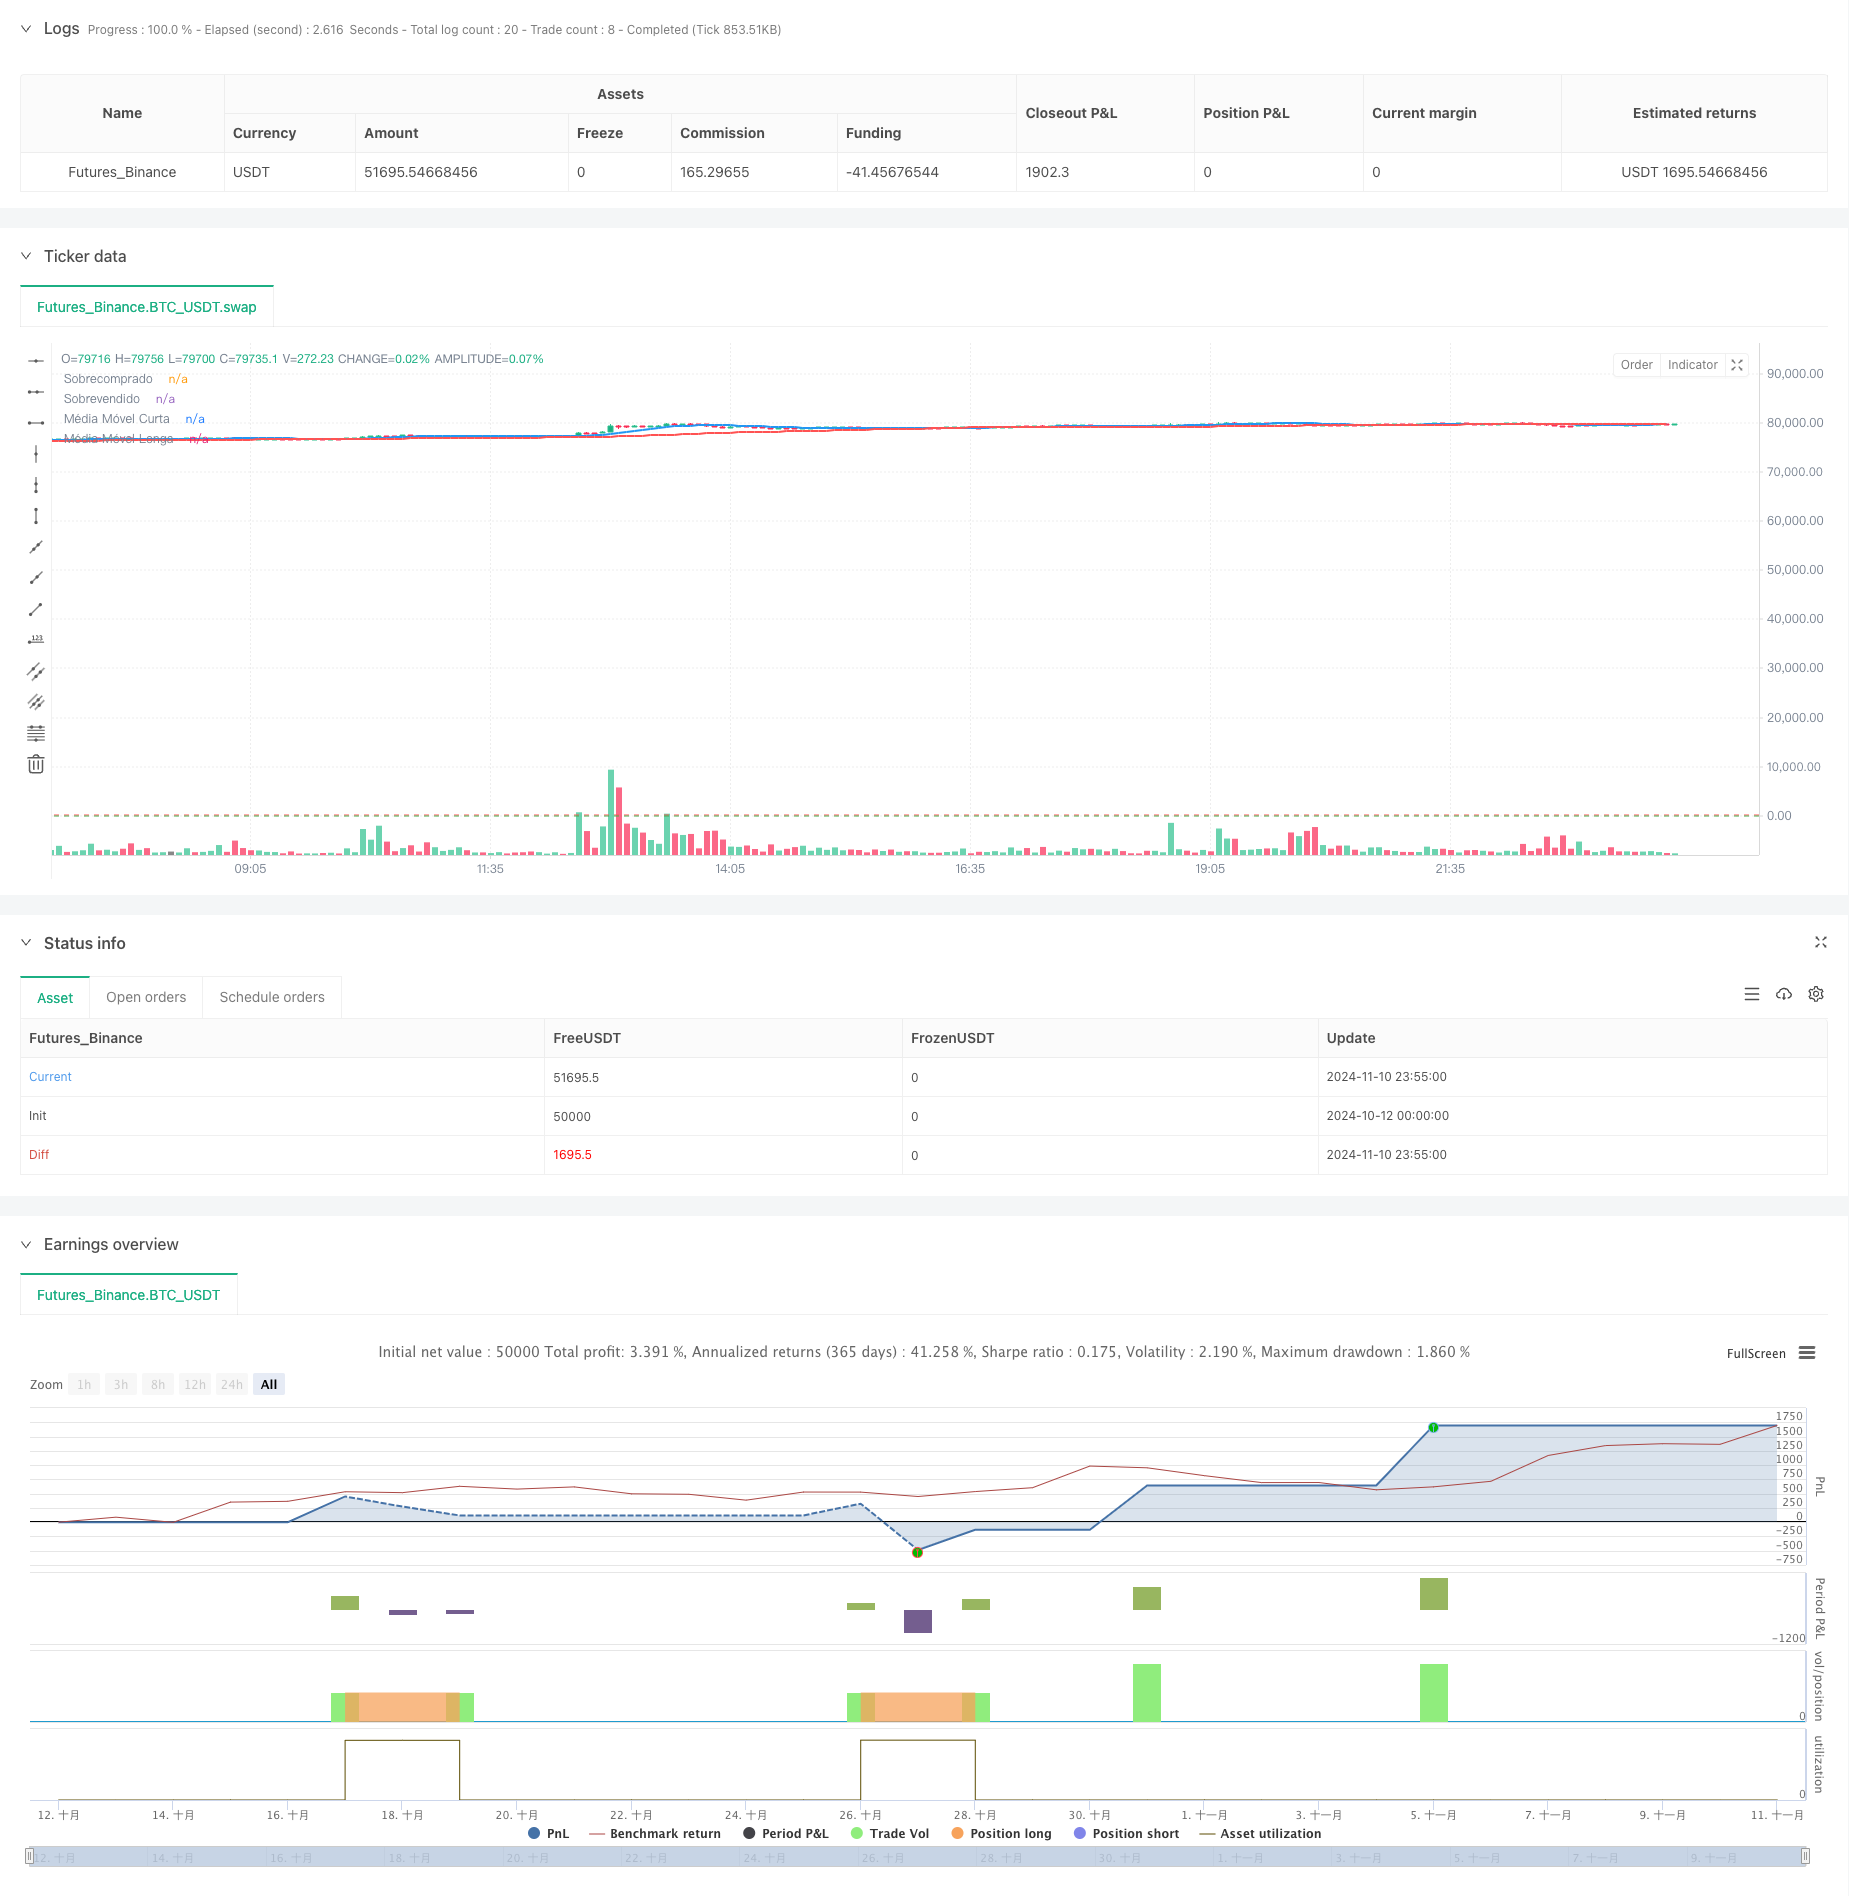
本策略是一个结合了双均线和RSI指标的趋势跟踪交易系统。策略通过短期和长期移动平均线的交叉来确定市场趋势方向,同时利用RSI指标在超买超卖区域寻找更优的入场时机,实现趋势跟踪与动量反转的完美结合。策略采用百分比资金管理方式,每次交易投入账户总额的10%,有效控制风险。
|
|
|
|
#### 策略原理
|
|
策略使用10周期和50周期的简单移动平均线(SMA)来识别趋势。当短期均线上穿长期均线且RSI低于30时,系统发出做多信号;当短期均线下穿长期均线且RSI高于70时,系统发出做空信号。平仓方面,当RSI超过70时平掉多单,当RSI低于30时平掉空单。这种设计既保证了趋势方向的准确性,又能在价格超涨超跌时及时止盈。
|
|
|
|
#### 策略优势
|
|
1. 结合趋势和动量双重确认,提高交易成功率
|
|
2. 采用百分比资金管理,有效控制风险
|
|
3. 设置明确的入场和出场条件,避免主观判断
|
|
4. 充分利用RSI指标的超买超卖特性
|
|
5. 策略逻辑清晰,易于理解和执行
|
|
6. 适用于不同市场环境,具有较强的适应性
|
|
|
|
#### 策略风险
|
|
1. 在震荡市场中可能产生过多假信号
|
|
2. RSI指标在强趋势中可能长期处于超买超卖区域
|
|
3. 双均线系统存在一定滞后性
|
|
4. 固定的参数设置可能不适合所有市场环境
|
|
建议通过以下方式管理风险:
|
|
- 设置止损位
|
|
- 动态调整参数
|
|
- 增加趋势确认指标
|
|
- 控制单笔交易规模
|
|
|
|
#### 策略优化方向
|
|
1. 引入自适应参数机制,根据市场波动率动态调整均线周期
|
|
2. 增加趋势强度过滤器,避免在弱趋势中交易
|
|
3. 优化资金管理系统,根据市场波动调整仓位大小
|
|
4. 加入更多技术指标进行交易确认
|
|
5. 开发动态止损机制,提高资金利用效率
|
|
|
|
#### 总结
|
|
这是一个将趋势跟踪与动量反转完美结合的量化交易策略。通过双均线判断趋势方向,利用RSI寻找最优入场点,既保证了交易方向的准确性,又能在价格超涨超跌时及时获利了结。策略的成功关键在于参数的合理设置和风险的有效控制。通过不断优化和改进,策略有望在不同市场环境下都能取得稳定收益。
|
|
|
|
||
|
|
|
|
#### Overview
|
|
This strategy is a trend-following trading system that combines dual moving averages with the RSI indicator. It determines market trend direction through crossovers of short-term and long-term moving averages while utilizing RSI indicator for optimal entry points in overbought and oversold areas, achieving a perfect combination of trend following and momentum reversal. The strategy employs percentage-based money management, investing 10% of the total account balance per trade for effective risk control.
|
|
|
|
#### Strategy Principles
|
|
The strategy uses 10-period and 50-period Simple Moving Averages (SMA) to identify trends. Buy signals are generated when the short-term MA crosses above the long-term MA and RSI is below 30, while sell signals occur when the short-term MA crosses below the long-term MA and RSI is above 70. For position closing, long positions are closed when RSI exceeds 70, and short positions are closed when RSI falls below 30. This design ensures both trend direction accuracy and timely profit-taking at price extremes.
|
|
|
|
#### Strategy Advantages
|
|
1. Combines trend and momentum confirmation to improve trade success rate
|
|
2. Implements percentage-based money management for effective risk control
|
|
3. Sets clear entry and exit conditions to avoid subjective judgment
|
|
4. Fully utilizes RSI indicator's overbought and oversold characteristics
|
|
5. Clear strategy logic that's easy to understand and execute
|
|
6. Adaptable to different market environments with strong versatility
|
|
|
|
#### Strategy Risks
|
|
1. May generate excessive false signals in ranging markets
|
|
2. RSI may remain in overbought/oversold zones during strong trends
|
|
3. Dual MA system has inherent lag
|
|
4. Fixed parameters may not suit all market conditions
|
|
Risk management recommendations:
|
|
- Set stop-loss levels
|
|
- Dynamically adjust parameters
|
|
- Add trend confirmation indicators
|
|
- Control single trade size
|
|
|
|
#### Optimization Directions
|
|
1. Introduce adaptive parameter mechanism to dynamically adjust MA periods based on market volatility
|
|
2. Add trend strength filter to avoid trading in weak trends
|
|
3. Optimize money management system to adjust position size based on market volatility
|
|
4. Incorporate additional technical indicators for trade confirmation
|
|
5. Develop dynamic stop-loss mechanism to improve capital efficiency
|
|
|
|
#### Summary
|
|
This is a quantitative trading strategy that perfectly combines trend following with momentum reversal. It uses dual moving averages to determine trend direction and RSI to find optimal entry points, ensuring both directional accuracy and timely profit-taking at price extremes. The key to strategy success lies in reasonable parameter settings and effective risk control. Through continuous optimization and improvement, the strategy has the potential to achieve stable returns across different market environments.
|
|
[/trans]
|
|
|
|
|
|
|
|
> Source (PineScript)
|
|
|
|
``` pinescript
|
|
/*backtest
|
|
start: 2024-10-12 00:00:00
|
|
end: 2024-11-11 00:00:00
|
|
period: 5m
|
|
basePeriod: 5m
|
|
exchanges: [{"eid":"Futures_Binance","currency":"BTC_USDT"}]
|
|
*/
|
|
|
|
//@version=5
|
|
strategy("Super Advanced Strategy", overlay=true)
|
|
|
|
// Configuração de parâmetros
|
|
shortMAPeriod = input.int(10, title="Período da Média Móvel Curta", minval=1)
|
|
longMAPeriod = input.int(50, title="Período da Média Móvel Longa", minval=1)
|
|
rsiPeriod = input.int(14, title="Período do RSI", minval=1)
|
|
|
|
// Cálculo das Médias Móveis
|
|
shortMA = ta.sma(close, shortMAPeriod)
|
|
longMA = ta.sma(close, longMAPeriod)
|
|
|
|
// Cálculo do RSI
|
|
rsi = ta.rsi(close, rsiPeriod)
|
|
|
|
// Plotando as Médias Móveis
|
|
plot(shortMA, title="Média Móvel Curta", color=color.blue, linewidth=2)
|
|
plot(longMA, title="Média Móvel Longa", color=color.red, linewidth=2)
|
|
|
|
// Adicionando linhas horizontais para os níveis de sobrecomprado e sobrevendido
|
|
hline(70, "Sobrecomprado", color=color.red, linestyle=hline.style_dashed)
|
|
hline(30, "Sobrevendido", color=color.green, linestyle=hline.style_dashed)
|
|
|
|
// Condições de entrada
|
|
buyCondition = (shortMA > longMA) and (rsi < 30)
|
|
sellCondition = (shortMA < longMA) and (rsi > 70)
|
|
|
|
// Entradas de ordens
|
|
if (buyCondition)
|
|
strategy.entry("Compra", strategy.long)
|
|
|
|
if (sellCondition)
|
|
strategy.entry("Venda", strategy.short)
|
|
|
|
// Saídas de ordens
|
|
if (rsi > 70)
|
|
strategy.close("Compra")
|
|
|
|
if (rsi < 30)
|
|
strategy.close("Venda")
|
|
|
|
// Exibir as condições de compra e venda no gráfico
|
|
plotshape(buyCondition, style=shape.labelup, location=location.belowbar, color=color.green, size=size.small, title="Sinal de Compra", text="BUY")
|
|
plotshape(sellCondition, style=shape.labeldown, location=location.abovebar, color=color.red, size=size.small, title="Sinal de Venda", text="SELL")
|
|
|
|
```
|
|
|
|
> Detail
|
|
|
|
https://www.fmz.com/strategy/471688
|
|
|
|
> Last Modified
|
|
|
|
2024-11-12 14:34:17
|