
141 lines
7.8 KiB
Markdown
141 lines
7.8 KiB
Markdown
|
||
> Name
|
||
|
||
双均线MACD交叉日期可调节量化交易策略-Dual-Moving-Average-MACD-Crossover-Date-Adjustable-Quantitative-Trading-Strategy
|
||
|
||
> Author
|
||
|
||
ChaoZhang
|
||
|
||
> Strategy Description
|
||
|
||
|
||
|
||
[trans]
|
||
#### 概述
|
||
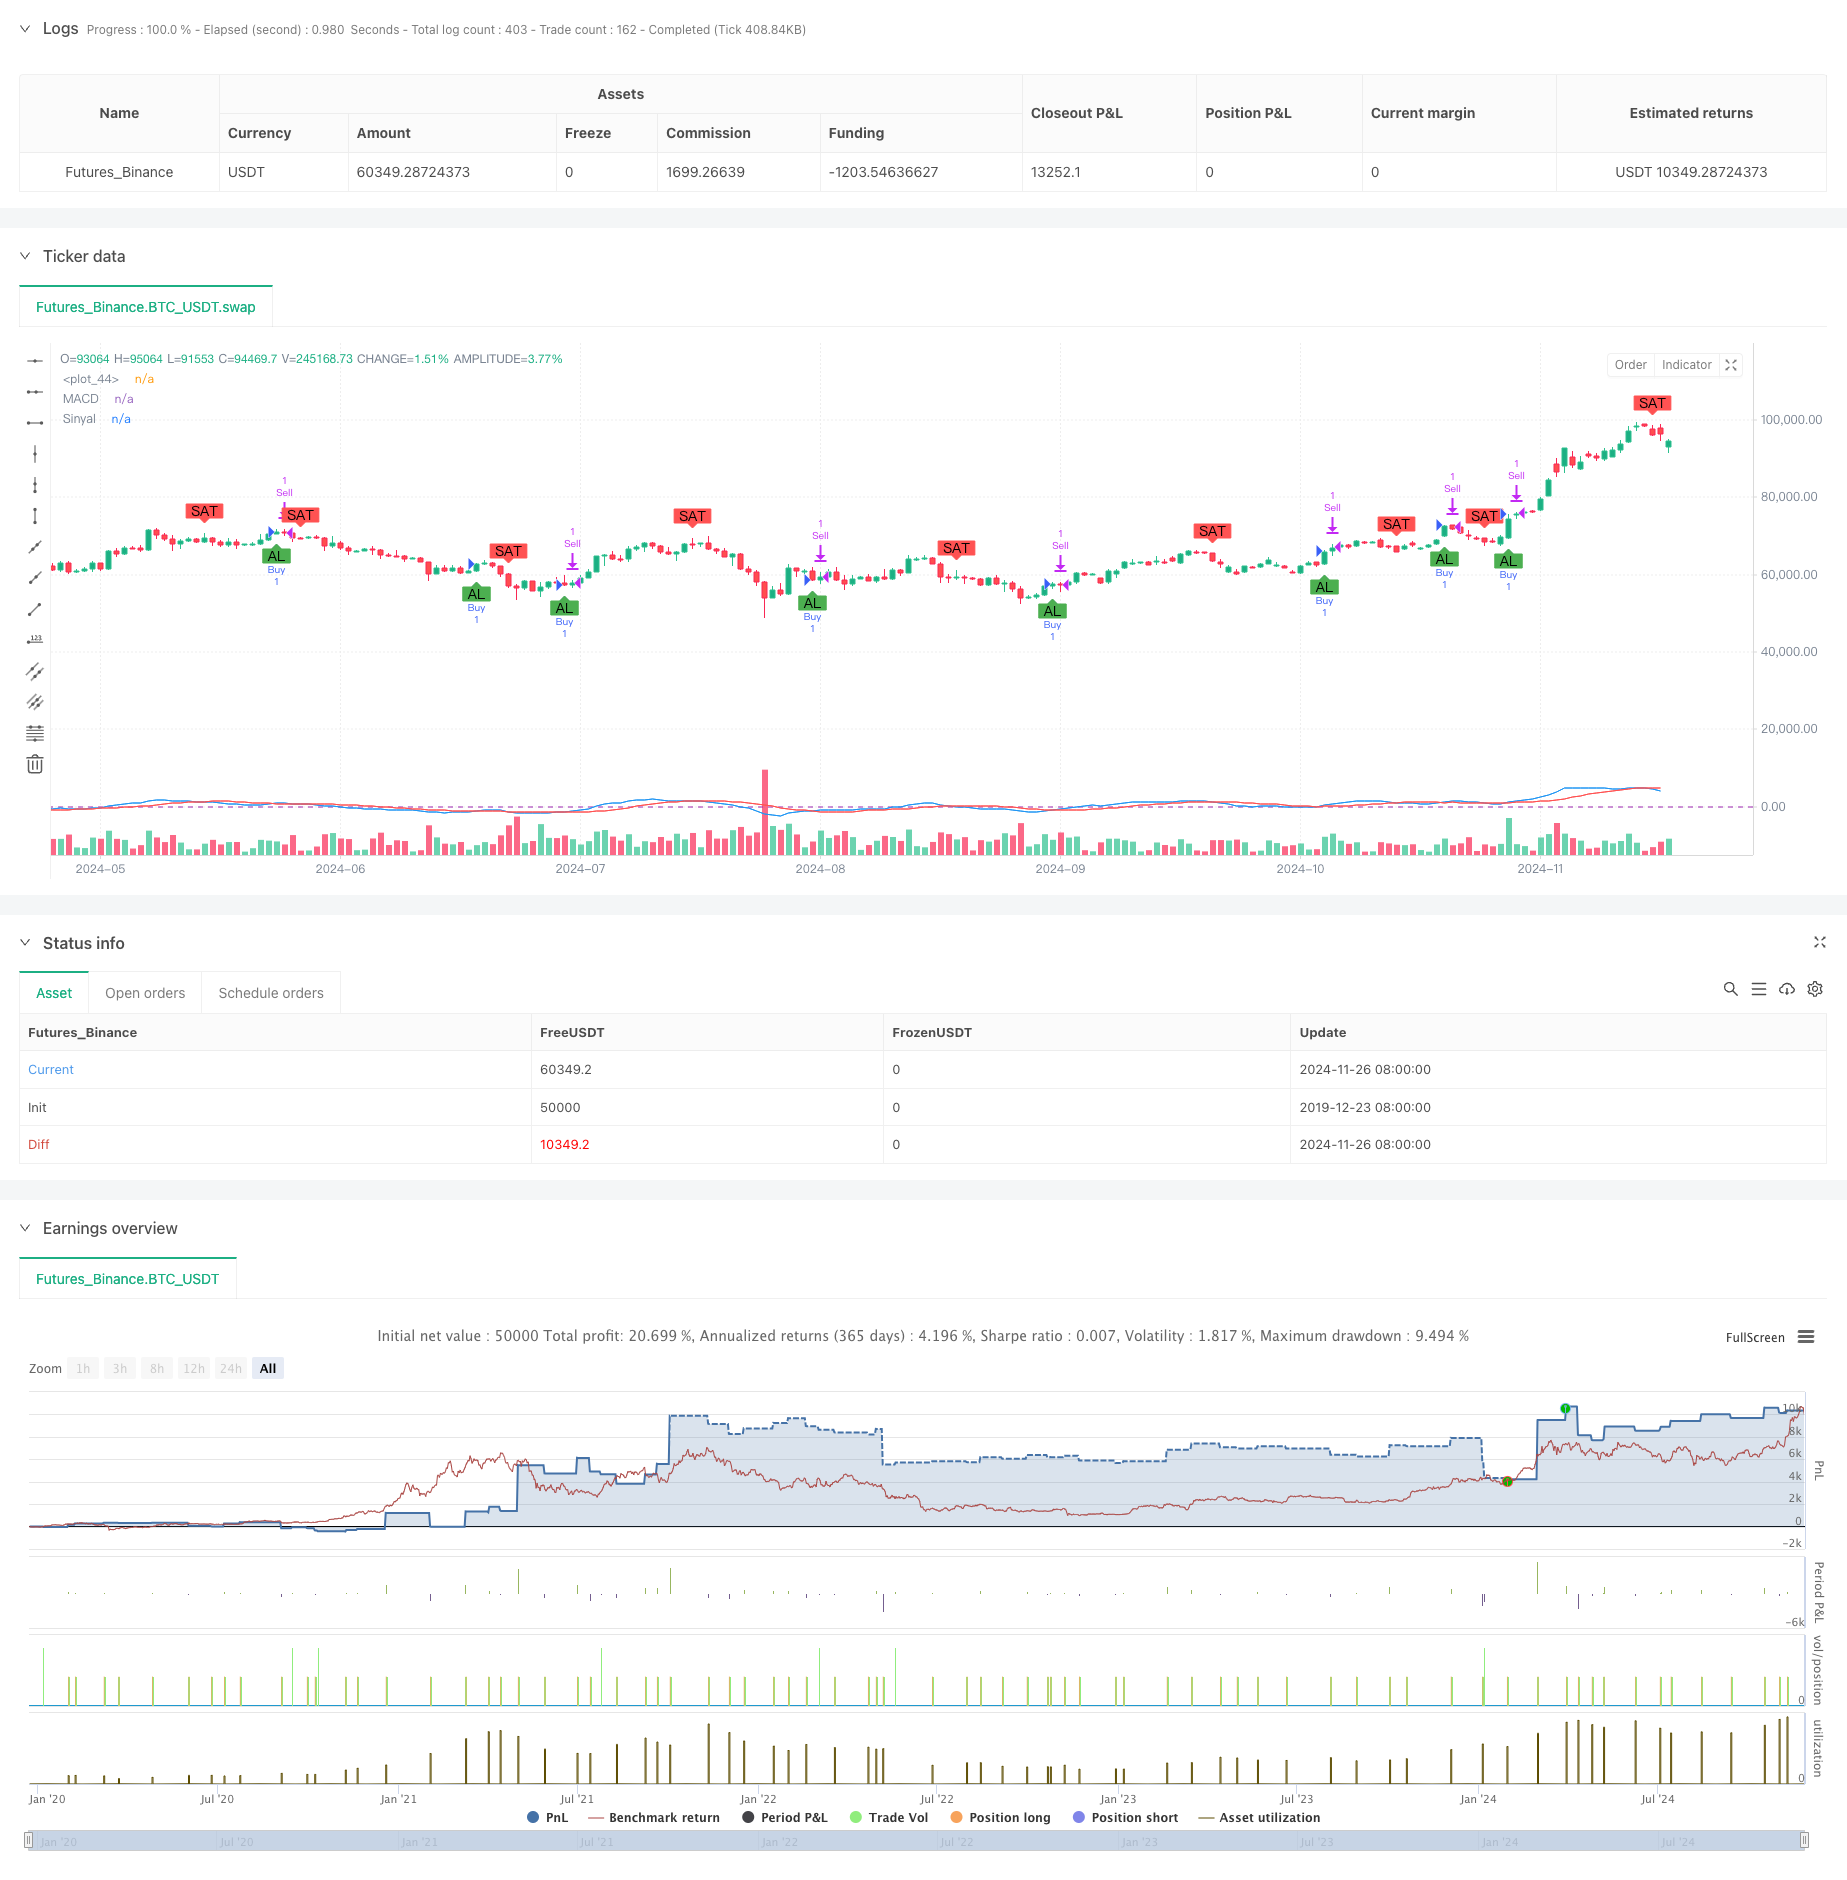
这是一个基于MACD指标的量化交易策略,通过设定特定的时间范围来执行交易。策略核心是利用快速和慢速移动平均线计算MACD值,并与信号线的交叉来确定买卖时机。策略还包含了止损和止盈机制,以控制风险和锁定利润。
|
||
|
||
#### 策略原理
|
||
策略使用8周期和16周期的指数移动平均线(EMA)计算MACD值,并使用11周期的简单移动平均线(SMA)作为信号线。当MACD线上穿信号线时产生买入信号,下穿时产生卖出信号。同时,策略引入了1%的止损和2%的止盈设置,并且只在用户指定的时间范围内(默认2023全年)执行交易。
|
||
|
||
#### 策略优势
|
||
1. 时间灵活性强:通过时间范围参数,用户可以精确控制策略的运行周期,便于进行特定时期的回测和实盘交易。
|
||
2. 风险管理完善:集成了止损和止盈机制,能够有效控制单笔交易的风险暴露。
|
||
3. 参数可调节性高:主要指标参数均可调整,包括快慢均线周期、信号线周期以及止损止盈比例。
|
||
4. 信号明确:基于MACD交叉产生的交易信号清晰,易于执行和监控。
|
||
|
||
#### 策略风险
|
||
1. 滞后性风险:由于使用均线系统,信号存在一定滞后性,可能错过最佳入场点。
|
||
2. 振荡市场风险:在横盘震荡市场中可能产生频繁的假信号,导致过度交易。
|
||
3. 固定止损风险:使用固定百分比止损可能不能很好适应不同市场环境。
|
||
4. 时间依赖性:策略效果可能受特定时间段市场特征影响,难以保证在所有时期都有稳定表现。
|
||
|
||
#### 策略优化方向
|
||
1. 引入趋势过滤器:可添加长周期均线或ATR指标作为趋势确认,减少假信号。
|
||
2. 动态止损机制:考虑使用ATR或波动率来设置动态止损位,提高止损的适应性。
|
||
3. 优化信号确认:可以添加成交量、RSI等辅助指标来确认信号有效性。
|
||
4. 时间周期优化:建议增加多时间周期分析,提高信号可靠性。
|
||
5. 仓位管理改进:可引入基于波动率的动态仓位管理系统。
|
||
|
||
#### 总结
|
||
这是一个结构完整、逻辑清晰的量化交易策略。通过MACD交叉产生交易信号,配合时间筛选和风险管理,形成了一个实用的交易系统。策略的可调节性强,适合进一步优化和个性化调整。建议交易者在实盘使用前进行充分的回测,并根据具体交易品种和市场环境调整参数。 ||
|
||
|
||
#### Overview
|
||
This is a quantitative trading strategy based on the MACD indicator that executes trades within a specified time range. The core strategy utilizes fast and slow moving averages to calculate MACD values and generates signals based on crossovers with the signal line. The strategy also incorporates stop-loss and take-profit mechanisms to control risk and lock in profits.
|
||
|
||
#### Strategy Principles
|
||
The strategy employs 8-period and 16-period exponential moving averages (EMA) to calculate MACD values, and uses an 11-period simple moving average (SMA) as the signal line. Buy signals are generated when the MACD line crosses above the signal line, while sell signals occur on downward crosses. The strategy includes a 1% stop-loss and 2% take-profit setting, and only executes trades within a user-specified time range (default is full year 2023).
|
||
|
||
#### Strategy Advantages
|
||
1. Time Flexibility: Users can precisely control the strategy's operational period through time range parameters, facilitating specific period backtesting and live trading.
|
||
2. Comprehensive Risk Management: Integrated stop-loss and take-profit mechanisms effectively control risk exposure per trade.
|
||
3. High Parameter Adjustability: All major indicator parameters are adjustable, including fast/slow moving average periods, signal line period, and stop-loss/take-profit percentages.
|
||
4. Clear Signals: Trading signals based on MACD crossovers are clear and easy to monitor and execute.
|
||
|
||
#### Strategy Risks
|
||
1. Lag Risk: Due to the moving average system, signals have inherent lag, potentially missing optimal entry points.
|
||
2. Oscillation Market Risk: May generate frequent false signals in range-bound markets, leading to overtrading.
|
||
3. Fixed Stop-Loss Risk: Using fixed percentage stops may not adequately adapt to different market conditions.
|
||
4. Time Dependency: Strategy performance may be influenced by specific time period market characteristics, challenging consistent performance across all periods.
|
||
|
||
#### Strategy Optimization Directions
|
||
1. Introduce Trend Filters: Add long-period moving averages or ATR indicators for trend confirmation to reduce false signals.
|
||
2. Dynamic Stop-Loss Mechanism: Consider using ATR or volatility for dynamic stop-loss placement to improve adaptability.
|
||
3. Optimize Signal Confirmation: Add volume, RSI, or other auxiliary indicators to confirm signal validity.
|
||
4. Time Period Optimization: Recommend implementing multiple time frame analysis to improve signal reliability.
|
||
5. Position Management Enhancement: Introduce volatility-based dynamic position sizing system.
|
||
|
||
#### Conclusion
|
||
This is a well-structured quantitative trading strategy with clear logic. It generates trading signals through MACD crossovers, combined with time filtering and risk management to form a practical trading system. The strategy's high adjustability makes it suitable for further optimization and customization. Traders are advised to conduct thorough backtesting before live implementation and adjust parameters according to specific trading instruments and market conditions.[/trans]
|
||
|
||
|
||
|
||
> Source (PineScript)
|
||
|
||
``` pinescript
|
||
/*backtest
|
||
start: 2019-12-23 08:00:00
|
||
end: 2024-11-27 00:00:00
|
||
period: 1d
|
||
basePeriod: 1d
|
||
exchanges: [{"eid":"Futures_Binance","currency":"BTC_USDT"}]
|
||
*/
|
||
|
||
// This Pine Script™ code is subject to the terms of the Mozilla Public License 2.0 at https://mozilla.org/MPL/2.0/
|
||
// © sergengurgen83
|
||
|
||
//@version=5
|
||
strategy(title="MACD Crossover Strategy with Date Range", shorttitle="MACD Crossover strategys.g", overlay=true)
|
||
|
||
// Kullanıcı girişleri
|
||
fastLength = input.int(8, minval=1, title="Hızlı MA Süresi")
|
||
slowLength = input.int(16, minval=1, title="Yavaş MA Süresi")
|
||
signalLength = input.int(11, minval=1, title="Sinyal MA Süresi")
|
||
stopLossPercent = input.float(1.0, title="Stop-Loss Yüzdesi") / 100
|
||
takeProfitPercent = input.float(2.0, title="Kar Al Yüzdesi") / 100
|
||
|
||
// Tarih aralığı girişleri
|
||
startDate = input(timestamp("2023-01-01 00:00"), title="Başlangıç Tarihi")
|
||
endDate = input(timestamp("2023-12-31 23:59"), title="Bitiş Tarihi")
|
||
|
||
// Tarih aralığı kontrolü
|
||
inDateRange = true
|
||
|
||
// Hareketli Ortalamalar ve MACD Hesaplamaları
|
||
fastMA = ta.ema(close, fastLength)
|
||
slowMA = ta.ema(close, slowLength)
|
||
macd = fastMA - slowMA
|
||
signal = ta.sma(macd, signalLength)
|
||
|
||
// Alım ve Satım sinyalleri
|
||
buySignal = ta.crossover(macd, signal) and inDateRange
|
||
sellSignal = ta.crossunder(macd, signal) and inDateRange
|
||
|
||
// Strateji kuralları
|
||
if (buySignal)
|
||
strategy.entry("Buy", strategy.long)
|
||
|
||
if (sellSignal)
|
||
strategy.close("Buy")
|
||
|
||
// Stop-Loss ve Kar Al seviyeleri
|
||
strategy.exit("Sell", from_entry="Buy", loss=stopLossPercent * close, profit=takeProfitPercent * close)
|
||
|
||
// Sinyallerin grafikte gösterilmesi
|
||
plot(macd, color=color.blue, title="MACD")
|
||
plot(signal, color=color.red, title="Sinyal")
|
||
hline(0, color=color.purple, linestyle=hline.style_dashed)
|
||
|
||
plotshape(series=buySignal, location=location.belowbar, color=color.green, style=shape.labelup, title="Al", text="AL")
|
||
plotshape(series=sellSignal, location=location.abovebar, color=color.red, style=shape.labeldown, title="Sat", text="SAT")
|
||
|
||
```
|
||
|
||
> Detail
|
||
|
||
https://www.fmz.com/strategy/473242
|
||
|
||
> Last Modified
|
||
|
||
2024-11-28 15:36:04
|