
8.0 KiB
Name
双均线-RSI联动期权量化交易策略-Dual-Moving-Average-RSI-Synergy-Options-Quantitative-Trading-Strategy
Author
ChaoZhang
Strategy Description
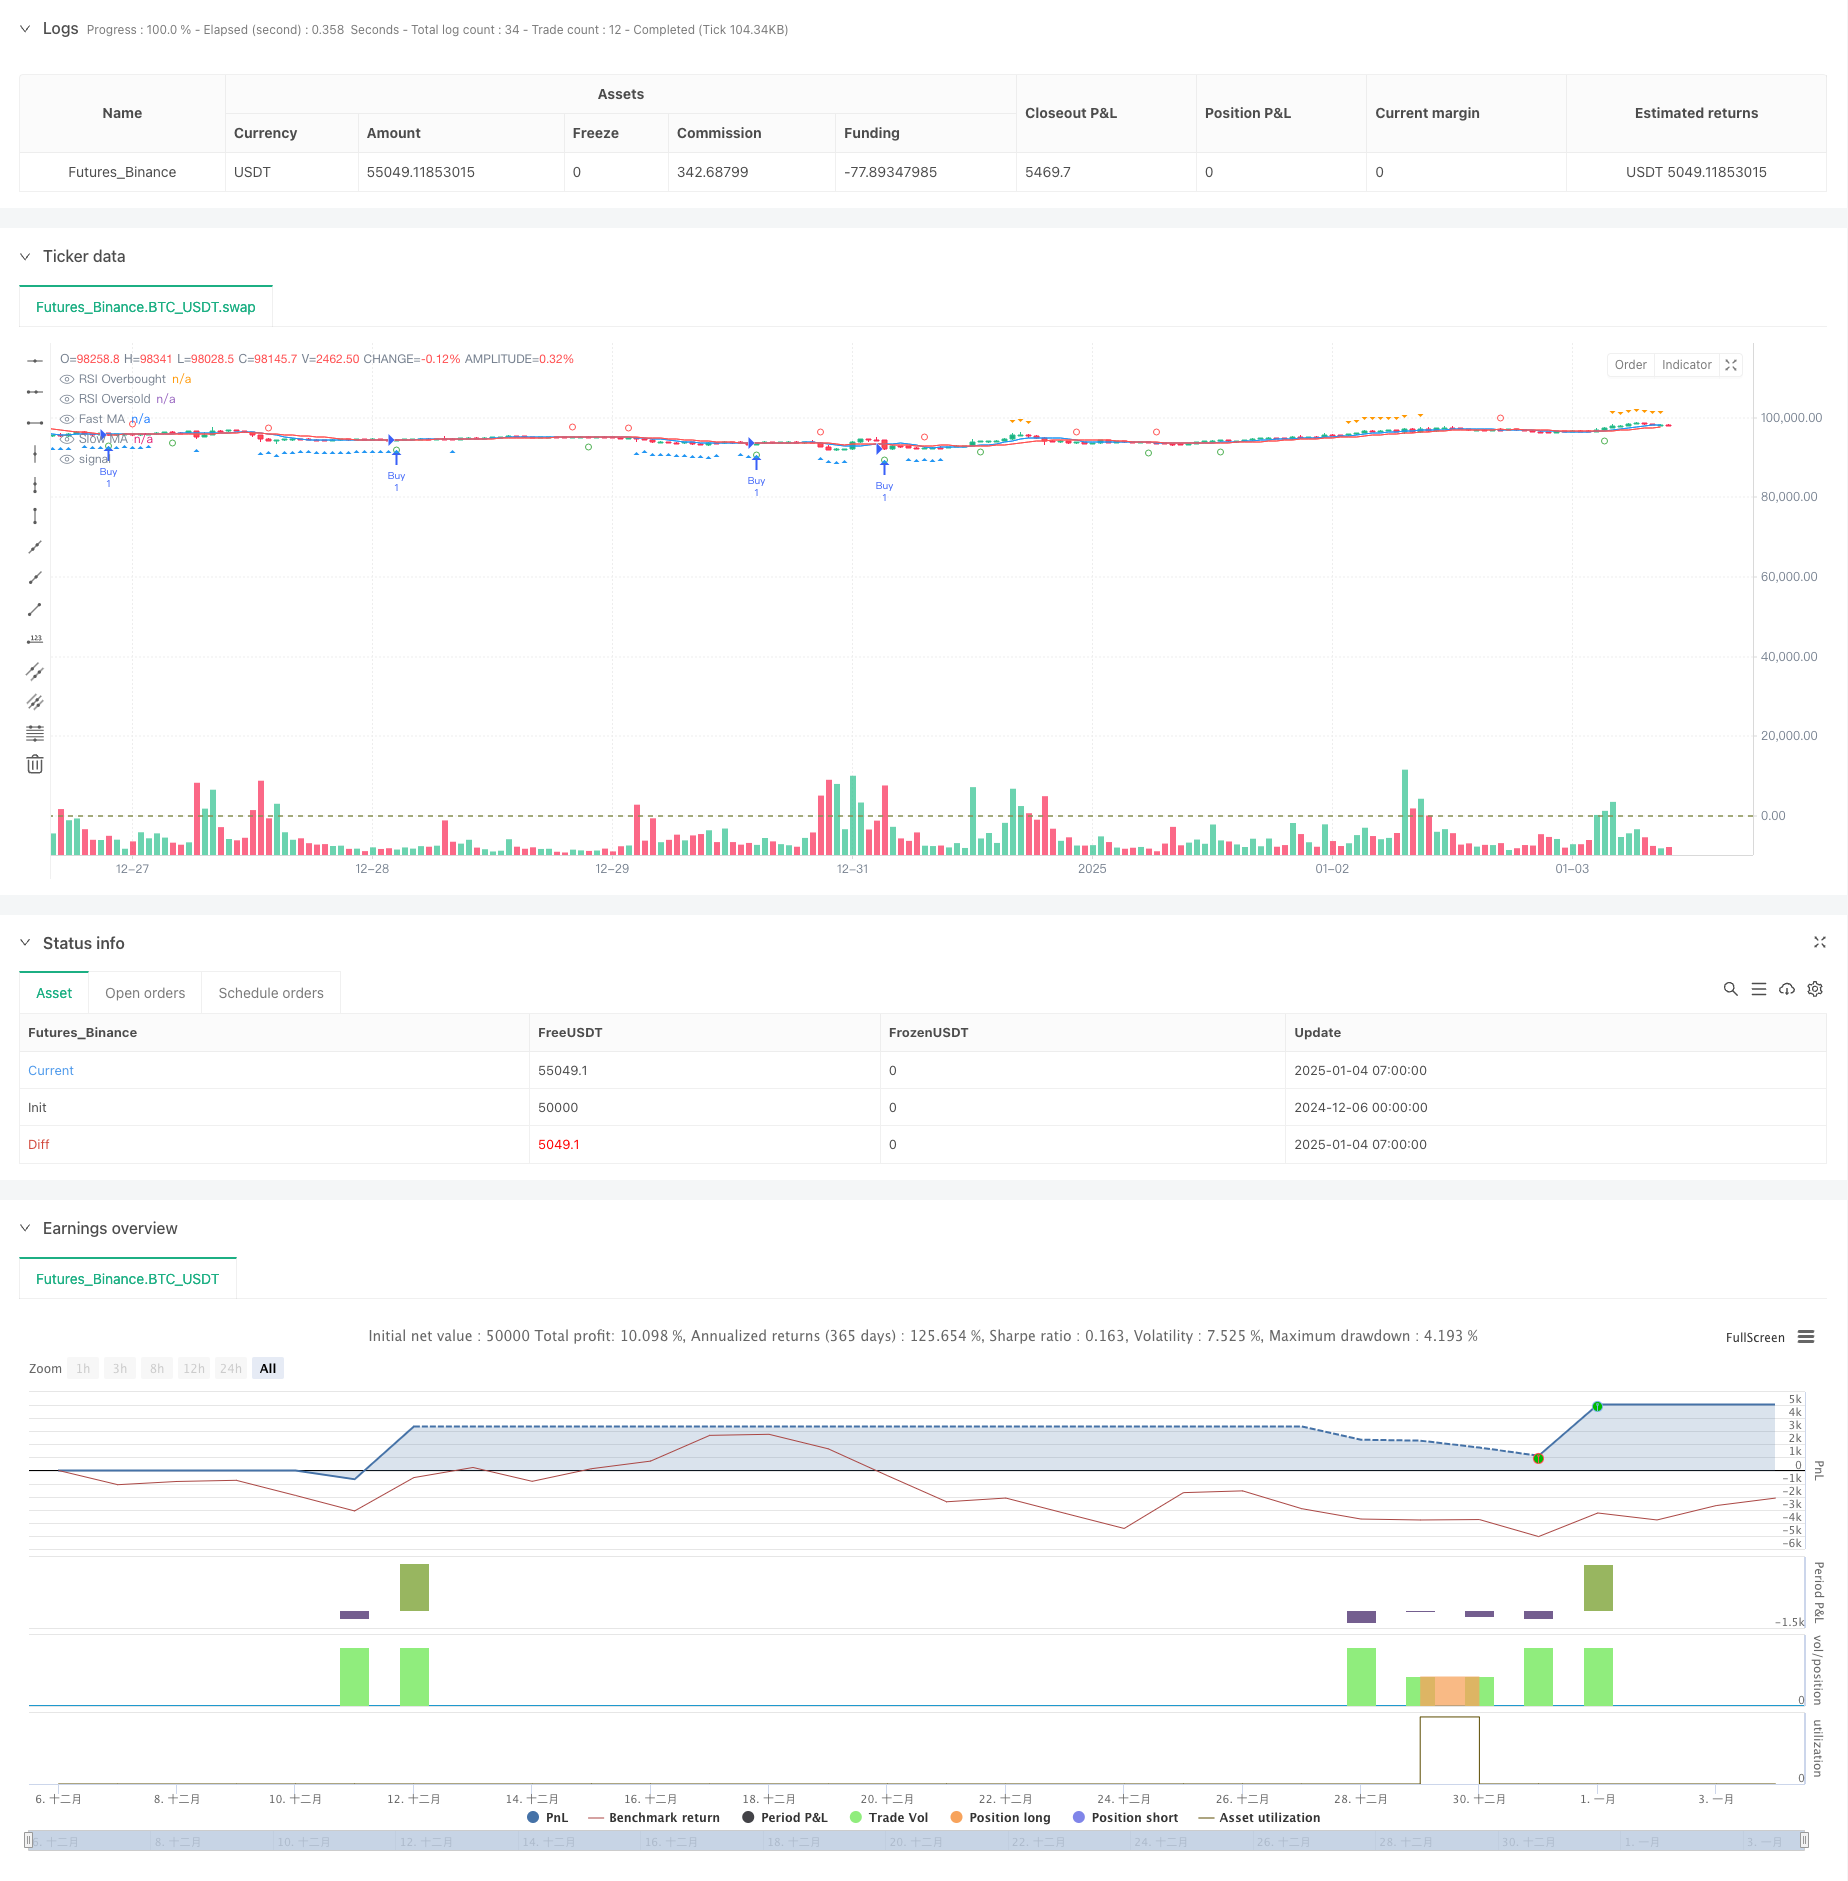
[trans]
概述
该策略是一个基于移动平均线交叉和RSI指标的量化交易系统,主要用于期权市场的交易。策略采用快速和慢速移动平均线的交叉信号,结合RSI超买超卖水平来确定交易时机,同时设置了止盈止损来控制风险。该策略适用于5分钟时间周期的交易。
策略原理
策略使用了两个关键的技术指标:移动平均线(MA)和相对强弱指标(RSI)。具体来说:
- 使用7周期和13周期的简单移动平均线(SMA)来捕捉价格趋势
- 采用17周期的RSI指标来识别超买超卖条件
- 当快速均线向上穿越慢速均线且RSI低于43时,系统产生做多信号
- 当快速均线向下穿越慢速均线且RSI高于64时,系统产生做空信号
- 设置4%的止盈和0.5%的止损来管理风险
策略优势
- 多重确认机制:结合均线交叉和RSI指标,提供更可靠的交易信号
- 风险管理完善:设置了固定百分比的止盈止损,有效控制风险
- 适应性强:参数可根据不同市场条件灵活调整
- 可视化支持:策略提供了清晰的图形指示,便于交易者理解市场状况
- 操作规则明确:入场出场条件明确,减少主观判断带来的干扰
策略风险
- 震荡市场风险:在横盘震荡市场中可能产生频繁的假信号
- 滑点风险:期权市场流动性不足时可能面临较大滑点
- 参数敏感性:策略效果对参数设置较为敏感,需要持续优化
- 市场环境依赖:在剧烈波动的市场环境下,止损可能不够及时
- 系统性风险:当市场出现跳空或重大事件时,止损可能失效
策略优化方向
- 引入波动率指标:考虑将ATR或Bollinger Bands纳入决策系统
- 优化参数自适应:开发基于市场状态的动态参数调整机制
- 增加市场情绪过滤:结合成交量等指标过滤虚假信号
- 完善止损机制:考虑引入追踪止损,提高风险管理效率
- 增加时间过滤:加入交易时间窗口限制,避免低效时段交易
总结
该策略通过结合均线交叉和RSI指标,构建了一个相对完整的交易系统。策略的优势在于多重信号确认和完善的风险管理,但也需要注意市场环境对策略表现的影响。通过持续优化和完善,该策略有望在期权市场中取得稳定表现。建议交易者在实盘使用前进行充分的回测和参数优化。
||
Overview
This strategy is a quantitative trading system based on moving average crossovers and RSI indicators, primarily designed for options market trading. The strategy utilizes fast and slow moving average crossover signals combined with RSI overbought/oversold levels to determine trading opportunities, while implementing take-profit and stop-loss mechanisms for risk control. The strategy is optimized for 5-minute timeframe trading.
Strategy Principles
The strategy employs two key technical indicators: Moving Averages (MA) and Relative Strength Index (RSI). Specifically:
- Uses 7-period and 13-period Simple Moving Averages (SMA) to capture price trends
- Employs 17-period RSI to identify overbought/oversold conditions
- Generates long signals when fast MA crosses above slow MA and RSI is below 43
- Generates short signals when fast MA crosses below slow MA and RSI is above 64
- Implements 4% take-profit and 0.5% stop-loss for risk management
Strategy Advantages
- Multiple confirmation mechanism: Combines MA crossovers and RSI indicators for more reliable trading signals
- Comprehensive risk management: Fixed percentage take-profit and stop-loss effectively control risk
- High adaptability: Parameters can be flexibly adjusted for different market conditions
- Visual support: Strategy provides clear graphical indicators for better market understanding
- Clear operational rules: Explicit entry and exit conditions reduce subjective judgment interference
Strategy Risks
- Choppy market risk: May generate frequent false signals in range-bound markets
- Slippage risk: Potential significant slippage in low liquidity options markets
- Parameter sensitivity: Strategy performance is sensitive to parameter settings, requiring continuous optimization
- Market environment dependence: Stop-loss might not be timely in highly volatile market conditions
- Systemic risk: Stop-loss may fail during market gaps or major events
Strategy Optimization Directions
- Incorporate volatility indicators: Consider adding ATR or Bollinger Bands to the decision system
- Optimize parameter adaptation: Develop dynamic parameter adjustment mechanisms based on market states
- Add market sentiment filtering: Integrate volume indicators to filter false signals
- Improve stop-loss mechanism: Consider implementing trailing stops for better risk management
- Add time filtering: Incorporate trading time windows to avoid inefficient trading periods
Summary
The strategy constructs a relatively complete trading system by combining MA crossovers and RSI indicators. Its strengths lie in multiple signal confirmation and comprehensive risk management, while attention must be paid to the impact of market conditions on strategy performance. Through continuous optimization and improvement, the strategy shows promise for stable performance in options markets. Traders are advised to conduct thorough backtesting and parameter optimization before live implementation.[/trans]
Source (PineScript)
/*backtest
start: 2024-12-06 00:00:00
end: 2025-01-04 08:00:00
period: 1h
basePeriod: 1h
exchanges: [{"eid":"Futures_Binance","currency":"BTC_USDT"}]
*/

//@version=5
strategy("MA Crossover with RSI Debugging", overlay=true)

// Inputs
fastLength = input.int(7, title="Fast MA Length", minval=1)
slowLength = input.int(13, title="Slow MA Length", minval=1)
rsiLength = input.int(17, title="RSI Length", minval=1)
rsiOverbought = input.int(64, title="RSI Overbought Level", minval=50, maxval=100)
rsiOversold = input.int(43, title="RSI Oversold Level", minval=0, maxval=50)
takeProfitPerc = input.float(4, title="Take Profit (%)", minval=0.1)
stopLossPerc = input.float(0.5, title="Stop Loss (%)", minval=0.1)

// Moving Averages
fastMA = ta.sma(close, fastLength)
slowMA = ta.sma(close, slowLength)

// RSI
rsi = ta.rsi(close, rsiLength)

// Entry Conditions
longCondition = ta.crossover(fastMA, slowMA) and rsi < rsiOversold
shortCondition = ta.crossunder(fastMA, slowMA) and rsi > rsiOverbought

// Plot Debugging Shapes
plotshape(ta.crossover(fastMA, slowMA), color=color.green, style=shape.circle, location=location.belowbar, title="Fast MA Crossover")
plotshape(ta.crossunder(fastMA, slowMA), color=color.red, style=shape.circle, location=location.abovebar, title="Fast MA Crossunder")

plotshape(rsi < rsiOversold, color=color.blue, style=shape.triangleup, location=location.belowbar, title="RSI Oversold")
plotshape(rsi > rsiOverbought, color=color.orange, style=shape.triangledown, location=location.abovebar, title="RSI Overbought")

// Entry and Exit Execution
if (longCondition)
    strategy.entry("Buy", strategy.long)

if (shortCondition)
    strategy.entry("Sell", strategy.short)

takeProfitPrice = strategy.position_avg_price * (1 + takeProfitPerc / 100)
stopLossPrice = strategy.position_avg_price * (1 - stopLossPerc / 100)

if (strategy.position_size > 0)
    strategy.exit("Exit Buy", from_entry="Buy", limit=takeProfitPrice, stop=stopLossPrice)

if (strategy.position_size < 0)
    strategy.exit("Exit Sell", from_entry="Sell", limit=takeProfitPrice, stop=stopLossPrice)

// Plot Moving Averages
plot(fastMA, color=color.blue, title="Fast MA")
plot(slowMA, color=color.red, title="Slow MA")

// RSI Levels
hline(rsiOverbought, "RSI Overbought", color=color.red)
hline(rsiOversold, "RSI Oversold", color=color.green)
Detail
https://www.fmz.com/strategy/477581
Last Modified
2025-01-06 15:24:09