
190 lines
13 KiB
Markdown
190 lines
13 KiB
Markdown
|
|
> Name
|
|
|
|
双均线趋势追踪量化策略-Dual-EMA-Trend-Following-Quantitative-Strategy
|
|
|
|
> Author
|
|
|
|
ianzeng123
|
|
|
|
> Strategy Description
|
|
|
|
|
|
|
|
|
|
|
|
[trans]
|
|
|
|
#### 概述
|
|
双均线趋势追踪量化策略是一种基于指数移动平均线(EMA)的交易系统,通过比较快速与慢速EMA之间的差值与平均真实范围(ATR)的关系来识别可持续的市场趋势。该策略专为寻求稳定、持久趋势信号的长期交易者设计,通过动态调整的ATR倍数作为过滤器,有效减少了假信号,提高了交易质量。
|
|
|
|
#### 策略原理
|
|
该策略的核心原理基于两条不同周期的指数移动平均线的相互作用。具体实现如下:
|
|
|
|
1. 使用两条EMA线:快速EMA(默认30周期)和慢速EMA(默认60周期)
|
|
2. 计算两条EMA之间的差值(emaDiff = emaFast - emaSlow)
|
|
3. 将差值与ATR的乘积(emaMarginATRMult * ta.atr(emaMarginATRLen))比较
|
|
4. 当差值大于ATR乘积时确认上升趋势(emaBull),当差值小于负ATR乘积时确认下降趋势(emaBear)
|
|
5. 生成交易信号:
|
|
- 买入信号:当EMA差值上穿ATR乘积时(ta.crossover)
|
|
- 卖出信号:当EMA差值下穿负ATR乘积时(ta.crossunder)
|
|
|
|
该策略使用ATR作为动态阈值,可以根据市场波动性自动调整信号灵敏度,这使得策略在不同波动环境下都能保持稳定性能。
|
|
|
|
#### 策略优势
|
|
1. 信号可靠性高:通过引入ATR作为动态过滤器,该策略能够有效过滤市场噪音,仅捕捉真正有意义的趋势变化
|
|
2. 适应市场波动:策略中的ATR乘数设计使得信号阈值能随市场波动性变化而自动调整,在高波动期间提高阈值,低波动期间降低阈值
|
|
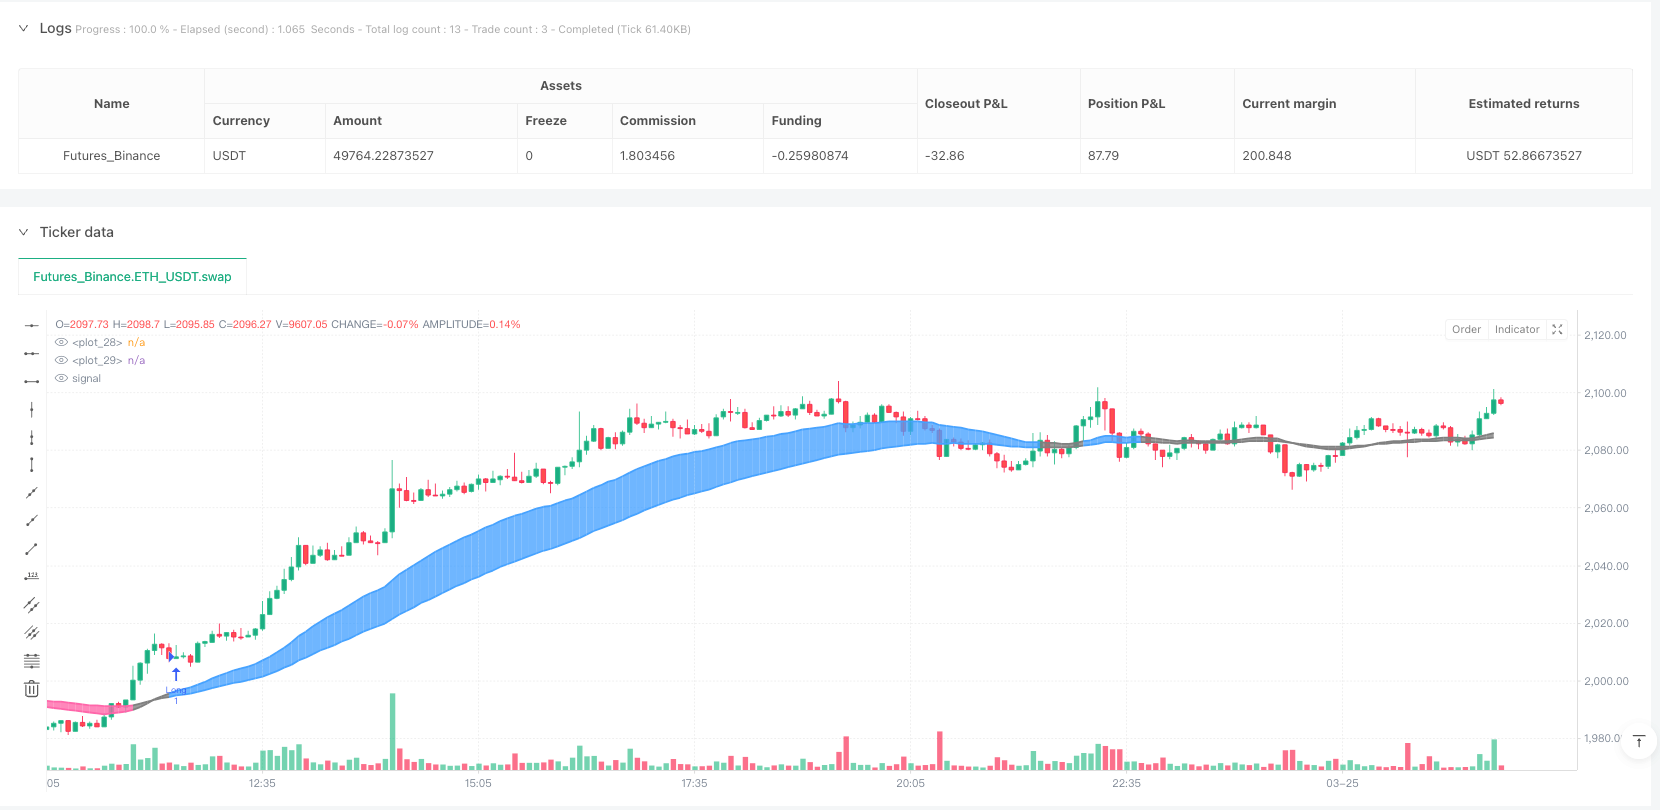
3. 视觉反馈清晰:策略通过动态颜色变化(蓝色表示上升趋势,粉色表示下降趋势,灰色表示中性)直观展示市场状态,便于交易者理解当前市场环境
|
|
4. 参数可定制:策略提供了多个可调整参数,包括快速EMA长度、慢速EMA长度、ATR周期以及ATR乘数,使交易者可以根据不同市场特性和个人风险偏好进行优化
|
|
5. 长期稳定性:该策略专注于捕捉持续性强的趋势,避免了频繁交易,降低了交易成本,更适合长期投资者
|
|
|
|
#### 策略风险
|
|
1. 趋势延迟确认:由于使用移动平均线,该策略在趋势初期会有所滞后,可能错过部分初始行情
|
|
2. 震荡市场表现不佳:在无明确趋势的横盘整理市场中,策略可能产生频繁的假信号,导致连续亏损
|
|
3. 参数敏感性:策略性能对参数选择较为敏感,特别是ATR乘数,选择不当可能导致信号过多或过少
|
|
4. 缺乏止损机制:当前版本未包含明确的止损策略,在趋势突然逆转时可能面临较大损失
|
|
5. 单向交易限制:代码中的注释表明当前策略仅执行做多交易并平仓,未充分利用做空机会
|
|
|
|
风险缓解方法:
|
|
- 增加额外的趋势确认指标,如相对强弱指数(RSI)或MACD
|
|
- 实施适当的止损策略,如跟踪止损或固定百分比止损
|
|
- 通过回测不同市场条件下的参数组合,找到更稳健的参数设置
|
|
- 在横盘市场中暂停交易或调整参数以减少假信号
|
|
|
|
#### 策略优化方向
|
|
1. 引入多时间框架分析:通过整合更长周期的趋势判断,可以提高信号质量,只在大趋势方向一致时执行交易
|
|
2. 优化进出场机制:可以考虑在信号触发后寻找更优的入场点,如回调至支撑位置再入场,以改善入场价格
|
|
3. 添加仓位管理:根据趋势强度和市场波动性动态调整仓位大小,在强趋势中增加仓位,弱趋势中减少仓位
|
|
4. 集成做空策略:完全启用代码中已有但被注释的做空功能,使策略能够在下跌趋势中获利
|
|
5. 增加止损和获利策略:实现动态止损如ATR的倍数或关键支撑/阻力位,提高风险管理能力
|
|
6. 引入波动率过滤:在极端高波动率环境下暂停交易,避免异常市场条件下的潜在大幅亏损
|
|
7. 添加季节性和时间过滤:分析不同时间段策略表现,可能在特定时段禁用策略
|
|
|
|
这些优化方向的核心目标是提高策略的稳健性,使其在更广泛的市场条件下保持良好表现,同时加强风险管理功能,保护资金安全。
|
|
|
|
#### 总结
|
|
双均线趋势追踪量化策略是一个设计精良的交易系统,通过结合指数移动平均线和平均真实范围指标,提供了可靠的趋势信号。其核心优势在于使用动态阈值过滤市场噪音,使交易信号更加可靠。
|
|
|
|
该策略特别适合寻求长期、稳定趋势的交易者,通过减少频繁交易和假信号,降低了交易成本和心理压力。虽然存在趋势延迟确认和震荡市场表现不佳等固有风险,但这些可以通过参数优化和额外的风险管理措施来缓解。
|
|
|
|
进一步的优化空间包括多时间框架分析、改进的进出场机制、动态仓位管理以及更全面的风险控制。通过这些改进,该策略有潜力成为一个全面的交易系统,适应更广泛的市场环境并提供稳定的长期收益。 ||
|
|
|
|
#### Overview
|
|
The Dual EMA Trend Following Quantitative Strategy is a trading system based on Exponential Moving Averages (EMA) that identifies sustainable market trends by comparing the difference between fast and slow EMAs against the Average True Range (ATR). This strategy is specifically designed for long-term traders seeking stable and persistent trend signals, utilizing a dynamically adjusted ATR multiplier as a filter to effectively reduce false signals and improve trading quality.
|
|
|
|
#### Strategy Principle
|
|
The core principle of this strategy is based on the interaction between two Exponential Moving Averages with different periods. The specific implementation is as follows:
|
|
|
|
1. Uses two EMA lines: a fast EMA (default 30 periods) and a slow EMA (default 60 periods)
|
|
2. Calculates the difference between the two EMAs (emaDiff = emaFast - emaSlow)
|
|
3. Compares this difference with the product of ATR (emaMarginATRMult * ta.atr(emaMarginATRLen))
|
|
4. Confirms an uptrend (emaBull) when the difference exceeds the ATR product, and confirms a downtrend (emaBear) when the difference is less than the negative ATR product
|
|
5. Generates trading signals:
|
|
- Buy signal: when the EMA difference crosses above the ATR product (ta.crossover)
|
|
- Sell signal: when the EMA difference crosses below the negative ATR product (ta.crossunder)
|
|
|
|
The strategy uses ATR as a dynamic threshold that automatically adjusts signal sensitivity based on market volatility, allowing the strategy to maintain stable performance across different volatility environments.
|
|
|
|
#### Strategy Advantages
|
|
1. High signal reliability: By introducing ATR as a dynamic filter, the strategy effectively filters market noise, capturing only truly meaningful trend changes
|
|
2. Adapts to market volatility: The ATR multiplier design allows signal thresholds to automatically adjust with market volatility, increasing thresholds during high volatility periods and decreasing them during low volatility periods
|
|
3. Clear visual feedback: The strategy provides intuitive visualization of market conditions through dynamic color changes (blue for uptrends, pink for downtrends, gray for neutral), making it easy for traders to understand the current market environment
|
|
4. Customizable parameters: The strategy offers several adjustable parameters, including fast EMA length, slow EMA length, ATR period, and ATR multiplier, allowing traders to optimize according to different market characteristics and personal risk preferences
|
|
5. Long-term stability: This strategy focuses on capturing strong, sustainable trends, avoiding frequent trading, reducing transaction costs, and is more suitable for long-term investors
|
|
|
|
#### Strategy Risks
|
|
1. Delayed trend confirmation: Due to the use of moving averages, the strategy lags during the initial stages of trends, potentially missing part of the initial price movement
|
|
2. Poor performance in ranging markets: In sideways markets with no clear trend, the strategy may generate frequent false signals, leading to consecutive losses
|
|
3. Parameter sensitivity: Strategy performance is relatively sensitive to parameter selection, especially the ATR multiplier, where inappropriate choices can lead to too many or too few signals
|
|
4. Lack of stop-loss mechanism: The current version does not include a clear stop-loss strategy, potentially facing significant losses when trends suddenly reverse
|
|
5. One-directional trading limitation: The commented code indicates that the current strategy only executes long trades and closes positions, not fully utilizing short-selling opportunities
|
|
|
|
Risk mitigation methods:
|
|
- Add additional trend confirmation indicators, such as Relative Strength Index (RSI) or MACD
|
|
- Implement appropriate stop-loss strategies, such as trailing stops or fixed percentage stops
|
|
- Find more robust parameter settings by backtesting parameter combinations under different market conditions
|
|
- Pause trading or adjust parameters in sideways markets to reduce false signals
|
|
|
|
#### Strategy Optimization Directions
|
|
1. Introduce multi-timeframe analysis: Integrating trend determinations from longer timeframes can improve signal quality, executing trades only when the major trend direction aligns
|
|
2. Optimize entry and exit mechanisms: Consider seeking better entry points after signals trigger, such as entering on pullbacks to support levels, to improve entry prices
|
|
3. Add position management: Dynamically adjust position sizes based on trend strength and market volatility, increasing positions in strong trends and reducing them in weak trends
|
|
4. Integrate short-selling strategy: Fully enable the short-selling functionality that exists but is commented out in the code, allowing the strategy to profit from downtrends
|
|
5. Add stop-loss and profit-taking strategies: Implement dynamic stop-losses such as ATR multiples or key support/resistance levels to improve risk management capabilities
|
|
6. Introduce volatility filters: Pause trading in extremely high volatility environments to avoid potential significant losses under abnormal market conditions
|
|
7. Add seasonality and time filters: Analyze strategy performance during different time periods, potentially disabling the strategy during specific periods
|
|
|
|
The core objective of these optimization directions is to enhance the robustness of the strategy, maintaining good performance across a wider range of market conditions while strengthening risk management functions to protect capital.
|
|
|
|
#### Summary
|
|
The Dual EMA Trend Following Quantitative Strategy is a well-designed trading system that provides reliable trend signals by combining Exponential Moving Averages with the Average True Range indicator. Its core strength lies in using dynamic thresholds to filter market noise, making trading signals more reliable.
|
|
|
|
This strategy is particularly suitable for traders seeking long-term, stable trends, reducing trading costs and psychological pressure by minimizing frequent trading and false signals. Although inherent risks exist, such as delayed trend confirmation and poor performance in ranging markets, these can be mitigated through parameter optimization and additional risk management measures.
|
|
|
|
Further optimization opportunities include multi-timeframe analysis, improved entry and exit mechanisms, dynamic position management, and more comprehensive risk controls. With these improvements, the strategy has the potential to become a comprehensive trading system that adapts to a wider range of market environments and provides stable long-term returns.[/trans]
|
|
|
|
|
|
|
|
> Source (PineScript)
|
|
|
|
``` pinescript
|
|
/*backtest
|
|
start: 2025-03-24 00:00:00
|
|
end: 2025-03-25 03:00:00
|
|
period: 5m
|
|
basePeriod: 5m
|
|
exchanges: [{"eid":"Futures_Binance","currency":"ETH_USDT"}]
|
|
*/
|
|
|
|
//@version=6
|
|
strategy("onetrend Lite v1.0", overlay=true)
|
|
|
|
// User input
|
|
emaFastLen = input.int(30, title="Length EMA Fast")
|
|
emaSlowLen = input.int(60, title="Length EMA Slow")
|
|
emaMarginATRLen = input.int(60, title="Margin EMA - ATR Length")
|
|
emaMarginATRMult = input.float(0.3, title="Margin EMA - ATR Multiplier", step=0.01)
|
|
|
|
// Moving averages
|
|
emaFast = ta.ema(close, emaFastLen)
|
|
emaSlow = ta.ema(close, emaSlowLen)
|
|
emaDiff = emaFast - emaSlow
|
|
|
|
// Trend determination
|
|
emaBull = emaDiff > emaMarginATRMult * ta.atr(emaMarginATRLen)
|
|
emaBear = emaDiff < -emaMarginATRMult * ta.atr(emaMarginATRLen)
|
|
|
|
/// COLOR DEFINITIONS
|
|
clrUp = color.rgb(70, 163, 255)
|
|
clrDown = color.rgb(255, 102, 170)
|
|
clrNeutral = color.rgb(128, 128, 128)
|
|
clrUpFill = color.new(clrUp, 70)
|
|
clrDownFill = color.new(clrDown, 70)
|
|
clrNeutralFill = color.new(clrNeutral, 70)
|
|
|
|
// Plotting EMAs with dynamic colors based on trend
|
|
emaFastPlot = plot(emaFast, linewidth=2, color=emaBull ? clrUp : emaBear ? clrDown : clrNeutral)
|
|
emaSlowPlot = plot(emaSlow, linewidth=2, color=emaBull ? clrUp : emaBear ? clrDown : clrNeutral)
|
|
fill(emaFastPlot, emaSlowPlot, color=emaBull ? clrUpFill : emaBear ? clrDownFill : clrNeutralFill)
|
|
|
|
// Define signals
|
|
longSignal = ta.crossover(emaDiff, emaMarginATRMult * ta.atr(emaMarginATRLen))
|
|
sellSignal = ta.crossunder(emaDiff, -emaMarginATRMult * ta.atr(emaMarginATRLen))
|
|
|
|
// Strategy orders: go long at a buy signal, short at a sell signal, and close opposite positions
|
|
if longSignal
|
|
strategy.entry("Long", strategy.long, comment="Long Entry")
|
|
// strategy.close("Short", comment="Close Short")
|
|
if sellSignal
|
|
// strategy.entry("Short", strategy.short, comment="Short Entry")
|
|
strategy.close("Long", comment="Close Long")
|
|
```
|
|
|
|
> Detail
|
|
|
|
https://www.fmz.com/strategy/489017
|
|
|
|
> Last Modified
|
|
|
|
2025-04-01 10:59:19
|