
144 lines
8.0 KiB
Markdown
144 lines
8.0 KiB
Markdown
|
|
> Name
|
|
|
|
双均线动量趋势交易策略结合满实体烛线信号系统-Dual-EMA-Momentum-Trend-Trading-Strategy-with-Full-Body-Candle-Signal-System
|
|
|
|
> Author
|
|
|
|
ChaoZhang
|
|
|
|
> Strategy Description
|
|
|
|
|
|
|
|
[trans]
|
|
#### 概述
|
|
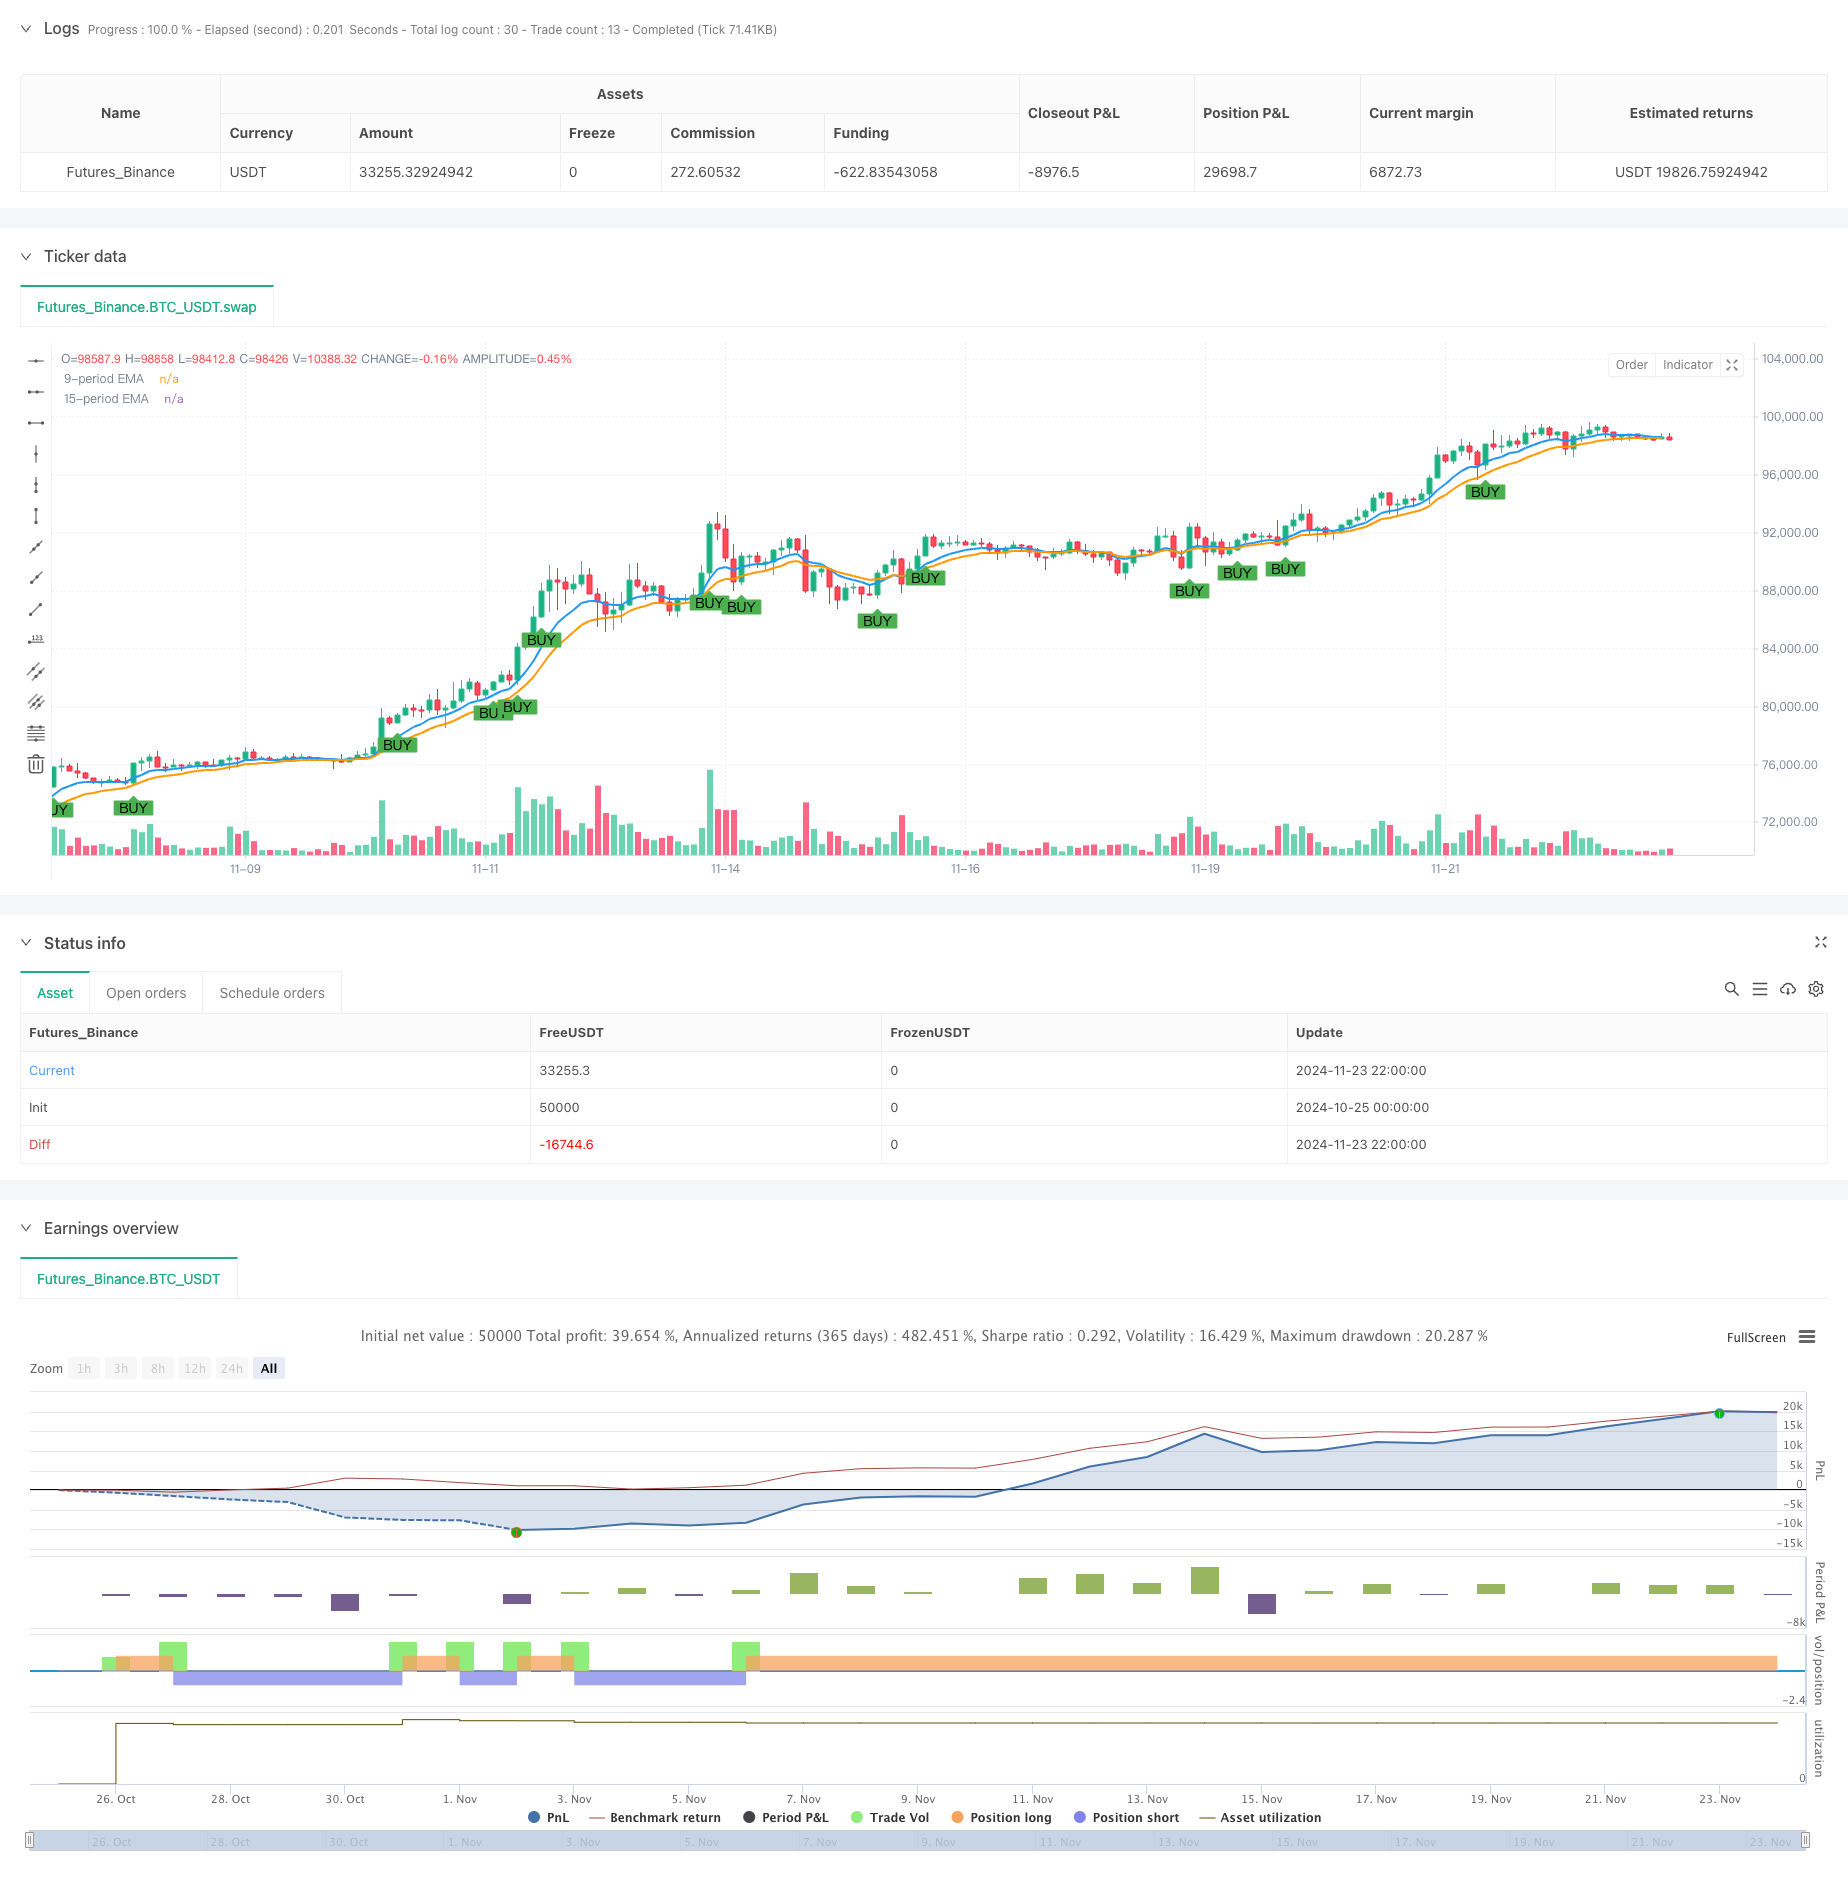
该策略是一个结合了技术分析和价格行为的趋势跟踪系统。策略核心是利用9周期和15周期指数移动平均线(EMA)作为趋势方向指标,同时结合满实体蜡烛图(Marubozu)作为动量确认信号,形成一个完整的交易决策系统。通过对均线的交叉以及价格走势的分析,策略能够捕捉市场的主要趋势变化,并在合适的时机进行交易。
|
|
|
|
#### 策略原理
|
|
策略采用双重过滤机制来确认交易信号。首先,使用9周期和15周期的EMA来确定市场趋势方向。其次,通过识别满实体蜡烛图形态作为动量确认信号。当出现满实体多头蜡烛且收盘价位于两条EMA之上时,系统产生买入信号;当出现满实体空头蜡烛且收盘价位于两条EMA之下时,系统产生卖出信号。满实体蜡烛的判定标准为实体部分占整个蜡烛至少75%,这表明市场在该时期表现出强烈的单向移动。
|
|
|
|
#### 策略优势
|
|
1. 信号可靠性高:通过结合均线和满实体蜡烛两个维度的确认,显著提高了交易信号的可靠性
|
|
2. 趋势把握准确:双均线系统能够有效识别市场趋势,避免在横盘市场频繁交易
|
|
3. 执行标准明确:策略的进场和出场条件清晰,便于量化实现
|
|
4. 风险控制完善:系统内置的反向信号平仓机制,有效控制了持仓风险
|
|
5. 操作简单直观:策略逻辑简单,便于理解和执行,适合各类交易者使用
|
|
|
|
#### 策略风险
|
|
1. 滞后性风险:均线指标本身具有滞后性,可能导致入场时机略有延迟
|
|
2. 假突破风险:市场可能出现假突破情况,导致错误信号
|
|
3. 横盘市场风险:在市场震荡期间可能产生频繁的假信号
|
|
4. 瞬间跳空风险:大幅跳空可能导致止损失效
|
|
5. 参数优化风险:不同市场环境下最优参数可能存在差异
|
|
|
|
#### 优化方向
|
|
1. 引入波动率过滤器:可以添加ATR指标来过滤低波动率环境下的交易信号
|
|
2. 优化均线周期:可根据不同市场特征调整均线周期参数
|
|
3. 增加趋势强度确认:可以引入ADX等趋势强度指标作为辅助判断
|
|
4. 完善止损机制:可以增加追踪止损功能,更好地保护利润
|
|
5. 添加市场环境过滤:引入市场状态判断机制,在横盘市场自动降低交易频率
|
|
|
|
#### 总结
|
|
该策略通过结合均线系统和满实体蜡烛信号,构建了一个稳健的趋势跟踪交易系统。策略设计充分考虑了趋势确认和动量确认两个维度,具有较好的可靠性和实用性。通过合理的优化和风险控制措施,策略可以在不同市场环境下保持稳定的表现。整体而言,这是一个逻辑严谨、实用性强的交易策略系统。
|
|
|
|
||
|
|
|
|
#### Overview
|
|
This strategy is a trend following system that combines technical analysis and price action. The core of the strategy utilizes 9-period and 15-period Exponential Moving Averages (EMA) as trend direction indicators, while incorporating full body candles (Marubozu) as momentum confirmation signals to form a complete trading decision system. Through analysis of moving average crossovers and price action, the strategy can capture major market trend changes and execute trades at appropriate times.
|
|
|
|
#### Strategy Principles
|
|
The strategy employs a dual filtering mechanism to confirm trading signals. First, it uses 9-period and 15-period EMAs to determine market trend direction. Second, it identifies full body candle patterns as momentum confirmation signals. A buy signal is generated when a full body bullish candle closes above both EMAs, while a sell signal is triggered when a full body bearish candle closes below both EMAs. A full body candle is defined as having its body occupy at least 75% of the total candle length, indicating strong unidirectional market movement during that period.
|
|
|
|
#### Strategy Advantages
|
|
1. High Signal Reliability: Combining EMAs and full body candles significantly improves trading signal reliability
|
|
2. Accurate Trend Capture: The dual EMA system effectively identifies market trends, avoiding frequent trading in ranging markets
|
|
3. Clear Execution Standards: Strategy entry and exit conditions are well-defined, facilitating quantitative implementation
|
|
4. Comprehensive Risk Control: Built-in reverse signal closing mechanism effectively controls position risk
|
|
5. Simple and Intuitive Operation: Strategy logic is simple to understand and execute, suitable for various types of traders
|
|
|
|
#### Strategy Risks
|
|
1. Lag Risk: Moving averages inherently have lag, potentially causing delayed entry timing
|
|
2. False Breakout Risk: Markets may exhibit false breakouts leading to incorrect signals
|
|
3. Range-bound Market Risk: Frequent false signals may occur during market consolidation periods
|
|
4. Gap Risk: Large price gaps may render stop losses ineffective
|
|
5. Parameter Optimization Risk: Optimal parameters may vary across different market environments
|
|
|
|
#### Optimization Directions
|
|
1. Introduce Volatility Filter: Add ATR indicator to filter trading signals in low volatility environments
|
|
2. Optimize Moving Average Periods: Adjust EMA periods according to different market characteristics
|
|
3. Add Trend Strength Confirmation: Incorporate ADX or similar trend strength indicators as auxiliary judgment tools
|
|
4. Improve Stop Loss Mechanism: Add trailing stop loss functionality for better profit protection
|
|
5. Add Market Environment Filter: Introduce market state judgment mechanism to automatically reduce trading frequency in ranging markets
|
|
|
|
#### Summary
|
|
This strategy builds a robust trend following trading system by combining moving average systems with full body candle signals. The strategy design fully considers both trend confirmation and momentum confirmation dimensions, offering good reliability and practicality. Through appropriate optimization and risk control measures, the strategy can maintain stable performance across different market environments. Overall, this is a logically rigorous and highly practical trading strategy system.
|
|
[/trans]
|
|
|
|
|
|
|
|
> Source (PineScript)
|
|
|
|
``` pinescript
|
|
/*backtest
|
|
start: 2024-10-25 00:00:00
|
|
end: 2024-11-24 00:00:00
|
|
period: 2h
|
|
basePeriod: 2h
|
|
exchanges: [{"eid":"Futures_Binance","currency":"BTC_USDT"}]
|
|
*/
|
|
|
|
//@version=5
|
|
strategy("9 & 15 EMA with Full Body Candle Strategy", overlay=true)
|
|
|
|
// Input parameters for EMAs
|
|
ema9Length = input.int(9, title="9-period EMA")
|
|
ema15Length = input.int(15, title="15-period EMA")
|
|
|
|
// Calculate the 9-period and 15-period EMAs
|
|
ema9 = ta.ema(close, ema9Length)
|
|
ema15 = ta.ema(close, ema15Length)
|
|
|
|
// Define full body (marubozu) candle conditions
|
|
fullBodyBullishCandle = (close > open) and (close - open >= (high - low) * 0.75)
|
|
fullBodyBearishCandle = (close < open) and (open - close >= (high - low) * 0.75)
|
|
|
|
// Buy condition: Full body candle closes above both EMAs
|
|
buySignal = fullBodyBullishCandle and close > ema9 and close > ema15
|
|
|
|
// Sell condition: Full body candle closes below both EMAs
|
|
sellSignal = fullBodyBearishCandle and close < ema9 and close < ema15
|
|
|
|
// Plot the EMAs on the chart
|
|
plot(ema9, color=color.blue, linewidth=2, title="9-period EMA")
|
|
plot(ema15, color=color.orange, linewidth=2, title="15-period EMA")
|
|
|
|
// Plot buy and sell signals
|
|
plotshape(series=buySignal, title="Buy Signal", location=location.belowbar, color=color.green, style=shape.labelup, text="BUY", size=size.small)
|
|
plotshape(series=sellSignal, title="Sell Signal", location=location.abovebar, color=color.red, style=shape.labeldown, text="SELL", size=size.small)
|
|
|
|
// Execute buy and sell strategy
|
|
if (buySignal)
|
|
strategy.entry("Buy", strategy.long)
|
|
|
|
if (sellSignal)
|
|
strategy.entry("Sell", strategy.short)
|
|
|
|
// Close buy position on sell signal
|
|
if (sellSignal)
|
|
strategy.close("Buy")
|
|
|
|
// Close sell position on buy signal
|
|
if (buySignal)
|
|
strategy.close("Sell")
|
|
|
|
```
|
|
|
|
> Detail
|
|
|
|
https://www.fmz.com/strategy/472974
|
|
|
|
> Last Modified
|
|
|
|
2024-11-25 17:30:46
|