
213 lines
6.6 KiB
Markdown
213 lines
6.6 KiB
Markdown
|
|
> Name
|
|
|
|
双均线价格跃动策略Dual-Moving-Average-Price-Leaping-Strategy
|
|
|
|
> Author
|
|
|
|
ChaoZhang
|
|
|
|
> Strategy Description
|
|
|
|
|
|
|
|
[trans]
|
|
|
|
### 概述
|
|
|
|
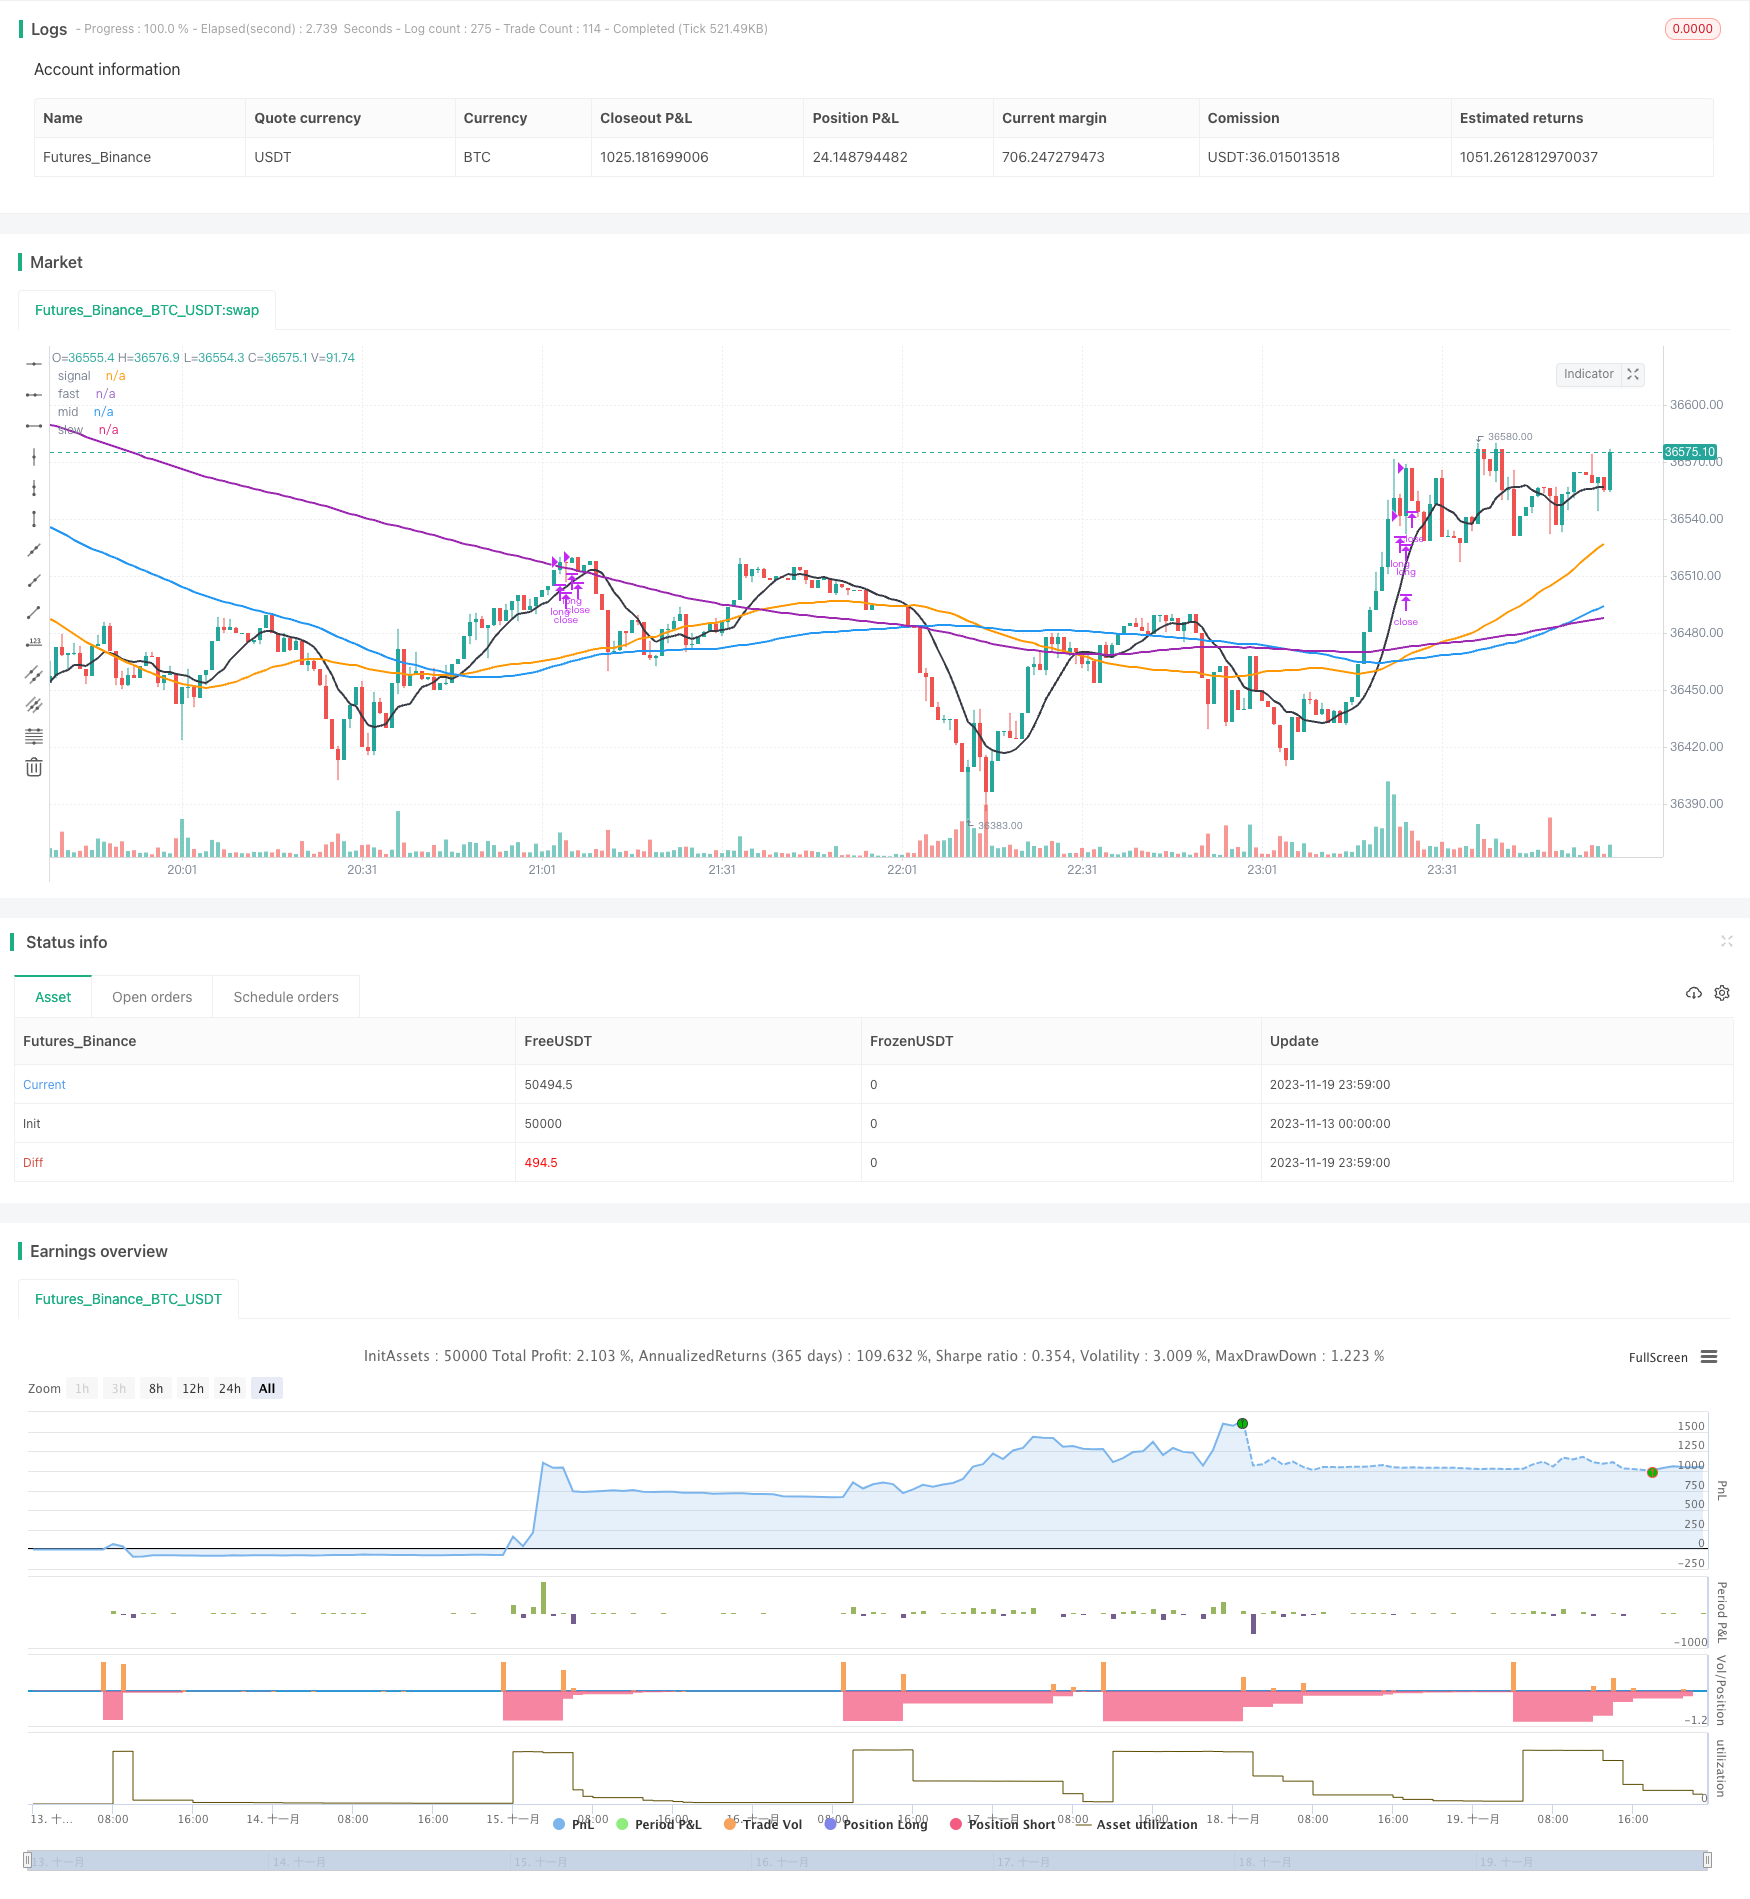
该策略通过RSI指标判断超买超卖,结合快线、中线、慢线构建的趋势判断体系,在价格跃动的时候判断机会建仓做多做空。
|
|
|
|
### 策略原理
|
|
|
|
1. 使用RSI指标判断超买超卖
|
|
|
|
- RSI参数设置为14周期
|
|
- 超卖线为30,超买线为70
|
|
|
|
2. 使用三条不同周期的SMA均线判断趋势
|
|
|
|
- 快线为9周期SMA,代表短期趋势
|
|
- 中线为50周期SMA,代表中期趋势
|
|
- 慢线为200周期SMA,代表长期趋势
|
|
|
|
3. 当快线上穿中线,并且RSI指标显示超卖时,做多入场
|
|
|
|
4. 当快线下穿中线,并且RSI指标显示超买时,做空入场
|
|
|
|
5. 停损设置为入场价格的4%
|
|
|
|
6. 获利方式为分批止盈,首先止盈20%,然后在价格继续上涨时止盈15%,依次退出仓位
|
|
|
|
### 优势分析
|
|
|
|
1. 使用三条不同周期的SMA均线,能对不同时间段的趋势变化做出判断
|
|
2. RSI指标的使用避免在非超买超卖区域建仓
|
|
3. 分批止盈增加了策略持仓周期,也增加了持仓平均获利
|
|
|
|
### 风险分析
|
|
|
|
1. 三条均线发出错误信号的概率
|
|
2. 分批止盈存在未全部成交的风险
|
|
3. 需要选择合适的股票品种,适合价格波动较大的股票
|
|
|
|
### 策略优化方向
|
|
|
|
1. 可以测试修改均线和RSI的参数,优化入场和出场机会
|
|
2. 可以增加其他指标过滤 candle 形态等,提高策略准确率
|
|
3. 可以通过动态跟踪止损,进一步控制风险
|
|
|
|
### 总结
|
|
|
|
本策略结合均线指标和超买超卖指标RSI,在捕捉价格变化趋势的同时对买卖机会进行判断,属于较为常见的跟踪趋势策略。通过参数测试和增加其他辅助判断指标,可以进一步优化和提高策略胜率。
|
|
|
|
||
|
|
|
|
### Overview
|
|
|
|
This strategy uses the RSI indicator to determine overbought and oversold conditions, combined with a trend judgment system constructed with fast, medium and slow moving average lines, to identify opportunities to open long or short positions when prices are leaping.
|
|
|
|
### Strategy Principle
|
|
|
|
1. Use RSI indicator to determine overbought and oversold conditions
|
|
|
|
- RSI parameter is set to 14 periods
|
|
- Oversold line is at 30, overbought line is at 70
|
|
|
|
2. Use three SMA lines of different periods to determine the trend
|
|
|
|
- Fast line is 9-period SMA, representing short-term trend
|
|
- Medium line is 50-period SMA, representing medium-term trend
|
|
- Slow line is 200-period SMA, representing long-term trend
|
|
|
|
3. When fast line crosses above medium line, and RSI indicator shows oversold, go long
|
|
|
|
4. When fast line crosses below medium line, and RSI indicator shows overbought, go short
|
|
|
|
5. Stop loss is set at 4% of entry price
|
|
|
|
6. Profit taking is done in batches, first take profit of 20%, then take 15% as price continues to rise, exiting positions gradually
|
|
|
|
### Advantage Analysis
|
|
|
|
1. Using three SMA lines of different periods can judge trend changes across different time frames
|
|
2. The use of RSI indicator avoids opening positions outside of overbought/oversold areas
|
|
3. Batch profit taking increases holding period and average profit of the strategy
|
|
|
|
### Risk Analysis
|
|
|
|
1. Probability of wrong signals from the three moving average lines
|
|
2. Risk of incomplete batch profit taking execution
|
|
3. Need to choose suitable instruments with high price fluctuation
|
|
|
|
### Optimization Directions
|
|
|
|
1. Can test modifying parameters of moving averages and RSI to optimize entry and exit
|
|
2. Can add other indicators to filter candle patterns etc to improve accuracy
|
|
3. Can dynamically trail stop loss to further control risk
|
|
|
|
### Summary
|
|
|
|
This strategy combines moving average indicators and the overbought/oversold indicator RSI. By capturing price trend changes while judging trading opportunities, it belongs to a commonly used trend tracking strategy. Further optimizations and improved win rate can be achieved through parameter testing and incorporating additional auxiliary judgment indicators.
|
|
|
|
[/trans]
|
|
|
|
> Strategy Arguments
|
|
|
|
|
|
|
|
|Argument|Default|Description|
|
|
|----|----|----|
|
|
|v_input_1|30|oversold|
|
|
|v_input_2|70|overbought|
|
|
|v_input_3|20|SellPct|
|
|
|v_input_4|15|ExitPct|
|
|
|v_input_5|9|v_input_5|
|
|
|v_input_6|50|v_input_6|
|
|
|v_input_7|200|v_input_7|
|
|
|v_input_8|100|v_input_8|
|
|
|v_input_9|12|Lookback Long Period|
|
|
|v_input_10|2|Lookback Short Period|
|
|
|v_input_11|4|v_input_11|
|
|
|
|
|
|
> Source (PineScript)
|
|
|
|
``` pinescript
|
|
/*backtest
|
|
start: 2023-11-13 00:00:00
|
|
end: 2023-11-20 00:00:00
|
|
period: 1m
|
|
basePeriod: 1m
|
|
exchanges: [{"eid":"Futures_Binance","currency":"BTC_USDT"}]
|
|
*/
|
|
|
|
// This source code is subject to the terms of the Mozilla Public License 2.0 at https://mozilla.org/MPL/2.0/
|
|
// © syfuslokust
|
|
|
|
//@version=4
|
|
strategy(shorttitle='CoinruleCombinedCryptoStrat',title='CoinruleCombinedCryptoStrat', overlay=true)
|
|
|
|
|
|
// RSI inputs and calculations
|
|
lengthRSI = 14
|
|
RSI = rsi(close, lengthRSI)
|
|
//Normal
|
|
oversold = input(30)
|
|
overbought = input(70)
|
|
//ALGO
|
|
//oversold= input(26)
|
|
//overbought= input(80)
|
|
|
|
//sell pct
|
|
SellPct = input(20)
|
|
ExitPct = input(15)
|
|
|
|
//MA inputs and calculations
|
|
movingaverage_signal = sma(close, input(9))
|
|
movingaverage_fast = sma(close, input(50))
|
|
movingaverage_slow = sma(close, input(200))
|
|
movingaverage_mid= sma(close, input(100))
|
|
|
|
//Look Back
|
|
inp_lkb = input(12, title='Lookback Long Period')
|
|
inp_lkb_2 = input(2, title='Lookback Short Period')
|
|
|
|
perc_change(lkb) =>
|
|
overall_change = ((close[0] - close[lkb]) / close[lkb]) * 100
|
|
|
|
//Entry
|
|
|
|
//MA
|
|
bullish = crossover(movingaverage_signal, movingaverage_fast)
|
|
//Execute buy
|
|
strategy.entry(id="long", long = true, when = (RSI < oversold and movingaverage_fast < movingaverage_mid))
|
|
|
|
//when = crossover(close, movingaverage_signal) and movingaverage_signal < movingaverage_slow and RSI < oversold)
|
|
|
|
//Exit
|
|
|
|
//RSI
|
|
Stop_loss= ((input (4))/100)
|
|
longStopPrice = strategy.position_avg_price * (1 - Stop_loss)
|
|
//MA
|
|
bearish = crossunder(movingaverage_signal, movingaverage_fast)
|
|
//Execute sell
|
|
strategy.close("long", qty_percent = SellPct, when = RSI > overbought and movingaverage_fast > movingaverage_mid)
|
|
//when = (crossunder(low, movingaverage_signal) and movingaverage_fast > movingaverage_slow and RSI > overbought) or (movingaverage_signal < movingaverage_fast and crossunder(low, movingaverage_fast)) or (low < longStopPrice))
|
|
|
|
|
|
//PLOT
|
|
plot(movingaverage_signal, color=color.black, linewidth=2, title="signal")
|
|
plot(movingaverage_fast, color=color.orange, linewidth=2, title="fast")
|
|
plot(movingaverage_slow, color=color.purple, linewidth=2, title="slow")
|
|
plot(movingaverage_mid, color=color.blue, linewidth=2, title="mid")
|
|
```
|
|
|
|
> Detail
|
|
|
|
https://www.fmz.com/strategy/432781
|
|
|
|
> Last Modified
|
|
|
|
2023-11-21 14:28:35
|