
230 lines
14 KiB
Markdown
230 lines
14 KiB
Markdown
|
|
> Name
|
|
|
|
双均线交叉量化交易策略基于短期与中期移动平均线突破系统-Dual-Moving-Average-Crossover-Trading-System-A-Quantitative-Strategy-Based-on-Short-term-and-Medium-term-MA-Breakthrough
|
|
|
|
> Author
|
|
|
|
ianzeng123
|
|
|
|
> Strategy Description
|
|
|
|
|
|
|
|
|
|
|
|
[trans]
|
|
#### 概述
|
|
|
|
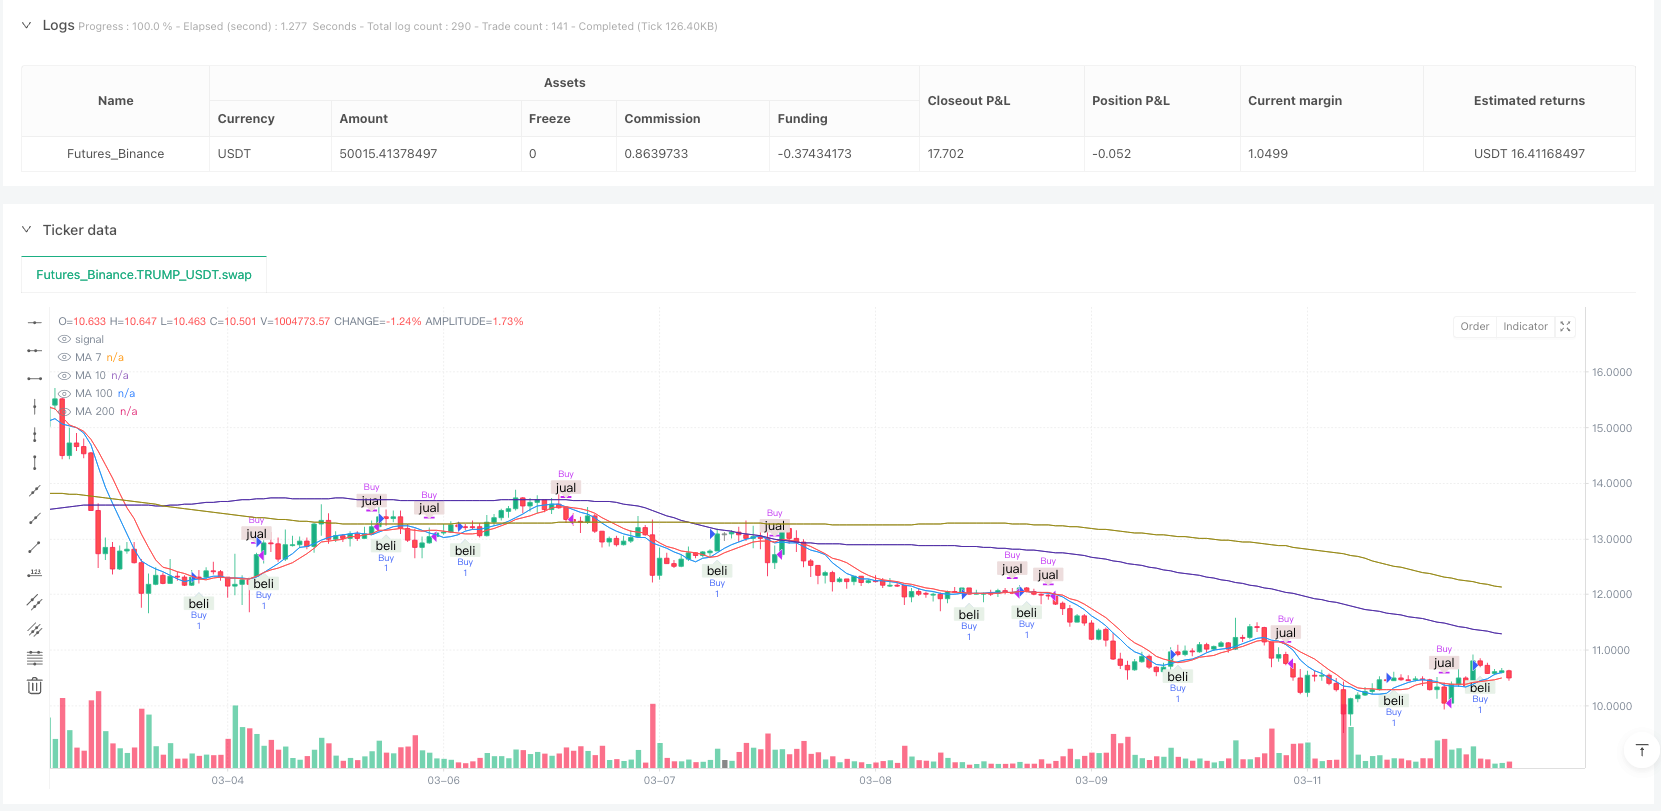
双均线交叉量化交易策略是一种基于技术分析的趋势跟踪系统,核心机制是利用短期移动平均线(MA7)与中期移动平均线(MA10)之间的交叉关系来生成买入和卖出信号。该策略还结合了长期移动平均线(MA100和MA200)作为市场趋势的参考指标,但主要交易信号依赖于短期和中期均线的交叉行为。当短期均线从下方突破中期均线时产生买入信号,反之当短期均线从上方跌破中期均线时产生卖出信号。这种交易方法简单直观,易于实现,适合于捕捉中短期的价格趋势变化。
|
|
|
|
#### 策略原理
|
|
|
|
该策略的核心原理基于移动平均线的交叉信号,具体实现逻辑如下:
|
|
|
|
1. 计算四条移动平均线:7日简单移动平均线(MA7)、10日简单移动平均线(MA10)、100日简单移动平均线(MA100)和200日简单移动平均线(MA200)。
|
|
|
|
2. 生成交易信号:
|
|
- 买入信号(buySignal):当MA7从下方突破MA10时(ta.crossover函数)。
|
|
- 卖出信号(sellSignal):当MA7从上方跌破MA10时(ta.crossunder函数)。
|
|
|
|
3. 交易执行逻辑:
|
|
- 出现买入信号时,系统开仓做多(strategy.entry)。
|
|
- 出现卖出信号时,系统平仓结束多头头寸(strategy.close)。
|
|
|
|
4. 在图表上标记交易信号:买入信号显示在K线下方,卖出信号显示在K线上方,便于视觉确认。
|
|
|
|
该策略依赖于均线交叉捕捉价格动量变化。在上升趋势中,短期均线位于中期均线上方,表明短期买入压力增强;在下降趋势中,短期均线位于中期均线下方,表明短期卖出压力增强。当两条均线交叉时,意味着市场动量发生变化,可能预示着趋势反转。
|
|
|
|
#### 策略优势
|
|
|
|
1. 简单易懂:策略基于经典的技术分析概念,逻辑清晰,易于理解和实施,适合初学者入门量化交易。
|
|
|
|
2. 趋势捕捉能力:双均线交叉系统能有效捕捉中短期价格趋势的变化,避免在市场横盘时频繁交易。
|
|
|
|
3. 自动化程度高:策略完全可以自动化执行,无需主观判断,减少了情绪因素干扰。
|
|
|
|
4. 适应性:通过调整移动平均线的周期,策略可以适应不同的市场环境和交易品种。
|
|
|
|
5. 视觉直观:在图表上清晰标记买卖信号,方便交易者回测分析和实时监控。
|
|
|
|
6. 风险管理清晰:有明确的入场和出场规则,利于资金管理和风险控制。
|
|
|
|
7. 计算效率高:使用简单移动平均线(SMA)计算,计算负担小,适合实时交易系统。
|
|
|
|
#### 策略风险
|
|
|
|
1. 滞后性问题:移动平均线本质上是滞后指标,信号产生可能已经错过最佳入场点,在快速变化的市场中可能导致亏损。
|
|
|
|
2. 震荡市场的假信号:在横盘震荡市场中,均线频繁交叉会产生大量假信号,导致频繁交易和佣金侵蚀。
|
|
|
|
3. 缺乏止损机制:代码中没有设置明确的止损策略,在趋势反转强烈时可能面临较大亏损。
|
|
|
|
4. 参数固定风险:固定的移动平均线周期(7、10、100、200)可能不适合所有市场环境,缺乏自适应性。
|
|
|
|
5. 单一指标依赖:仅依赖均线交叉可能缺乏全面的市场视角,忽略了基本面和其他技术指标的信息。
|
|
|
|
6. 无交易量确认:策略没有结合交易量分析,可能导致在低成交量情况下的虚假突破信号。
|
|
|
|
7. 缺乏动态仓位管理:策略使用固定仓位入场,没有根据市场波动性调整仓位大小。
|
|
|
|
#### 策略优化方向
|
|
|
|
1. 引入止损机制:添加固定止损或ATR动态止损,保护资金安全,如`strategy.exit("止损", "Buy", stop=close * 0.95)`。
|
|
|
|
2. 加入趋势过滤条件:可以增加MA100和MA200作为趋势过滤器,只在长期均线指示的主趋势方向上交易,例如仅在价格位于MA200之上时做多。
|
|
|
|
3. 增加交易量确认:结合成交量指标验证信号有效性,避免低成交量下的虚假突破。
|
|
|
|
4. 优化均线参数:可以通过回测不同的均线周期组合,找到特定市场环境下的最优参数,或考虑使用自适应均线。
|
|
|
|
5. 添加其他技术指标:结合RSI、MACD等指标形成多重确认系统,提高信号质量。
|
|
|
|
6. 实现动态仓位管理:根据波动率(如ATR)动态调整仓位大小,在波动率高时减小仓位,波动率低时增加仓位。
|
|
|
|
7. 加入市场环境判断:区分趋势市场和震荡市场,在不同环境下采用不同的交易策略或参数。
|
|
|
|
8. 改进平仓逻辑:可以设计更精细的平仓条件,如部分止盈或者跟踪止损,优化盈利结构。
|
|
|
|
#### 总结
|
|
|
|
双均线交叉量化交易策略是一个基于技术分析的经典趋势跟踪系统,通过MA7和MA10的交叉关系捕捉市场动量变化并执行交易。该策略优势在于逻辑简单,易于理解与实施,能够有效捕捉中短期趋势变化。然而,它也面临着均线滞后性、震荡市场假信号多、缺乏止损机制等风险。
|
|
|
|
为了提升策略表现,我们可以通过加入止损机制、趋势过滤、交易量确认、参数优化以及结合其他技术指标等方式进行改进。此外,实现动态仓位管理和区分市场环境的交易逻辑也是潜在的优化方向。
|
|
|
|
总之,双均线交叉策略为交易者提供了一个良好的量化交易起点,通过合理的优化和风险管理,可以发展成为一个更加稳健和高效的交易系统。适合作为新手入门量化交易的第一个策略,也可以作为经验丰富的交易者策略组合中的一部分。
|
|
||
|
|
#### Overview
|
|
|
|
The Dual Moving Average Crossover Trading System is a trend-following strategy based on technical analysis. Its core mechanism utilizes the crossover relationship between short-term moving average (MA7) and medium-term moving average (MA10) to generate buy and sell signals. The strategy also incorporates long-term moving averages (MA100 and MA200) as reference indicators for market trends, although the primary trading signals rely on the crossover behavior of the short and medium-term moving averages. A buy signal is generated when the short-term MA crosses above the medium-term MA, while a sell signal occurs when the short-term MA crosses below the medium-term MA. This trading approach is simple, intuitive, easy to implement, and suitable for capturing medium to short-term price trend changes.
|
|
|
|
#### Strategy Principles
|
|
|
|
The core principle of this strategy is based on moving average crossover signals, with the following implementation logic:
|
|
|
|
1. Calculate four moving averages: 7-day simple moving average (MA7), 10-day simple moving average (MA10), 100-day simple moving average (MA100), and 200-day simple moving average (MA200).
|
|
|
|
2. Generate trading signals:
|
|
- Buy signal (buySignal): When MA7 crosses above MA10 (ta.crossover function).
|
|
- Sell signal (sellSignal): When MA7 crosses below MA10 (ta.crossunder function).
|
|
|
|
3. Trading execution logic:
|
|
- When a buy signal appears, the system enters a long position (strategy.entry).
|
|
- When a sell signal appears, the system closes the long position (strategy.close).
|
|
|
|
4. Mark trading signals on the chart: Buy signals are displayed below the candles, and sell signals are displayed above the candles for visual confirmation.
|
|
|
|
The strategy relies on moving average crossovers to capture price momentum changes. In an uptrend, the short-term MA is positioned above the medium-term MA, indicating strengthened buying pressure in the short term; in a downtrend, the short-term MA is positioned below the medium-term MA, indicating strengthened selling pressure. When the two moving averages cross, it suggests a change in market momentum, potentially signaling a trend reversal.
|
|
|
|
#### Strategy Advantages
|
|
|
|
1. Simplicity: The strategy is based on classic technical analysis concepts, with clear logic that is easy to understand and implement, making it suitable for beginners entering quantitative trading.
|
|
|
|
2. Trend-capturing ability: The dual moving average crossover system effectively captures medium to short-term price trend changes, avoiding frequent trading during sideways markets.
|
|
|
|
3. High degree of automation: The strategy can be fully automated, requiring no subjective judgment, thus reducing emotional interference.
|
|
|
|
4. Adaptability: By adjusting the moving average periods, the strategy can adapt to different market environments and trading instruments.
|
|
|
|
5. Visual intuitiveness: Trading signals are clearly marked on the chart, facilitating backtesting analysis and real-time monitoring.
|
|
|
|
6. Clear risk management: With well-defined entry and exit rules, it supports effective capital management and risk control.
|
|
|
|
7. Computational efficiency: Using simple moving averages (SMA) for calculations reduces computational burden, making it suitable for real-time trading systems.
|
|
|
|
#### Strategy Risks
|
|
|
|
1. Lag issues: Moving averages are inherently lagging indicators, and signals may be generated after missing the optimal entry point, potentially leading to losses in rapidly changing markets.
|
|
|
|
2. False signals in oscillating markets: In sideways, oscillating markets, frequent moving average crossovers can generate numerous false signals, resulting in frequent trading and commission erosion.
|
|
|
|
3. Lack of stop-loss mechanism: The code does not include a clear stop-loss strategy, which could lead to significant losses during strong trend reversals.
|
|
|
|
4. Fixed parameter risk: The fixed moving average periods (7, 10, 100, 200) may not be suitable for all market environments, lacking adaptability.
|
|
|
|
5. Single indicator dependence: Relying solely on moving average crossovers may lack a comprehensive market perspective, ignoring information from fundamentals and other technical indicators.
|
|
|
|
6. No volume confirmation: The strategy does not incorporate volume analysis, potentially leading to false breakout signals in low-volume situations.
|
|
|
|
7. Lack of dynamic position sizing: The strategy uses fixed position sizing for entry, without adjusting position size based on market volatility.
|
|
|
|
#### Strategy Optimization Directions
|
|
|
|
1. Introduce stop-loss mechanisms: Add fixed stop-loss or ATR-based dynamic stop-loss to protect capital, such as `strategy.exit("StopLoss", "Buy", stop=close * 0.95)`.
|
|
|
|
2. Add trend filtering conditions: Utilize MA100 and MA200 as trend filters, trading only in the direction of the main trend indicated by the long-term moving averages, such as only going long when price is above MA200.
|
|
|
|
3. Incorporate volume confirmation: Combine volume indicators to verify signal validity, avoiding false breakouts during low-volume periods.
|
|
|
|
4. Optimize moving average parameters: Backtest different combinations of moving average periods to find optimal parameters for specific market environments, or consider using adaptive moving averages.
|
|
|
|
5. Add additional technical indicators: Combine RSI, MACD, or other indicators to form a multi-confirmation system, improving signal quality.
|
|
|
|
6. Implement dynamic position sizing: Adjust position size dynamically based on volatility (such as ATR), reducing position size during high volatility and increasing it during low volatility.
|
|
|
|
7. Add market environment assessment: Differentiate between trending and oscillating markets, applying different trading strategies or parameters in different environments.
|
|
|
|
8. Improve exit logic: Design more sophisticated exit conditions, such as partial profit-taking or trailing stops, to optimize profit structure.
|
|
|
|
#### Summary
|
|
|
|
The Dual Moving Average Crossover Trading System is a classic trend-following system based on technical analysis that captures market momentum changes and executes trades through the crossover relationship between MA7 and MA10. The strategy's advantages lie in its simple logic, ease of understanding and implementation, and effective capture of medium to short-term trend changes. However, it also faces risks such as moving average lag, multiple false signals in oscillating markets, and lack of stop-loss mechanisms.
|
|
|
|
To enhance strategy performance, we can make improvements by adding stop-loss mechanisms, trend filtering, volume confirmation, parameter optimization, and combining other technical indicators. Additionally, implementing dynamic position sizing and market environment-specific trading logic are potential optimization directions.
|
|
|
|
In conclusion, the dual moving average crossover strategy provides traders with a good starting point for quantitative trading. Through reasonable optimization and risk management, it can be developed into a more robust and efficient trading system. It is suitable as a first strategy for beginners entering quantitative trading, and can also serve as part of an experienced trader's strategy portfolio.
|
|
[/trans]
|
|
|
|
|
|
|
|
> Source (PineScript)
|
|
|
|
``` pinescript
|
|
/*backtest
|
|
start: 2025-01-18 19:45:00
|
|
end: 2025-03-12 08:00:00
|
|
period: 1h
|
|
basePeriod: 1h
|
|
exchanges: [{"eid":"Futures_Binance","currency":"TRUMP_USDT"}]
|
|
*/
|
|
|
|
//@version=5
|
|
strategy("Backtest Buy and Sell Signals with MA 7 and MA 10", overlay=true)
|
|
|
|
// Calculate Moving Averages
|
|
ma7 = ta.sma(close, 7)
|
|
ma10 = ta.sma(close, 10)
|
|
ma100 = ta.sma(close, 100)
|
|
ma200 = ta.sma(close, 200)
|
|
|
|
// Plot MAs
|
|
plot(ma7, color=color.blue, title="MA 7")
|
|
plot(ma10, color=color.red, title="MA 10")
|
|
plot(ma100, color=#512ca8, title="MA 100")
|
|
plot(ma200, color=color.rgb(152, 139, 20), title="MA 200")
|
|
|
|
// Buy and Sell Signals
|
|
buySignal = ta.crossover(ma7, ma10)
|
|
sellSignal = ta.crossunder(ma7, ma10)
|
|
|
|
// Display signals on the chart
|
|
plotshape(buySignal, style=shape.labelup, location=location.belowbar, color=color.rgb(231, 241, 232), size=size.small, title="Buy Signal", text="buy")
|
|
plotshape(sellSignal, style=shape.labeldown, location=location.abovebar, color=color.rgb(237, 221, 221), size=size.small, title="Sell Signal", text="sell")
|
|
|
|
// Entry and Exit Logic
|
|
if (buySignal)
|
|
strategy.entry("Buy", strategy.long)
|
|
|
|
if (sellSignal)
|
|
strategy.close("Buy")
|
|
|
|
```
|
|
|
|
> Detail
|
|
|
|
https://www.fmz.com/strategy/486564
|
|
|
|
> Last Modified
|
|
|
|
2025-03-14 09:27:34
|