
274 lines
13 KiB
Markdown
274 lines
13 KiB
Markdown
|
||
> Name
|
||
|
||
双均线三指数指标交易策略Dual-Moving-Average-Triple-Exponential-Indicator-Trading-Strategy
|
||
|
||
> Author
|
||
|
||
ChaoZhang
|
||
|
||
> Strategy Description
|
||
|
||
|
||
[trans]
|
||
|
||
## 概述
|
||
|
||
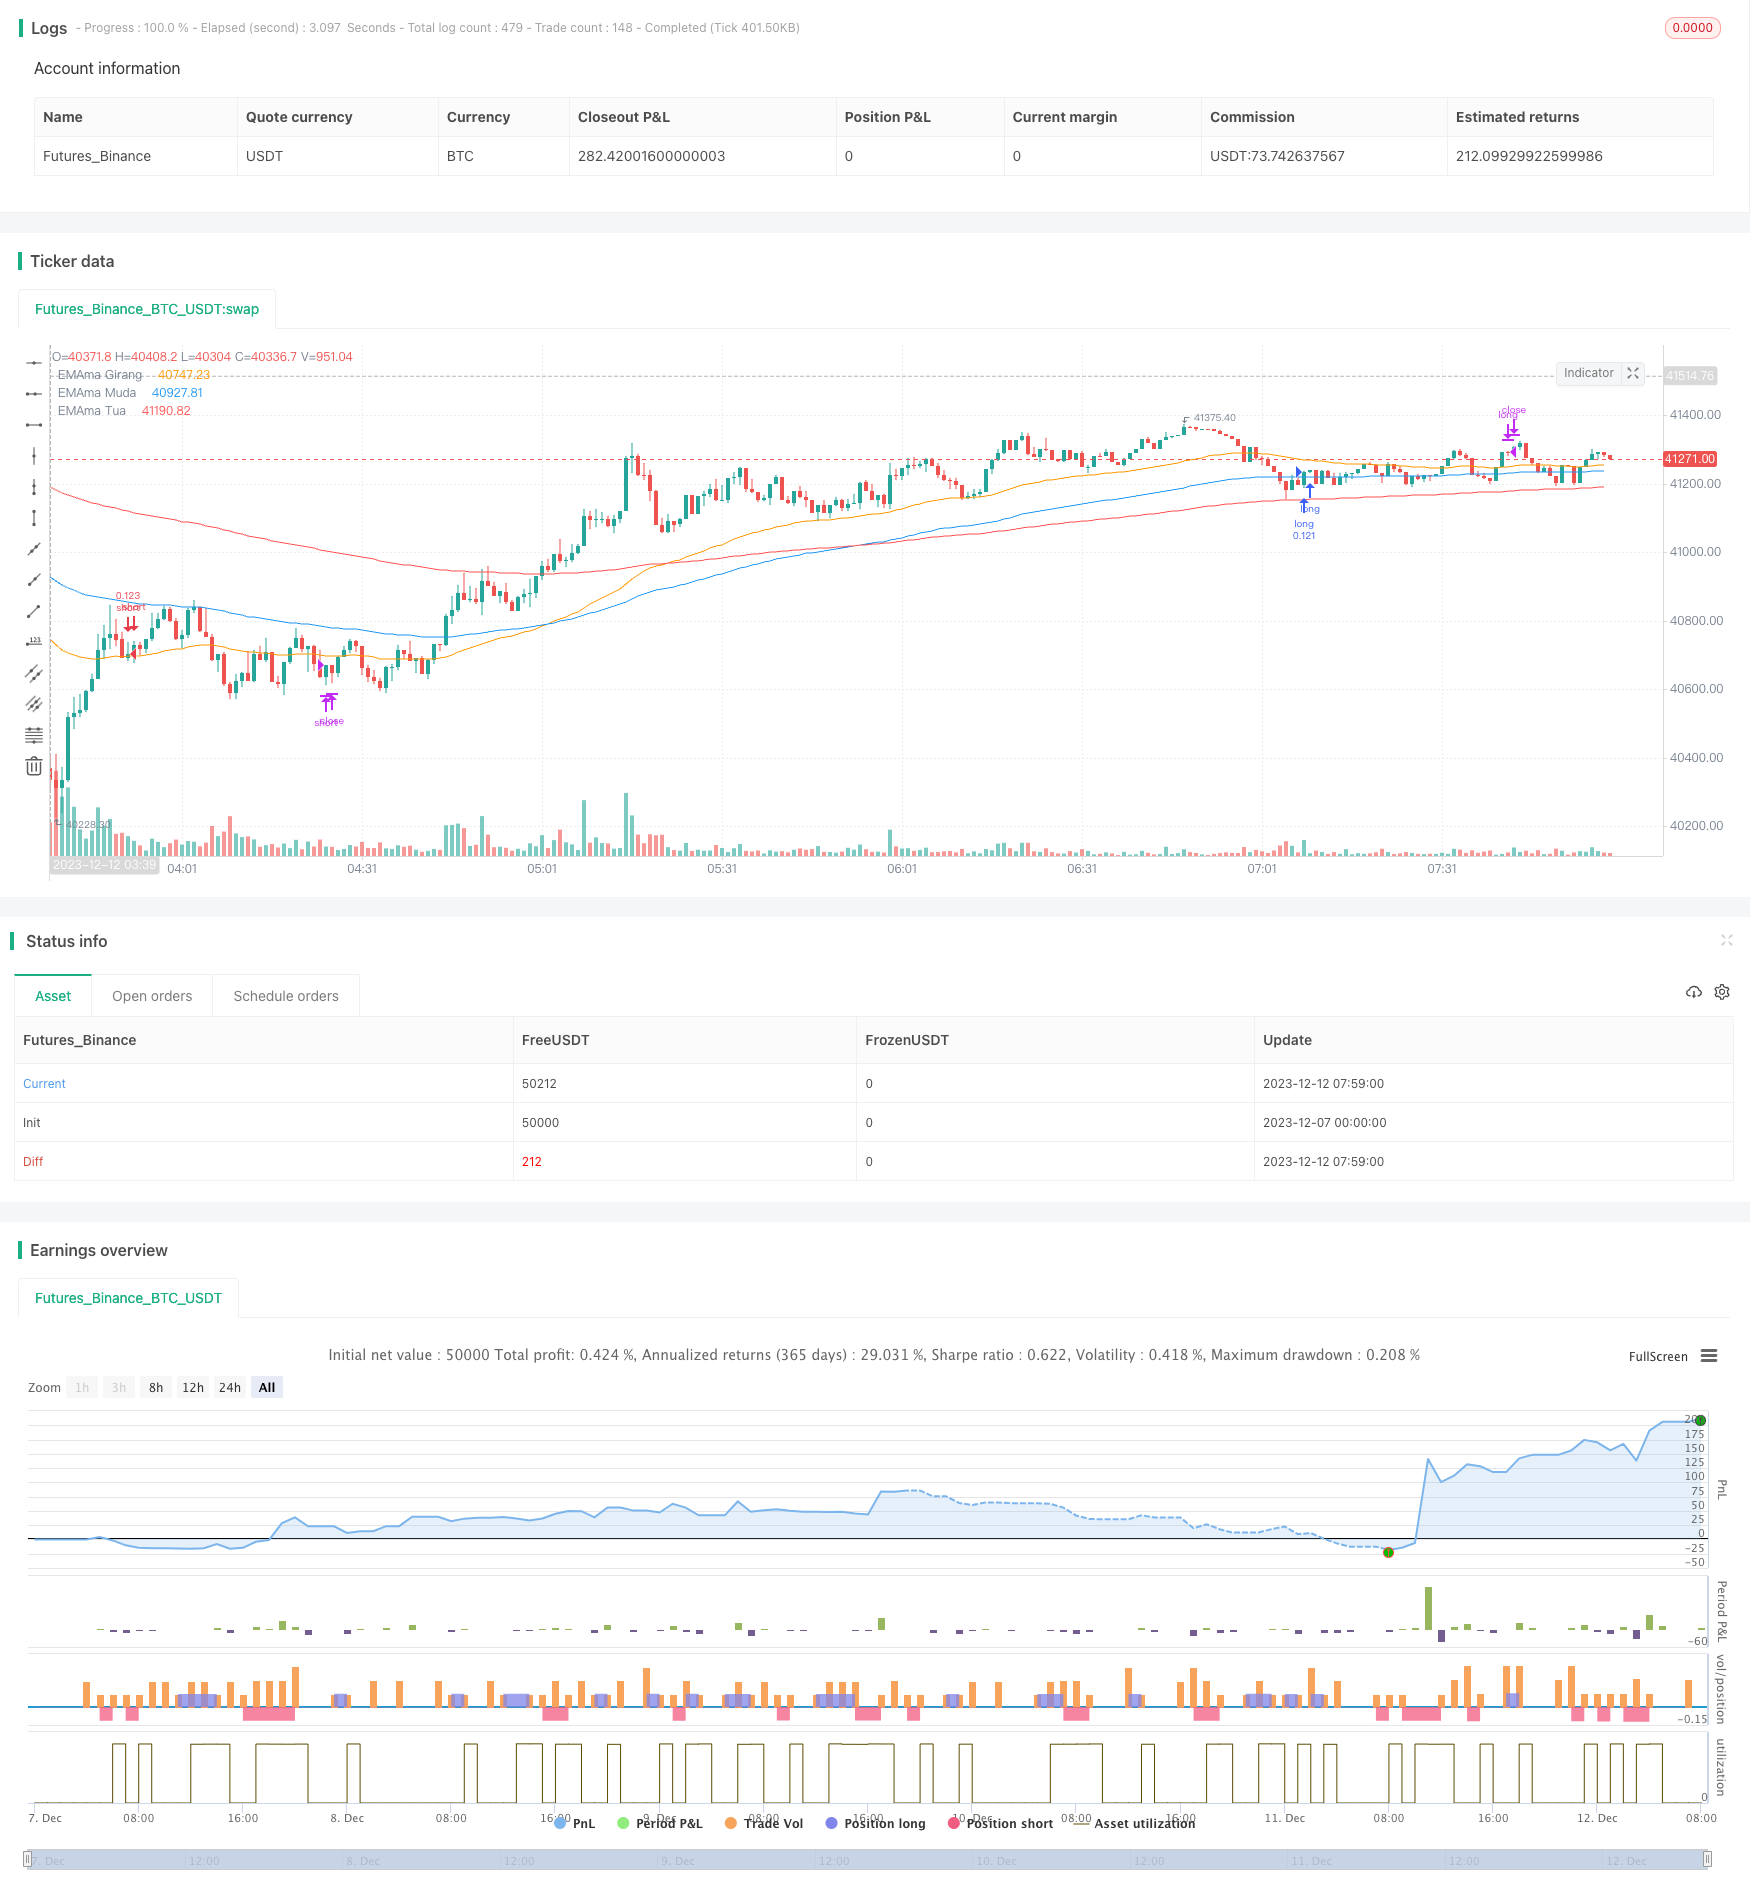
本策略运用双均线指标和三指数均线指标,结合随机指标,形成一个较为稳定可靠的趋势追踪交易策略。其主要思想是在均线指标判断出现金叉或死叉时,发出交易信号;而随机指标则用于辅助判断超买超卖情况,避免在市场剧烈波动时产生错误信号。
|
||
|
||
## 原理
|
||
|
||
该策略主要由四个部分组成:
|
||
|
||
1. 双均线指标:分别计算50周期和100周期的指数移动平均线(EMA),当短期EMA上穿长期EMA时产生买入信号,下穿时产生卖出信号。
|
||
|
||
2. 三指数指标:分别计算50周期、100周期和200周期的指数移动平均线,用于判断市场趋势方向。当50EMA>100EMA>200EMA时为多头市场,50EMA<100EMA<200EMA时为空头市场。
|
||
|
||
3. 随机指标:计算RSI的6日K值和D值,判断超买超卖情况。K值上穿D值时为超卖,下穿时为超买。
|
||
|
||
4. 交易信号:只有在双均线指标产生信号的同时,市场也符合三指数均线的多头或空头状态,且随机指标未显示超买超卖时,才发出真正的交易指令。
|
||
|
||
## 优势
|
||
|
||
这套策略综合运用均线指标和随机指标的优点,在发出交易信号时既考虑了趋势方向的判断,也参考了市场的超买超卖状态,从而可以较好的过滤噪音,追踪较为明确的趋势。另外,它采用三指数均线来判断整体趋势,使得信号更加可靠。这套策略简单易懂,容易实施,也易于优化。
|
||
|
||
## 风险及对策
|
||
|
||
该策略最大的风险在于它依赖指标判断,当指标发出错误信号时容易导致交易失败。此外,采用较长周期均线指标判断整体趋势时,也可能错过短期机会。主要的风险对策如下:
|
||
|
||
1. 优化指标参数,调整双均线和三指数均线的周期组合,使其更加匹配市场特征。
|
||
|
||
2. 结合更多指标进行CANCEL操作,在判断市场出现剧烈波动时中止当前交易。
|
||
|
||
3. 采用短线多头策略进行辅助,在长线多头市场中利用短期机会进行盈利。
|
||
|
||
## 优化方向
|
||
|
||
该策略主要可以从以下几个方面进行优化:
|
||
|
||
1. 调整双均线和三指数均线的周期参数,优化指标顺应市场特征。
|
||
|
||
2. 增加VOLUME和MACD等指标判断,避免价格异常造成错误信号。
|
||
|
||
3. 利用candle模式更好确认趋势,避免短期回撤后的错误信号。
|
||
|
||
4. 扩展至股票、外汇等更多品种,检验策略的适应性。
|
||
|
||
5. 结合VIX指标判断整体市场波动率,控制仓位规模。
|
||
|
||
## 总结
|
||
|
||
本策略利用双均线指标发出交易信号,三指数均线和随机指标进行辅助判断,从而构建一个较为稳定的趋势追踪策略。它简单易懂,易于实施,与市场特征匹配度高,收益较为稳定,是一套值得推荐的量化策略。通过针对性优化,有望获得更好的效果。
|
||
|
||
||
|
||
|
||
## Overview
|
||
|
||
This strategy uses dual moving average indicators and triple exponential moving average indicators, combined with stochastic indicators, to form a relatively stable and reliable trend tracking trading strategy. Its main idea is to issue trading signals when the moving average indicator detects golden crosses or death crosses; while the stochastic indicator is used to assist in judging overbought and oversold situations to avoid generating wrong signals during drastic market fluctuations.
|
||
|
||
## Principles
|
||
|
||
This strategy consists mainly of four parts:
|
||
|
||
1. Dual Moving Average Indicator: Calculates the 50-period and 100-period exponential moving averages (EMA) respectively. It generates a buy signal when the short-term EMA crosses above the long-term EMA, and a sell signal when crossing below.
|
||
|
||
2. Triple Exponential Indicator: Calculates the 50-period, 100-period and 200-period exponential moving averages to determine the market trend direction. When 50EMA>100EMA>200EMA, it is a bullish market. When 50EMA<100EMA<200EMA, it is a bearish market.
|
||
|
||
3. Stochastic Indicator: Calculates the 6-day K and D values of RSI to determine overbought and oversold conditions. When the K value crosses above the D value, it is oversold. When crossing below, it is overbought.
|
||
|
||
4. Trading Signals: Only when the dual moving average indicator generates a signal at the same time when the market conforms to the bullish or bearish state of the triple exponential moving average, and the stochastic indicator does not show overbought or oversold, will true trading orders be issued.
|
||
|
||
## Advantages
|
||
|
||
This strategy combines the advantages of moving average indicators and stochastic indicators. It takes into account both the judgment of trend direction and the overbought/oversold state of the market when issuing trading signals, thereby filtering out noise more effectively to track clearer trends. In addition, it uses the triple exponential moving average to determine the overall trend, making the signals more reliable. This strategy is simple, easy to implement, and easy to optimize.
|
||
|
||
## Risks and Countermeasures
|
||
|
||
The biggest risk of this strategy is that it relies on indicator judgments. When the indicator gives out wrong signals, it can easily lead to failed trades. In addition, when using longer cycle moving averages to determine the overall trend, some short-term opportunities may also be missed out. The main risk countermeasures are as follows:
|
||
|
||
1. Optimize indicator parameters and adjust the cycle combinations of dual moving averages and triple exponential moving averages to match them better to market characteristics.
|
||
|
||
2. Incorporate more indicators for CANCEL operations, terminating current trades when the market shows drastic fluctuations.
|
||
|
||
3. Employ auxiliary short-term bullish strategies to capitalize on short-term opportunities in long-term bull markets.
|
||
|
||
## Optimization Directions
|
||
|
||
The main aspects where this strategy can be optimized include:
|
||
|
||
1. Adjust the cycle parameters of the dual moving average and triple exponential moving average to optimize the indicators’ adaptation to market characteristics.
|
||
|
||
2. Increase VOLUME, MACD and other judgments to avoid abnormal price movements causing wrong signals.
|
||
|
||
3. Better confirm trends using candlestick patterns to avoid wrong signals after short-term pullbacks.
|
||
|
||
4. Expand it to more varieties like stocks, forex and test adaptability of the strategy.
|
||
|
||
5. Incorporate VIX indicators to determine overall market volatility and control position sizing.
|
||
|
||
## Conclusion
|
||
|
||
This strategy uses dual moving average indicators to issue trading signals, with triple exponential moving averages and stochastic indicators as complements, thereby constructing a relatively stable trend tracking strategy. It is simple, easy to implement, highly matched with market characteristics, delivering stable returns. It is a worthwhile quantitative strategy to recommend. Through targeted optimizations, it has the potential to achieve even better results.
|
||
[/trans]
|
||
|
||
> Strategy Arguments
|
||
|
||
|
||
|
||
|Argument|Default|Description|
|
||
|----|----|----|
|
||
|v_input_bool_1|true|(?Date Range)Start Date & Time|
|
||
|v_input_1|timestamp(16 Apr 2021)|startPeriodTime|
|
||
|v_input_bool_2|false|End Date & Time|
|
||
|v_input_2|timestamp(31 Dec 2222)|endPeriodTime|
|
||
|v_input_bool_3|false|Highlight|
|
||
|v_input_string_1|0|highlightType: Anchors|Background|
|
||
|v_input_color_1|white|highlightColor|
|
||
|v_input_3_close|0|(?Support)Source: close|high|low|open|hl2|hlc3|hlcc4|ohlc4|
|
||
|v_input_4|true|Show EMA|
|
||
|v_input_int_1|6|(?Stochastic RSI)K|
|
||
|v_input_int_2|6|D|
|
||
|v_input_int_3|28|RSI Length|
|
||
|v_input_int_4|28|Stoch Length|
|
||
|v_input_int_5|50|(?Moving Average Exponential)EMAma Girang|
|
||
|v_input_int_6|100|EMAma Muda|
|
||
|v_input_int_7|200|EMAma Tua|
|
||
|
||
|
||
> Source (PineScript)
|
||
|
||
``` pinescript
|
||
/*backtest
|
||
start: 2023-12-07 00:00:00
|
||
end: 2023-12-12 08:00:00
|
||
period: 1m
|
||
basePeriod: 1m
|
||
exchanges: [{"eid":"Futures_Binance","currency":"BTC_USDT"}]
|
||
*/
|
||
|
||
//@version=5
|
||
strategy(title='5212 EMA Strategy', shorttitle='5212 EMA', overlay=true, pyramiding=0, default_qty_type=strategy.percent_of_equity, default_qty_value=10, calc_on_every_tick=false)
|
||
|
||
//**Backtest Date sof
|
||
useStartPeriodTime = input.bool(true , 'Start Date & Time' , group='Date Range' , inline='Start Period')
|
||
startPeriodTime = input(timestamp('16 Apr 2021') , '' , group='Date Range' , inline='Start Period')
|
||
useEndPeriodTime = input.bool(false , 'End Date & Time' , group='Date Range' , inline='End Period')
|
||
endPeriodTime = input(timestamp('31 Dec 2222') , '' , group='Date Range' , inline='End Period')
|
||
enableHighlight = input.bool(false , 'Highlight' , group='Date Range' , inline='Highlight')
|
||
highlightType = input.string('Anchors' , '' , group='Date Range' , inline='Highlight' , options=['Anchors', 'Background'])
|
||
highlightColor = input.color(color.white , '' , group='Date Range' , inline='Highlight')
|
||
start = useStartPeriodTime ? startPeriodTime >= time : false
|
||
end = useEndPeriodTime ? endPeriodTime <= time : false
|
||
calcPeriod = true
|
||
// var line startAnchor = line.new(na, na, na, na, xloc.bar_time, extend.both, highlightColor, width=2)
|
||
// var line endAnchor = line.new(na, na, na, na, xloc.bar_time, extend.both, highlightColor, width=2)
|
||
// useBgcolor = false
|
||
// if enableHighlight
|
||
// if highlightType == 'Anchors'
|
||
// if useStartPeriodTime
|
||
// line.set_xy1(startAnchor, startPeriodTime, low)
|
||
// line.set_xy2(startAnchor, startPeriodTime, high)
|
||
// if useEndPeriodTime
|
||
// line.set_xy1(endAnchor, calcPeriod ? time : line.get_x1(endAnchor), low)
|
||
// line.set_xy2(endAnchor, calcPeriod ? time : line.get_x1(endAnchor), high)
|
||
|
||
// if highlightType == 'Background'
|
||
// useBgcolor := true
|
||
// useBgcolor
|
||
|
||
// bgcolor(useBgcolor and calcPeriod ? color.new(highlightColor,90) : na, editable=false)
|
||
//**Backtest Date eof
|
||
|
||
src =input(close , 'Source' , group='Support')
|
||
showEMA = input(true , 'Show EMA' , group='Support')
|
||
|
||
//**Stochastic RSI sof
|
||
smoothK = input.int(6 , "K" , group='Stochastic RSI' , minval=1)
|
||
smoothD = input.int(6 , "D" , group='Stochastic RSI' , minval=1)
|
||
lengthRSI = input.int(28 , "RSI Length" , group='Stochastic RSI' , minval=1)
|
||
lengthStoch = input.int(28 , "Stoch Length" , group='Stochastic RSI' , minval=1)
|
||
|
||
rsi1 = ta.rsi(src, lengthRSI)
|
||
k = ta.sma(ta.stoch(rsi1, rsi1, rsi1, lengthStoch), smoothK)
|
||
d = ta.sma(k, smoothD)
|
||
//**STochastic RSI eof
|
||
|
||
//** EMA sof
|
||
emain01 = input.int(50 , "EMAma Girang" , group='Moving Average Exponential' , minval=1)
|
||
emain02 = input.int(100 , "EMAma Muda" , group='Moving Average Exponential' , minval=1)
|
||
emain03 = input.int(200 , "EMAma Tua" , group='Moving Average Exponential' , minval=1)
|
||
|
||
ema01 = ta.ema(src, emain01)
|
||
ema02 = ta.ema(src, emain02)
|
||
ema03 = ta.ema(src, emain03)
|
||
plot(showEMA ? ema01 : na, 'EMAma Girang' , color = color.new(color.orange, 0))
|
||
plot(showEMA ? ema02 : na, 'EMAma Muda' , color = color.new(color.blue, 0))
|
||
plot(showEMA ? ema03 : na, 'EMAma Tua' , color = color.new(color.red, 0))
|
||
//** EMA eof
|
||
|
||
//**Condition sof
|
||
emaLong = ema01 > ema02 and ema02 > ema03 and low > ema03
|
||
emaShort = ema01 < ema02 and ema02 < ema03 and high < ema03
|
||
|
||
longCond = ta.crossover(k,d) and k <= 23 and emaLong
|
||
shortCond = ta.crossunder(k,d) and k >= 77 and emaShort
|
||
|
||
longClose = ta.crossunder(k,d) and k <= 77
|
||
shortClose = ta.crossover(k,d) and k >= 23
|
||
longCross = ta.crossover(ema01, ema02)
|
||
shortCross = ta.crossunder(ema01, ema02)
|
||
//**Condition eof
|
||
|
||
//**Strategy sof
|
||
if calcPeriod and longCond
|
||
strategy.entry('long', strategy.long, when=longCond, comment='EN Long')
|
||
strategy.close('long', when=shortClose, comment='EX Long')
|
||
strategy.close('long', when=shortCross, comment='MD Short')
|
||
|
||
if calcPeriod and shortCond
|
||
strategy.entry('short', strategy.short, when=shortCond, comment='EN Short')
|
||
strategy.close('short', when=longClose, comment='EX Short')
|
||
strategy.close('short', when=longCross, comment='MD Long')
|
||
|
||
if calcPeriod == false and ta.crossover(ema01, ema02) or ta.crossunder(ema01, ema02)
|
||
strategy.cancel('long')
|
||
strategy.cancel('short')
|
||
//**Strategy eof
|
||
|
||
//**Label sof
|
||
entryText = str.tostring(strategy.position_avg_price, '##.###')
|
||
longText = 'Long Entry : ' + entryText
|
||
shortText = 'Short Entry : ' + entryText
|
||
noTrade = 'Sleeping Mode'
|
||
|
||
LongTrade = strategy.position_size > 0
|
||
ShortTrade = strategy.position_size < 0
|
||
|
||
Tekslabel = LongTrade ? longText : ShortTrade ? shortText : noTrade
|
||
|
||
xPosition = timenow + math.round(ta.change(time)*1)
|
||
yPosition = ta.highest(1)
|
||
labelColor = LongTrade ? color.new(color.aqua, 0) : ShortTrade ? color.new(color.red, 0) : color.new(color.gray, 0)
|
||
textColor = LongTrade ? color.new(color.black, 0) : ShortTrade ? color.new(color.white, 0) : color.new(color.white, 0)
|
||
|
||
// lab_l = label.new(
|
||
// xPosition, yPosition, Tekslabel,
|
||
// color=labelColor,
|
||
// textcolor=textColor,
|
||
// style = label.style_label_left,
|
||
// textalign=text.align_left,
|
||
// xloc=xloc.bar_time, yloc = yloc.price)
|
||
|
||
// label.delete(lab_l[1])
|
||
//**Strategy eof
|
||
|
||
```
|
||
|
||
> Detail
|
||
|
||
https://www.fmz.com/strategy/435503
|
||
|
||
> Last Modified
|
||
|
||
2023-12-15 15:39:45
|