
174 lines
8.4 KiB
Markdown
174 lines
8.4 KiB
Markdown
|
|
> Name
|
|
|
|
动量趋势跟踪型双指标MACD与抛物线SAR结合策略-Momentum-Trend-Following-Dual-Indicator-MACD-and-Parabolic-SAR-Combination-Strategy
|
|
|
|
> Author
|
|
|
|
ianzeng123
|
|
|
|
> Strategy Description
|
|
|
|
|
|
|
|
|
|
|
|
|
|
|
|
[trans]
|
|
#### 概述
|
|
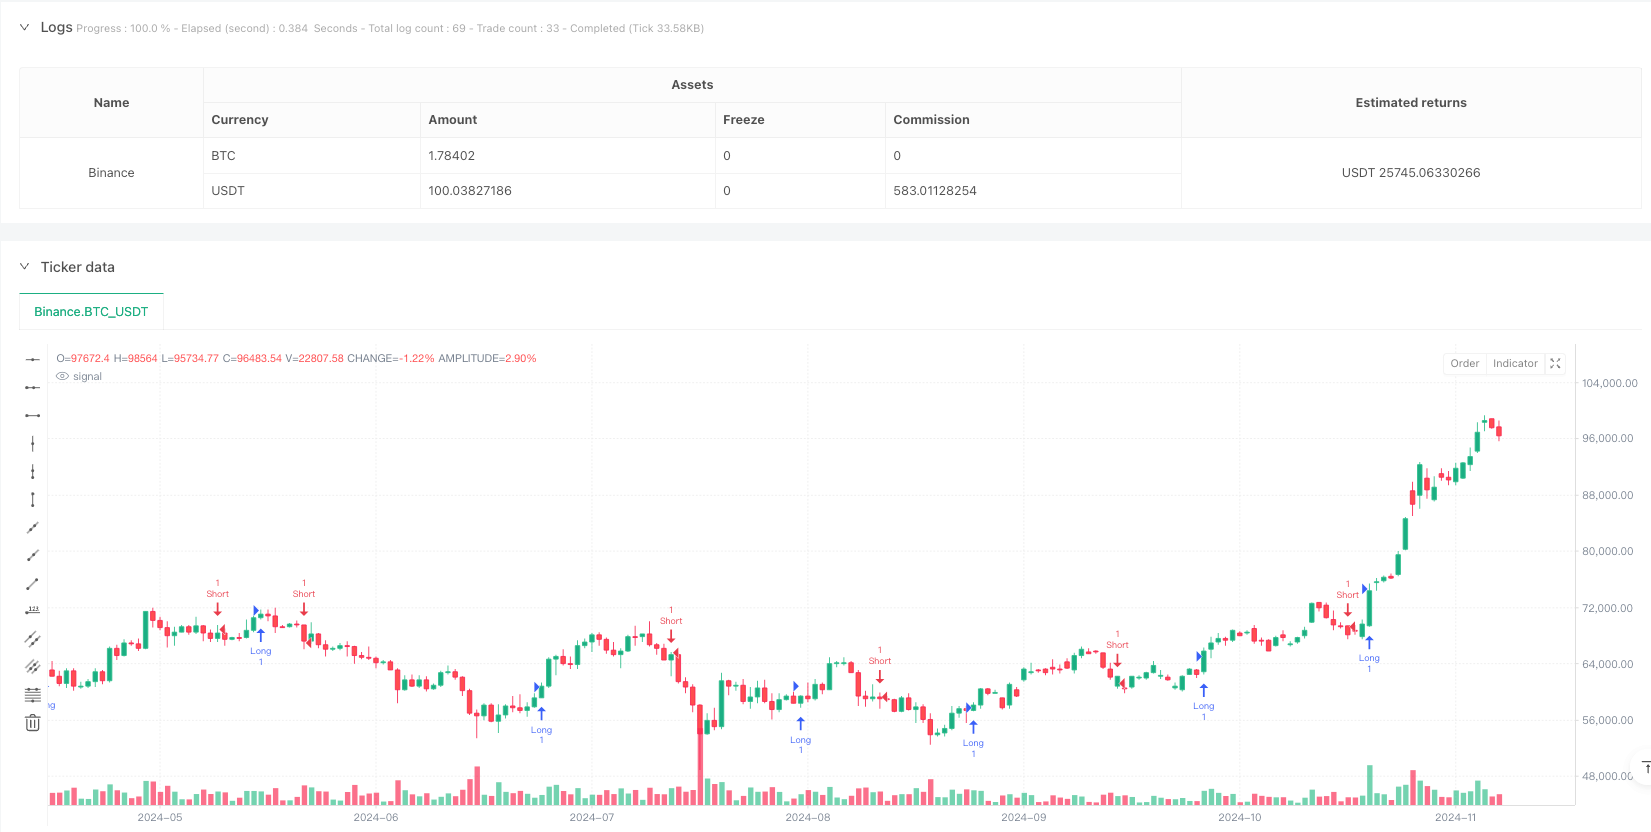
该策略是一个结合了MACD(移动平均线趋势指标)和抛物线SAR(停损反转指标)的趋势跟踪交易系统。通过动量指标与趋势指标的有机结合,在识别市场趋势方向的同时对趋势强度进行量化分析,从而捕捉更优质的交易机会。该策略采用MACD快慢线的交叉来确认趋势动量,同时使用SAR点位来确认趋势方向和设置移动止损。
|
|
|
|
#### 策略原理
|
|
策略的核心逻辑包含两个部分:
|
|
1. MACD部分:使用12周期和26周期的指数移动平均线计算MACD线,并用9周期均线作为信号线。MACD线上穿信号线视为看多信号,下穿则视为看空信号。
|
|
2. SAR部分:使用默认参数(起始值0.02,步长0.02,最大值0.2)计算SAR点位。当价格位于SAR点位之上时确认上升趋势,位于SAR点位之下时确认下降趋势。
|
|
|
|
入场规则:
|
|
- 做多条件:MACD线位于信号线上方且价格位于SAR点位上方
|
|
- 做空条件:MACD线位于信号线下方且价格位于SAR点位下方
|
|
|
|
出场规则:
|
|
- 多头仓位:当出现做空信号时平仓
|
|
- 空头仓位:当出现做多信号时平仓
|
|
|
|
#### 策略优势
|
|
1. 信号可靠性高:通过结合动量指标(MACD)和趋势指标(SAR),能有效过滤虚假信号,提高交易的准确性。
|
|
2. 风险控制完善:SAR指标能够根据市场波动自动调整止损位置,帮助实现动态风险管理。
|
|
3. 适应性强:策略参数可根据不同市场环境和交易周期进行优化调整。
|
|
4. 执行标准化:交易信号明确,便于程序化实现,减少人为判断带来的误差。
|
|
|
|
#### 策略风险
|
|
1. 震荡市不适用:在横盘震荡行情下可能产生频繁的假突破信号,导致过度交易。
|
|
2. 滞后性存在:由于使用均线系统,信号会相对滞后于价格,可能错过最佳入场点。
|
|
3. 参数敏感性:不同参数组合的效果差异较大,需要经过充分的历史数据测试。
|
|
4. 市场环境依赖:策略在趋势明显的市场表现较好,但在市场特征发生变化时需要及时调整。
|
|
|
|
#### 策略优化方向
|
|
1. 增加市场环境过滤:
|
|
可引入波动率指标(如ATR)来判断市场状态,在低波动期间降低交易频率或暂停交易。
|
|
|
|
2. 完善止损机制:
|
|
除了SAR止损外,可增加固定比例止损和移动止损的组合使用,提高风险控制的稳定性。
|
|
|
|
3. 优化参数选择:
|
|
可通过机器学习方法,针对不同市场周期自动优化MACD和SAR的参数组合。
|
|
|
|
4. 增加交易量分析:
|
|
结合成交量指标来确认趋势强度,提高信号的可靠性。
|
|
|
|
#### 总结
|
|
该策略通过MACD和抛物线SAR的结合,构建了一个较为完整的趋势跟踪交易系统。策略具有信号明确、风险可控、适应性强等优点,但也存在对趋势依赖、信号滞后等局限性。通过增加市场环境过滤、优化止损机制等方向的改进,可以进一步提升策略的稳定性和实用性。策略适合追踪中长期趋势的交易者使用,建议在实盘之前进行充分的参数优化和回测验证。||
|
|
|
|
|
|
|
|
#### Overview
|
|
This strategy is a trend-following trading system that combines MACD (Moving Average Convergence Divergence) and Parabolic SAR (Stop and Reverse) indicators. By integrating momentum and trend indicators, it quantifies trend strength while identifying market direction, thereby capturing higher quality trading opportunities. The strategy uses MACD line crossovers to confirm trend momentum while utilizing SAR points to confirm trend direction and set trailing stops.
|
|
|
|
#### Strategy Principles
|
|
The core logic consists of two components:
|
|
1. MACD Component: Calculates MACD line using 12-period and 26-period exponential moving averages, with a 9-period moving average as the signal line. MACD line crossing above the signal line indicates a bullish signal, while crossing below indicates a bearish signal.
|
|
2. SAR Component: Calculates SAR points using default parameters (start 0.02, increment 0.02, maximum 0.2). Confirms uptrend when price is above SAR points and downtrend when below.
|
|
|
|
Entry Rules:
|
|
- Long Condition: MACD line above signal line and price above SAR points
|
|
- Short Condition: MACD line below signal line and price below SAR points
|
|
|
|
Exit Rules:
|
|
- Long Positions: Exit when short signal appears
|
|
- Short Positions: Exit when long signal appears
|
|
|
|
#### Strategy Advantages
|
|
1. High Signal Reliability: Combining momentum (MACD) and trend (SAR) indicators effectively filters false signals, improving trading accuracy.
|
|
2. Robust Risk Control: SAR indicator automatically adjusts stop-loss positions based on market volatility, enabling dynamic risk management.
|
|
3. Strong Adaptability: Strategy parameters can be optimized for different market environments and trading timeframes.
|
|
4. Standardized Execution: Clear trading signals facilitate algorithmic implementation, reducing human judgment errors.
|
|
|
|
#### Strategy Risks
|
|
1. Ineffective in Ranging Markets: May generate frequent false breakout signals during sideways consolidation, leading to overtrading.
|
|
2. Inherent Lag: Due to the moving average system, signals lag behind price action, potentially missing optimal entry points.
|
|
3. Parameter Sensitivity: Different parameter combinations yield varying results, requiring extensive historical data testing.
|
|
4. Market Environment Dependency: Strategy performs well in trending markets but requires timely adjustments when market characteristics change.
|
|
|
|
#### Strategy Optimization Directions
|
|
1. Add Market Environment Filtering:
|
|
Incorporate volatility indicators (like ATR) to assess market conditions, reducing trading frequency or pausing during low volatility periods.
|
|
|
|
2. Enhance Stop-Loss Mechanism:
|
|
Implement a combination of fixed percentage and trailing stops alongside SAR stops to improve risk control stability.
|
|
|
|
3. Optimize Parameter Selection:
|
|
Utilize machine learning methods to automatically optimize MACD and SAR parameter combinations for different market cycles.
|
|
|
|
4. Incorporate Volume Analysis:
|
|
Include volume indicators to confirm trend strength and improve signal reliability.
|
|
|
|
#### Conclusion
|
|
This strategy creates a comprehensive trend-following trading system by combining MACD and Parabolic SAR. It offers clear signals, controllable risk, and strong adaptability, but also has limitations such as trend dependency and signal lag. Through improvements in market environment filtering and stop-loss optimization, the strategy's stability and practicality can be further enhanced. It is suitable for traders focusing on medium to long-term trends, with recommended thorough parameter optimization and backtesting before live implementation.
|
|
|
|
[/trans]
|
|
|
|
|
|
|
|
> Source (PineScript)
|
|
|
|
``` pinescript
|
|
/*backtest
|
|
start: 2024-02-21 00:00:00
|
|
end: 2024-11-25 00:00:00
|
|
period: 1d
|
|
basePeriod: 1d
|
|
exchanges: [{"eid":"Binance","currency":"BTC_USDT"}]
|
|
*/
|
|
|
|
//@version=5
|
|
strategy("MACD + Parabolic SAR Strategy", shorttitle="MACD+SAR", overlay=true)
|
|
|
|
//========== User Inputs ==========//
|
|
// MACD parameters
|
|
fastLength = input.int(12, "MACD Fast Length")
|
|
slowLength = input.int(26, "MACD Slow Length")
|
|
signalLength = input.int(9, "MACD Signal Length")
|
|
|
|
// SAR parameters (start, step, maximum)
|
|
afStart = input.float(0.02, "SAR Start")
|
|
afIncrement = input.float(0.02, "SAR Increment")
|
|
afMax = input.float(0.2, "SAR Max")
|
|
|
|
//========== MACD Calculation ==========//
|
|
[macdLine, signalLine, histLine] = ta.macd(close, fastLength, slowLength, signalLength)
|
|
|
|
//========== Parabolic SAR Calculation ==========//
|
|
sarValue = ta.sar(afStart, afIncrement, afMax)
|
|
|
|
//========== Entry Conditions ==========//
|
|
// Long: MACD > Signal + close > SAR
|
|
longCondition = (macdLine > signalLine) and (close > sarValue)
|
|
|
|
// Short: MACD < Signal + close < SAR
|
|
shortCondition = (macdLine < signalLine) and (close < sarValue)
|
|
|
|
//========== Enter Positions ==========//
|
|
if longCondition
|
|
strategy.entry("Long", strategy.long)
|
|
|
|
if shortCondition
|
|
strategy.entry("Short", strategy.short)
|
|
|
|
//========== Exit Positions on Opposite Signal ==========//
|
|
if strategy.position_size > 0 and shortCondition
|
|
strategy.close("Long", comment="Exit Long")
|
|
|
|
if strategy.position_size < 0 and longCondition
|
|
strategy.close("Short", comment="Exit Short")
|
|
|
|
```
|
|
|
|
> Detail
|
|
|
|
https://www.fmz.com/strategy/482806
|
|
|
|
> Last Modified
|
|
|
|
2025-02-27 17:45:03
|