
387 lines
13 KiB
Markdown
387 lines
13 KiB
Markdown
|
|
> Name
|
|
|
|
动量突破趋势追踪策略Trend-Tracking-Strategy-Based-on-Momentum-Breakout
|
|
|
|
> Author
|
|
|
|
ChaoZhang
|
|
|
|
> Strategy Description
|
|
|
|
|
|
|
|
[trans]
|
|
|
|
## 概述
|
|
|
|
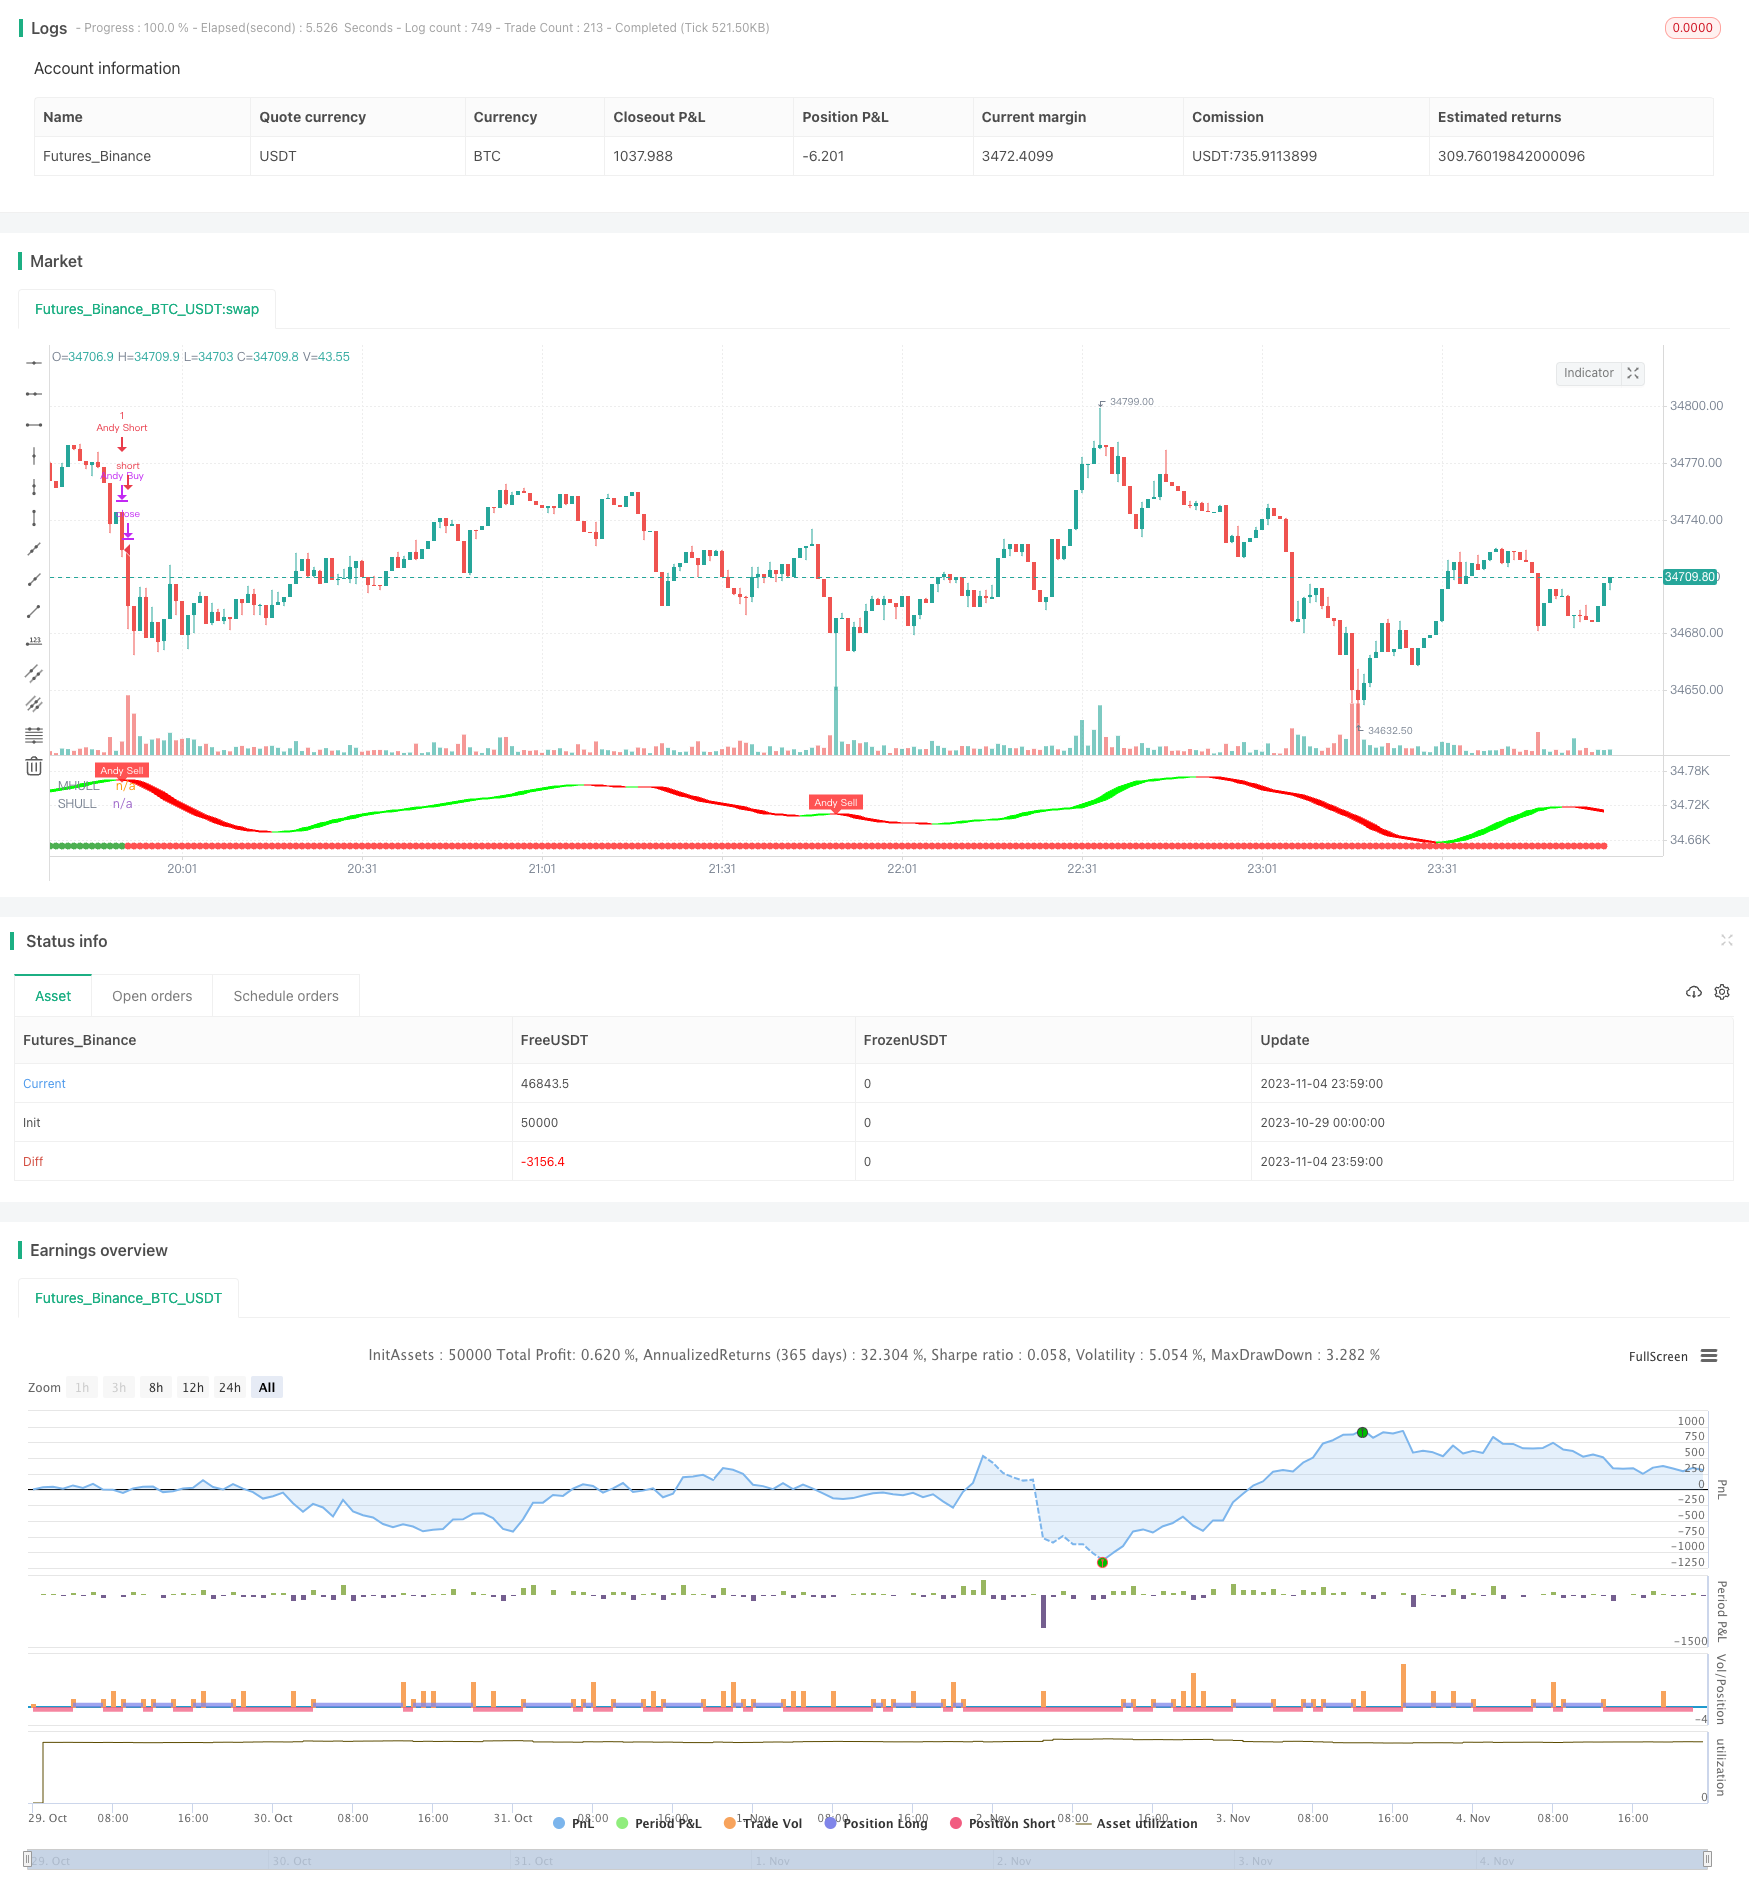
该策略综合运用多种技术指标识别趋势方向,在趋势发生动量突破时进行追踪,追求获得超额收益。
|
|
|
|
## 策略原理
|
|
|
|
1. 使用Donchian通道判断整体趋势方向。当价格突破该通道时,确认趋势发生转变。
|
|
|
|
2. Hull移动平均线辅助判断趋势方向。该指标对价格变化敏感,可提前发现趋势转折。
|
|
|
|
3. 半轨道系统发出买入和卖出信号。该系统基于价格通道和平均真实波动范围,可避免假突破。
|
|
|
|
4. 当Donchian通道、Hull指标和半轨道系统同时发出信号时,判断趋势发生有力的动量突破,此时进入场内。
|
|
|
|
5. 平仓条件:当上述指标发出反向信号时,判定趋势反转,立即止损退出。
|
|
|
|
## 优势分析
|
|
|
|
- 多指标组合,判断力更强。Donchian通道判定基本面,Hull指标和半轨道判定细节,把握趋势精确转折点。
|
|
|
|
- 动量突破参与,追求超额收益。只在趋势发生强力突破时入场,避免在震荡中被套。
|
|
|
|
- 严格止损,保障资金安全。一旦指标发出反向信号,立即止损,避免亏损扩大。
|
|
|
|
- 参数调节灵活,适应各类市场。可调整通道长度、波动区间等参数,针对不同周期进行优化。
|
|
|
|
- 易于理解和实现,新手也能掌握。指标和条件组合简单明了,容易编程实现。
|
|
|
|
## 风险分析
|
|
|
|
- 错过趋势初期机会。进入时机较晚,初期涨幅无法捕捉。
|
|
|
|
- 突破失败回调损失。入场后可能出现突破失败和反转,造成损失。
|
|
|
|
- 指标发出错误信号。由于参数设置不当,指标判断可能发生错误。
|
|
|
|
- 交易次数有限。仅在明确趋势突破时才入场,年化交易次数有限。
|
|
|
|
## 优化方向
|
|
|
|
- 优化参数组合。testing不同参数找出最佳组合。
|
|
|
|
- 增加止损线性回撤条件。避免止损过早,错过趋势机会。
|
|
|
|
- 增加其它指标过滤。如MACD,KDJ等辅助判断,减少错误信号。
|
|
|
|
- 优化交易时间段。不同时间段参数可进行优化。
|
|
|
|
- 扩大资金利用效率。通过杠杆、定投等方式提升资金使用效率。
|
|
|
|
## 总结
|
|
|
|
本策略综合多种指标判断趋势发生动量突破的时机,通过追踪已形成的趋势实现超额收益。严格的止损机制控制风险,灵活的参数调节适应不同市场环境。虽然交易频率较低,但每个交易都力求获得高回报。通过参数优化、辅助指标引入等方式,本策略可获得持续改进。
|
|
|
|
||
|
|
|
|
# Overview
|
|
|
|
This strategy combines multiple technical indicators to identify trend direction and track the momentum when breakout happens, aiming for excess return.
|
|
|
|
# Strategy Logic
|
|
|
|
1. Use Donchian Channel to determine the overall trend. A breakout of the channel confirms trend reversal.
|
|
|
|
2. Hull Moving Average assists in judging trend direction. It is sensitive to price change and can early detect trend reversal.
|
|
|
|
3. Halftrend system generates buy and sell signals based on price channel and ATR range. It avoids false breakout.
|
|
|
|
4. When Donchian, Hull and Halftrend signals align, a strong momentum breakout is confirmed and strategy enters.
|
|
|
|
5. Exit when above indicators give reverse signal, indicating trend reversal.
|
|
|
|
# Advantage Analysis
|
|
|
|
- More robust signal with multiple indicators. Donchian for fundamentals, Hull and Halftrend for details. Catch trend turning points accurately.
|
|
|
|
- Pursuit of excess return by momentum breakout. Only enter on strong breakout, avoiding whipsaw in consolidation.
|
|
|
|
- Strict stop loss to ensure capital safety. Loss is capped once reverse signal shows.
|
|
|
|
- Flexible parameter tuning for different markets. Channel length, ATR range etc can be adjusted and optimized.
|
|
|
|
- Easy to understand and implement. Indicator combo is simple and clear, easy to code.
|
|
|
|
# Risk Analysis
|
|
|
|
- Miss early trend opportunity. Entry is relatively late, early rally is not captured.
|
|
|
|
- Loss from failed breakout and reversal. Drawdown may occur after entry.
|
|
|
|
- False signal from bad parameter. Indicators may fail due to bad tuning.
|
|
|
|
- Limited trade frequency. Only clear breakouts are traded, resulting in low annual trade numbers.
|
|
|
|
# Optimization Directions
|
|
|
|
- Optimize parameter combinations by testing. Find best parameters.
|
|
|
|
- Add trailing stop loss condition. Avoid premature stop loss.
|
|
|
|
- Introduce more filters like MACD, KDJ. To filter bad signals.
|
|
|
|
- Optimize parameters for different sessions. Different sessions can be tuned separately.
|
|
|
|
- Improve capital efficiency via leverage, DCA etc. Better capital utilization.
|
|
|
|
# Summary
|
|
|
|
This strategy combines multiple indicators to identify momentum breakout of established trend, and profit from trend tracking. Strict stop loss manages risk. Flexible parameters adapt to different market environments. Although trade frequency is low, each trade targets high profitability. The strategy can be improved continuously through parameter tuning, additional filters etc.
|
|
|
|
[/trans]
|
|
|
|
> Strategy Arguments
|
|
|
|
|
|
|
|
|Argument|Default|Description|
|
|
|----|----|----|
|
|
|v_input_int_1|30|dlen|
|
|
|v_input_1_hlc3|0|Source: hlc3|high|low|open|hl2|close|hlcc4|ohlc4|
|
|
|v_input_string_1|0|Hull Variation: Hma|Thma|Ehma|
|
|
|v_input_2|55|Length|
|
|
|v_input_3|true|Length multiplier |
|
|
|v_input_4|2|Amplitude|
|
|
|v_input_5|2|Channel Deviation|
|
|
|v_input_int_2|7|atr_length|
|
|
|v_input_int_3|50|atr_rsi_length|
|
|
|
|
|
|
> Source (PineScript)
|
|
|
|
``` pinescript
|
|
/*backtest
|
|
start: 2023-10-29 00:00:00
|
|
end: 2023-11-05 00:00:00
|
|
period: 1m
|
|
basePeriod: 1m
|
|
exchanges: [{"eid":"Futures_Binance","currency":"BTC_USDT"}]
|
|
*/
|
|
|
|
// This source code is subject to the terms of the Mozilla Public License 2.0 at https://mozilla.org/MPL/2.0/
|
|
// © kgynofomo
|
|
|
|
// @version=5
|
|
strategy(title="[Salavi] | Andy Super Pro Strategy",overlay = true)
|
|
|
|
//Doinchian Trend Ribbon
|
|
dlen = input.int(defval=30, minval=10)
|
|
|
|
dchannel(len) =>
|
|
float hh = ta.highest(len)
|
|
float ll = ta.lowest(len)
|
|
|
|
int trend = 0
|
|
trend := close > hh[1] ? 1 : close < ll[1] ? -1 : nz(trend[1])
|
|
trend
|
|
|
|
dchannelalt(len, maintrend) =>
|
|
float hh = ta.highest(len)
|
|
float ll = ta.lowest(len)
|
|
|
|
int trend = 0
|
|
trend := close > hh[1] ? 1 : close < ll[1] ? -1 : nz(trend[1])
|
|
maintrend == 1 ? trend == 1 ? #00FF00ff : #00FF009f : maintrend == -1 ? trend == -1 ? #FF0000ff : #FF00009f : na
|
|
|
|
maintrend = dchannel(dlen)
|
|
donchian_bull = maintrend==1
|
|
donchian_bear = maintrend==-1
|
|
|
|
|
|
//Hulls
|
|
src = input(hlc3, title='Source')
|
|
modeSwitch = input.string('Hma', title='Hull Variation', options=['Hma', 'Thma', 'Ehma'])
|
|
length = input(55, title='Length')
|
|
lengthMult = input(1.0, title='Length multiplier ')
|
|
|
|
useHtf = false
|
|
htf = '240'
|
|
|
|
switchColor = true
|
|
candleCol = false
|
|
visualSwitch = true
|
|
thicknesSwitch = 1
|
|
transpSwitch = 40
|
|
|
|
//FUNCTIONS
|
|
//HMA
|
|
HMA(_src, _length) =>
|
|
ta.wma(2 * ta.wma(_src, _length / 2) - ta.wma(_src, _length), math.round(math.sqrt(_length)))
|
|
//EHMA
|
|
EHMA(_src, _length) =>
|
|
ta.ema(2 * ta.ema(_src, _length / 2) - ta.ema(_src, _length), math.round(math.sqrt(_length)))
|
|
//THMA
|
|
THMA(_src, _length) =>
|
|
ta.wma(ta.wma(_src, _length / 3) * 3 - ta.wma(_src, _length / 2) - ta.wma(_src, _length), _length)
|
|
|
|
//SWITCH
|
|
Mode(modeSwitch, src, len) =>
|
|
modeSwitch == 'Hma' ? HMA(src, len) : modeSwitch == 'Ehma' ? EHMA(src, len) : modeSwitch == 'Thma' ? THMA(src, len / 2) : na
|
|
|
|
//OUT
|
|
_hull = Mode(modeSwitch, src, int(length * lengthMult))
|
|
HULL = useHtf ? request.security(syminfo.ticker, htf, _hull) : _hull
|
|
MHULL = HULL[0]
|
|
SHULL = HULL[2]
|
|
|
|
//COLOR
|
|
hullColor = switchColor ? HULL > HULL[2] ? #00ff00 : #ff0000 : #ff9800
|
|
hull_bull = HULL > HULL[2]
|
|
bull_start = hull_bull and hull_bull[1]==false
|
|
hull_bear = HULL < HULL[2]
|
|
bear_start = hull_bear and hull_bear[1]==false
|
|
|
|
barcolor(color=candleCol ? switchColor ? hullColor : na : na)
|
|
|
|
//halftrend
|
|
amplitude = input(title='Amplitude', defval=2)
|
|
channelDeviation = input(title='Channel Deviation', defval=2)
|
|
// showArrows = input(title='Show Arrows', defval=true)
|
|
// showChannels = input(title='Show Channels', defval=true)
|
|
|
|
var int trend = 0
|
|
var int nextTrend = 0
|
|
var float maxLowPrice = nz(low[1], low)
|
|
var float minHighPrice = nz(high[1], high)
|
|
|
|
var float up = 0.0
|
|
var float down = 0.0
|
|
float atrHigh = 0.0
|
|
float atrLow = 0.0
|
|
float arrowUp = na
|
|
float arrowDown = na
|
|
|
|
atr2 = ta.atr(100) / 2
|
|
dev = channelDeviation * atr2
|
|
|
|
highPrice = high[math.abs(ta.highestbars(amplitude))]
|
|
lowPrice = low[math.abs(ta.lowestbars(amplitude))]
|
|
highma = ta.sma(high, amplitude)
|
|
lowma = ta.sma(low, amplitude)
|
|
|
|
if nextTrend == 1
|
|
maxLowPrice := math.max(lowPrice, maxLowPrice)
|
|
|
|
if highma < maxLowPrice and close < nz(low[1], low)
|
|
trend := 1
|
|
nextTrend := 0
|
|
minHighPrice := highPrice
|
|
minHighPrice
|
|
else
|
|
minHighPrice := math.min(highPrice, minHighPrice)
|
|
|
|
if lowma > minHighPrice and close > nz(high[1], high)
|
|
trend := 0
|
|
nextTrend := 1
|
|
maxLowPrice := lowPrice
|
|
maxLowPrice
|
|
|
|
if trend == 0
|
|
if not na(trend[1]) and trend[1] != 0
|
|
up := na(down[1]) ? down : down[1]
|
|
arrowUp := up - atr2
|
|
arrowUp
|
|
else
|
|
up := na(up[1]) ? maxLowPrice : math.max(maxLowPrice, up[1])
|
|
up
|
|
atrHigh := up + dev
|
|
atrLow := up - dev
|
|
atrLow
|
|
else
|
|
if not na(trend[1]) and trend[1] != 1
|
|
down := na(up[1]) ? up : up[1]
|
|
arrowDown := down + atr2
|
|
arrowDown
|
|
else
|
|
down := na(down[1]) ? minHighPrice : math.min(minHighPrice, down[1])
|
|
down
|
|
atrHigh := down + dev
|
|
atrLow := down - dev
|
|
atrLow
|
|
|
|
ht = trend == 0 ? up : down
|
|
|
|
var color buyColor = color.blue
|
|
var color sellColor = color.red
|
|
|
|
htColor = trend == 0 ? buyColor : sellColor
|
|
// htPlot = plot(ht, title='HalfTrend', linewidth=2, color=htColor)
|
|
|
|
// atrHighPlot = plot(showChannels ? atrHigh : na, title='ATR High', style=plot.style_circles, color=color.new(sellColor, 0))
|
|
// atrLowPlot = plot(showChannels ? atrLow : na, title='ATR Low', style=plot.style_circles, color=color.new(buyColor, 0))
|
|
|
|
// fill(htPlot, atrHighPlot, title='ATR High Ribbon', color=color.new(sellColor, 90))
|
|
// fill(htPlot, atrLowPlot, title='ATR Low Ribbon', color=color.new(buyColor, 90))
|
|
|
|
HalfTrend_buySignal = not na(arrowUp) and trend == 0 and trend[1] == 1
|
|
HalfTrend_sellSignal = not na(arrowDown) and trend == 1 and trend[1] == 0
|
|
|
|
// plotshape(showArrows and buySignal ? atrLow : na, title='Arrow Up', style=shape.triangleup, location=location.absolute, size=size.tiny, color=color.new(buyColor, 0))
|
|
// plotshape(showArrows and sellSignal ? atrHigh : na, title='Arrow Down', style=shape.triangledown, location=location.absolute, size=size.tiny, color=color.new(sellColor, 0))
|
|
|
|
|
|
|
|
|
|
//ema
|
|
filter_ema = ta.ema(close,200)
|
|
ema_bull = close>filter_ema
|
|
ema_bear = close<filter_ema
|
|
|
|
atr_length = input.int(7)
|
|
atr = ta.atr(atr_length)
|
|
atr_rsi_length = input.int(50)
|
|
atr_rsi = ta.rsi(atr,atr_rsi_length)
|
|
atr_valid = atr_rsi>50
|
|
|
|
longCondition = bull_start and atr_valid
|
|
shortCondition = bear_start and atr_valid
|
|
|
|
Exit_long_condition = shortCondition
|
|
Exit_short_condition = longCondition
|
|
|
|
if longCondition
|
|
strategy.entry("Andy Buy",strategy.long, limit=close,comment="Andy Buy Here")
|
|
|
|
if Exit_long_condition
|
|
strategy.close("Andy Buy",comment="Andy Buy Out")
|
|
// strategy.entry("Andy fandan Short",strategy.short, limit=close,comment="Andy 翻單 short Here")
|
|
// strategy.close("Andy fandan Buy",comment="Andy short Out")
|
|
|
|
|
|
if shortCondition
|
|
strategy.entry("Andy Short",strategy.short, limit=close,comment="Andy short Here")
|
|
|
|
|
|
// strategy.exit("STR","Long",stop=longstoploss)
|
|
if Exit_short_condition
|
|
strategy.close("Andy Short",comment="Andy short Out")
|
|
// strategy.entry("Andy fandan Buy",strategy.long, limit=close,comment="Andy 翻單 Buy Here")
|
|
// strategy.close("Andy fandan Short",comment="Andy Buy Out")
|
|
|
|
|
|
|
|
|
|
inLongTrade = strategy.position_size > 0
|
|
inLongTradecolor = #58D68D
|
|
notInTrade = strategy.position_size == 0
|
|
inShortTrade = strategy.position_size < 0
|
|
|
|
// bgcolor(color = inLongTrade?color.rgb(76, 175, 79, 70):inShortTrade?color.rgb(255, 82, 82, 70):na)
|
|
plotshape(close!=0,location = location.bottom,color = inLongTrade?color.green:inShortTrade?color.red:na)
|
|
|
|
|
|
plotshape(longCondition, title='Buy', text='Andy Buy', style=shape.labelup, location=location.belowbar, color=color.new(color.green, 0), textcolor=color.new(color.white, 0), size=size.tiny)
|
|
plotshape(shortCondition, title='Sell', text='Andy Sell', style=shape.labeldown, location=location.abovebar, color=color.new(color.red, 0), textcolor=color.new(color.white, 0), size=size.tiny)
|
|
|
|
Fi1 = plot(MHULL, title='MHULL', color=hullColor, linewidth=thicknesSwitch, transp=50)
|
|
Fi2 = plot(SHULL, title='SHULL', color=hullColor, linewidth=thicknesSwitch, transp=50)
|
|
|
|
fill(Fi1, Fi2, title='Band Filler', color=hullColor, transp=transpSwitch)
|
|
|
|
|
|
|
|
```
|
|
|
|
> Detail
|
|
|
|
https://www.fmz.com/strategy/431212
|
|
|
|
> Last Modified
|
|
|
|
2023-11-06 09:56:20
|