
250 lines
10 KiB
Markdown
250 lines
10 KiB
Markdown
|
|
> Name
|
|
|
|
动量突破均线交易策略Momentum-Breakthrough-Moving-Average-Trading-Strategy
|
|
|
|
> Author
|
|
|
|
ChaoZhang
|
|
|
|
> Strategy Description
|
|
|
|
|
|
[trans]
|
|
|
|
### 概述
|
|
|
|
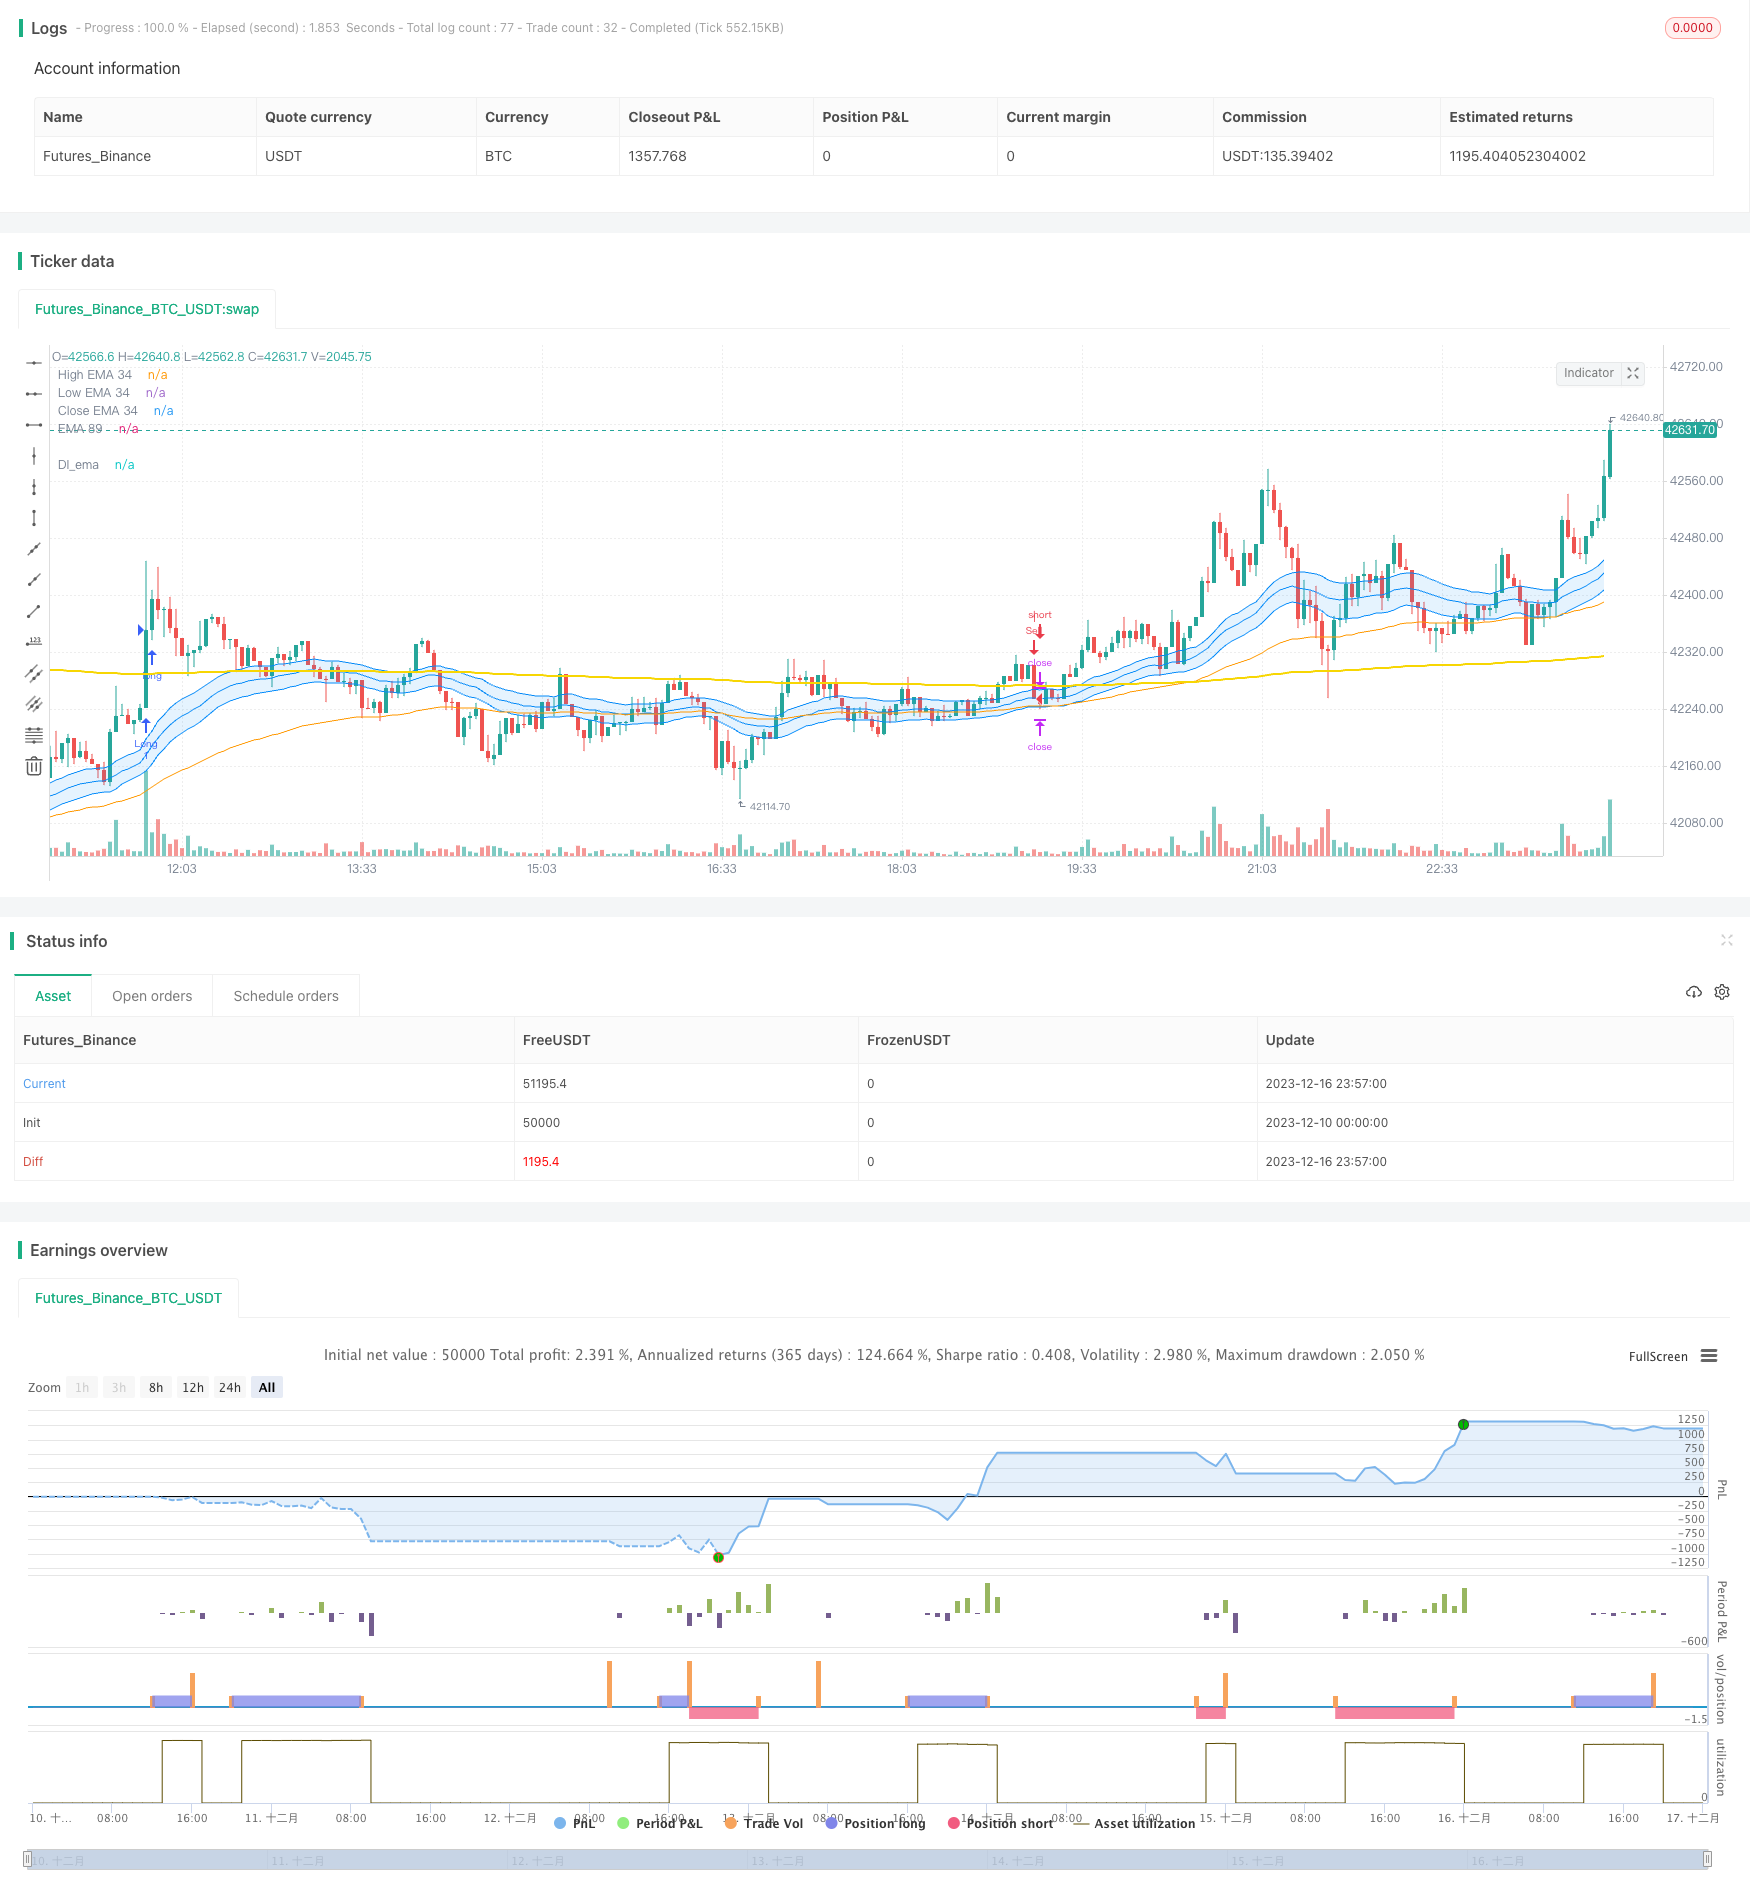
本策略是一个结合动量指标和均线指标的趋势追踪策略。它使用指数移动平均线作为主要的趋势判断工具,并结合高额成交量来发出买入和卖出信号。该策略适用于中长线持仓,追踪市场主要趋势。
|
|
|
|
### 策略原理
|
|
|
|
1. 使用34周期的EMA作为主要的趋势判断工具。当价格上穿EMA时为看涨信号,下穿EMA时为看跌信号。
|
|
|
|
2. 将成交量的21日移动平均线与最近1.5倍的平均量比较。如果当前成交量大于1.5倍平均量,则认为是高量。
|
|
|
|
3.只有在价格与EMA形成金叉且为高量时,才发出买入信号;只有在价格与EMA形成死叉且为高量时,才发出卖出信号。
|
|
|
|
4.开仓后设置止损和止盈比例,可自定义设置。
|
|
|
|
这样综合考虑了趋势、动量和风险控制等多种因素,比较全面和稳定。
|
|
|
|
### 优势分析
|
|
|
|
1. 使用EMA判断市场主要趋势方向,可以有效跟踪中长线趋势。
|
|
|
|
2. 结合高额成交量进行FILTER,可以避免被假突破误导。
|
|
|
|
3. 设置止损止盈比例,可以有效控制单笔交易的风险。
|
|
|
|
4. 采用中长线持仓策略,不受高频市场噪音的影响,稳定持盈。
|
|
|
|
|
|
### 风险与解决方案
|
|
|
|
1. 被高频假突破误导的概率较大。解决方法是加入交易量验证。
|
|
|
|
2. 中长线持仓增加资金占用。解决方法是适当控制仓位规模。
|
|
|
|
3. 均线交易策略可能滞后,无法抓住短线机会。解决方法是结合其他短线信号。
|
|
|
|
4. 大幅震荡行情中可能出现较大亏损。解决方法是设定合适的止损位置。
|
|
|
|
### 优化方向
|
|
|
|
1. 测试不同EMA周期参数的优劣,找到最优参数。
|
|
|
|
2. 测试不同止损止盈比例的参数对策略收益率和抗风险能力的影响。
|
|
|
|
3. 尝试结合其他指标如MACD、KDJ等判断短线机会。
|
|
|
|
4. 优化资金管理策略,如仓位控制、动态止损等方法。
|
|
|
|
|
|
### 总结
|
|
|
|
本策略总体来说是一个价值稳定的中长线持仓策略。它能有效跟踪市场主要趋势,并利用量能指标来过滤误导信号。同时,采取适当的止损和止盈手段控制单笔交易的风险。可谓是趋势交易的“定盘清淡”之作。如果进行适当优化,相信可以获得更加理想的策略收益率。
|
|
|
|
||
|
|
|
|
### Overview
|
|
|
|
This strategy is a trend tracking strategy that combines momentum indicators and moving averages. It uses exponential moving averages as the main trend judgment tool and issues buy and sell signals in combination with high trading volume. The strategy is suitable for medium and long term holdings to track major market trends.
|
|
|
|
### Strategy Principles
|
|
|
|
1. Use 34-period EMA as the main tool for trend judgment. When the price crosses above the EMA, it is a bullish signal, and when it crosses below, it is a bearish signal.
|
|
|
|
2. Compare the 21-day moving average of volume with 1.5 times the recent average. If the current volume is greater than 1.5 times the average, it is considered high volume.
|
|
|
|
3. Buy signals are only issued when the price crosses the EMA upward and the volume is high. Sell signals are only issued when the price crosses the EMA downward and the volume is high.
|
|
|
|
4. After opening a position, set stop loss and take profit ratios, which can be customized.
|
|
|
|
By comprehensively considering factors such as trends, momentum and risk control, it is relatively comprehensive and stable.
|
|
|
|
### Advantage Analysis
|
|
|
|
1. Using EMA to determine the main trend direction of the market can effectively track medium and long term trends.
|
|
|
|
2. Combining with high trading volume FILTER can avoid being misled by false breakouts.
|
|
|
|
3. Setting stop loss and take profit ratios can effectively control the risk of single trades.
|
|
|
|
4. Adopting medium and long term holding strategies is not affected by high frequency market noise and steadily profitable.
|
|
|
|
### Risks and Solutions
|
|
|
|
1. High probability of being misled by high frequency false breakouts. The solution is to add transaction volume verification.
|
|
|
|
2. Medium and long term holdings increase capital occupancy. The solution is to appropriately control the position size.
|
|
|
|
3. Moving average trading strategies may lag and miss short-term opportunities. The solution is to combine other short-term signals.
|
|
|
|
4. Significant fluctuations in volatile markets can lead to large losses. The solution is to set the appropriate stop loss position.
|
|
|
|
### Optimization Directions
|
|
|
|
1. Test the strengths and weaknesses of different EMA cycle parameters to find the optimal parameters.
|
|
|
|
2. Test the impact of different stop loss and take profit ratio parameters on strategy return and risk resistance.
|
|
|
|
3. Try combining other indicators such as MACD and KDJ to determine short-term opportunities.
|
|
|
|
4. Optimize capital management strategies such as position control and dynamic stop loss methods.
|
|
|
|
### Summary
|
|
|
|
Overall, this strategy is a stable medium-long term holding strategy. It can effectively track major market trends and use volume indicators to filter misleading signals. At the same time, appropriate stop loss and take profit means are adopted to control the risk of single trades. It can be described as a "steady and light" trend trading work. With proper optimization, I believe it can achieve a more ideal strategy rate of return.
|
|
|
|
[/trans]
|
|
|
|
> Strategy Arguments
|
|
|
|
|
|
|
|
|Argument|Default|Description|
|
|
|----|----|----|
|
|
|v_input_1|true|(?Cài đặt thời gian)Ngày bắt đầu|
|
|
|v_input_2|true|Tháng bắt đầu|
|
|
|v_input_3|2023|Năm bắt đầu|
|
|
|v_input_4|31|Đến ngày|
|
|
|v_input_5|12|Đến tháng|
|
|
|v_input_6|2033|Đến năm|
|
|
|v_input_int_1|34|(?Cài đặt EMA)EMA 34|
|
|
|v_input_7|21|(?Cài đặt Volume)Đường Trung Bình Vol|
|
|
|v_input_8|1.5|Mức trung bình|
|
|
|v_input_float_1|true|(?Cài đặt TP & SL %)Stop Loss %|
|
|
|v_input_float_2|2|Take Profit %|
|
|
|
|
|
|
> Source (PineScript)
|
|
|
|
``` pinescript
|
|
/*backtest
|
|
start: 2023-12-10 00:00:00
|
|
end: 2023-12-17 00:00:00
|
|
period: 3m
|
|
basePeriod: 1m
|
|
exchanges: [{"eid":"Futures_Binance","currency":"BTC_USDT"}]
|
|
*/
|
|
|
|
// This source code is subject to the terms of the Mozilla Public License 2.0 at https://mozilla.org/MPL/2.0/
|
|
// © TradingSignalHub
|
|
|
|
//@version=5
|
|
strategy("Di strategy ", overlay=true)
|
|
|
|
//date setting
|
|
fromDay = input(defval = 1, title = "Ngày bắt đầu", group = "Cài đặt thời gian")
|
|
fromMonth = input(defval = 1, title = "Tháng bắt đầu", group = "Cài đặt thời gian")
|
|
fromYear = input(defval = 2023, title = "Năm bắt đầu", group = "Cài đặt thời gian")
|
|
|
|
toDay = input(defval = 31, title = "Đến ngày", group = "Cài đặt thời gian")
|
|
toMonth = input(defval = 12, title = "Đến tháng", group = "Cài đặt thời gian")
|
|
toYear = input(defval = 2033, title = "Đến năm", group = "Cài đặt thời gian")
|
|
|
|
startDate = timestamp(fromYear, fromMonth, fromDay, 00, 00)
|
|
finishDate = timestamp(toYear, toMonth, toDay, 00, 00)
|
|
time_cond() =>
|
|
time >= startDate and time <= finishDate ? true : false
|
|
|
|
//snr setting
|
|
price = close
|
|
ema34 = input.int(34, minval=2, title="EMA 34", group = "Cài đặt EMA")
|
|
pacC = ta.ema(close,ema34)
|
|
pacL = ta.ema(low,ema34)
|
|
pacH = ta.ema(high,ema34)
|
|
L =plot(pacL, color=color.rgb(3, 139, 251), linewidth=1, title="High EMA 34")
|
|
H =plot(pacH, color=color.rgb(3, 137, 247), linewidth=1, title="Low EMA 34")
|
|
C =plot(pacC, color=color.rgb(4, 138, 248), linewidth=1, title="Close EMA 34")
|
|
fill(L,H, color=color.rgb(33, 149, 243, 85),title="Fill dãi EMA 34")
|
|
|
|
//EMA full setting
|
|
ema89 =ta.ema(close,89)
|
|
DIema= ta.ema(close,458)
|
|
plot(DIema,title="DI_ema",color=color.rgb(247, 214, 3),linewidth=2)
|
|
plot(ema89,title="EMA 89",color=color.orange,linewidth=1)
|
|
//ema200= ta.ema(close,200)
|
|
//ema610= ta.ema(close,610)
|
|
//ema144= ta.ema(close,144)
|
|
//ema258= ta.ema(close,258)
|
|
//plot(ema200,title="EMA 200",color=color.purple,linewidth=2)
|
|
//plot(ema610,title="EMA 610",color=color.white,linewidth=2)
|
|
//plot(ema144,title="144Banker",color=color.green,linewidth=1)
|
|
//plot(ema258,title="258Banker",color=color.yellow,linewidth=1)
|
|
|
|
EMAbuy = ta.crossover(price, DIema)
|
|
EMAsell = ta.crossunder(price, DIema)
|
|
|
|
//volume setting
|
|
vol = (volume)
|
|
length = input(21, "Đường Trung Bình Vol", group = "Cài đặt Volume" )
|
|
div = input(1.5, "Mức trung bình", group = "Cài đặt Volume" )
|
|
up = close > open
|
|
down = open>close
|
|
Volhigh = volume> (ta.ema(volume, length)*div)
|
|
|
|
//Cài đặt lệnh
|
|
longCondition = EMAbuy and Volhigh
|
|
if time_cond()
|
|
if (longCondition)
|
|
strategy.entry("Long", strategy.long)
|
|
|
|
shortCondition = EMAsell and Volhigh
|
|
if time_cond()
|
|
if (shortCondition)
|
|
strategy.entry("Sell", strategy.short)
|
|
|
|
|
|
stopPer = input.float(1.0, title="Stop Loss %", group = "Cài đặt TP & SL %" ) / 100
|
|
takePer = input.float(2.0, title="Take Profit %", group = "Cài đặt TP & SL %" ) / 100
|
|
|
|
// Determine where you've entered and in what direction
|
|
longStop = strategy.position_avg_price * (1 - stopPer)
|
|
shortStop = strategy.position_avg_price * (1 + stopPer)
|
|
shortTake = strategy.position_avg_price * (1 - takePer)
|
|
longTake = strategy.position_avg_price * (1 + takePer)
|
|
|
|
if strategy.position_size > 0
|
|
strategy.exit(id="Đóng Long", stop=longStop, limit=longTake)
|
|
if strategy.position_size < 0
|
|
strategy.exit(id="Đóng Sell", stop=shortStop, limit=shortTake)
|
|
|
|
alertcondition(longCondition, title = "Tín hiệu BUY", message = "Tín hiệu BUY")
|
|
alertcondition(shortCondition, title = "Tín hiệu SELL", message = "Tín hiệu SELL")
|
|
//PLOT FIXED SLTP LINE
|
|
//plotshape(strategy.position_size > 0 ? longStop : na, shape.labelup, color=color.rgb(34, 249, 6, 50), linewidth=1, title="Long SL")
|
|
//plot(strategy.position_size < 0 ? shortStop : na, style=plot.style_circles, color=color.rgb(250, 8, 8, 50), linewidth=1, title="Short SL")
|
|
//plot(strategy.position_size > 0 ? longTake : na, style=plot.style_linebr, color=color.rgb(59, 248, 7), linewidth=1, title="Long TP")
|
|
//plot(strategy.position_size < 0 ? shortTake : na, style=plot.style_linebr, color=color.rgb(247, 7, 7), linewidth=1, title="Short TP")
|
|
|
|
```
|
|
|
|
> Detail
|
|
|
|
https://www.fmz.com/strategy/435776
|
|
|
|
> Last Modified
|
|
|
|
2023-12-18 18:01:59
|