
10 KiB
Name
动量突破双向交易策略Momentum-Breakout-Reversal-Trading-Strategy
Author
ChaoZhang
Strategy Description
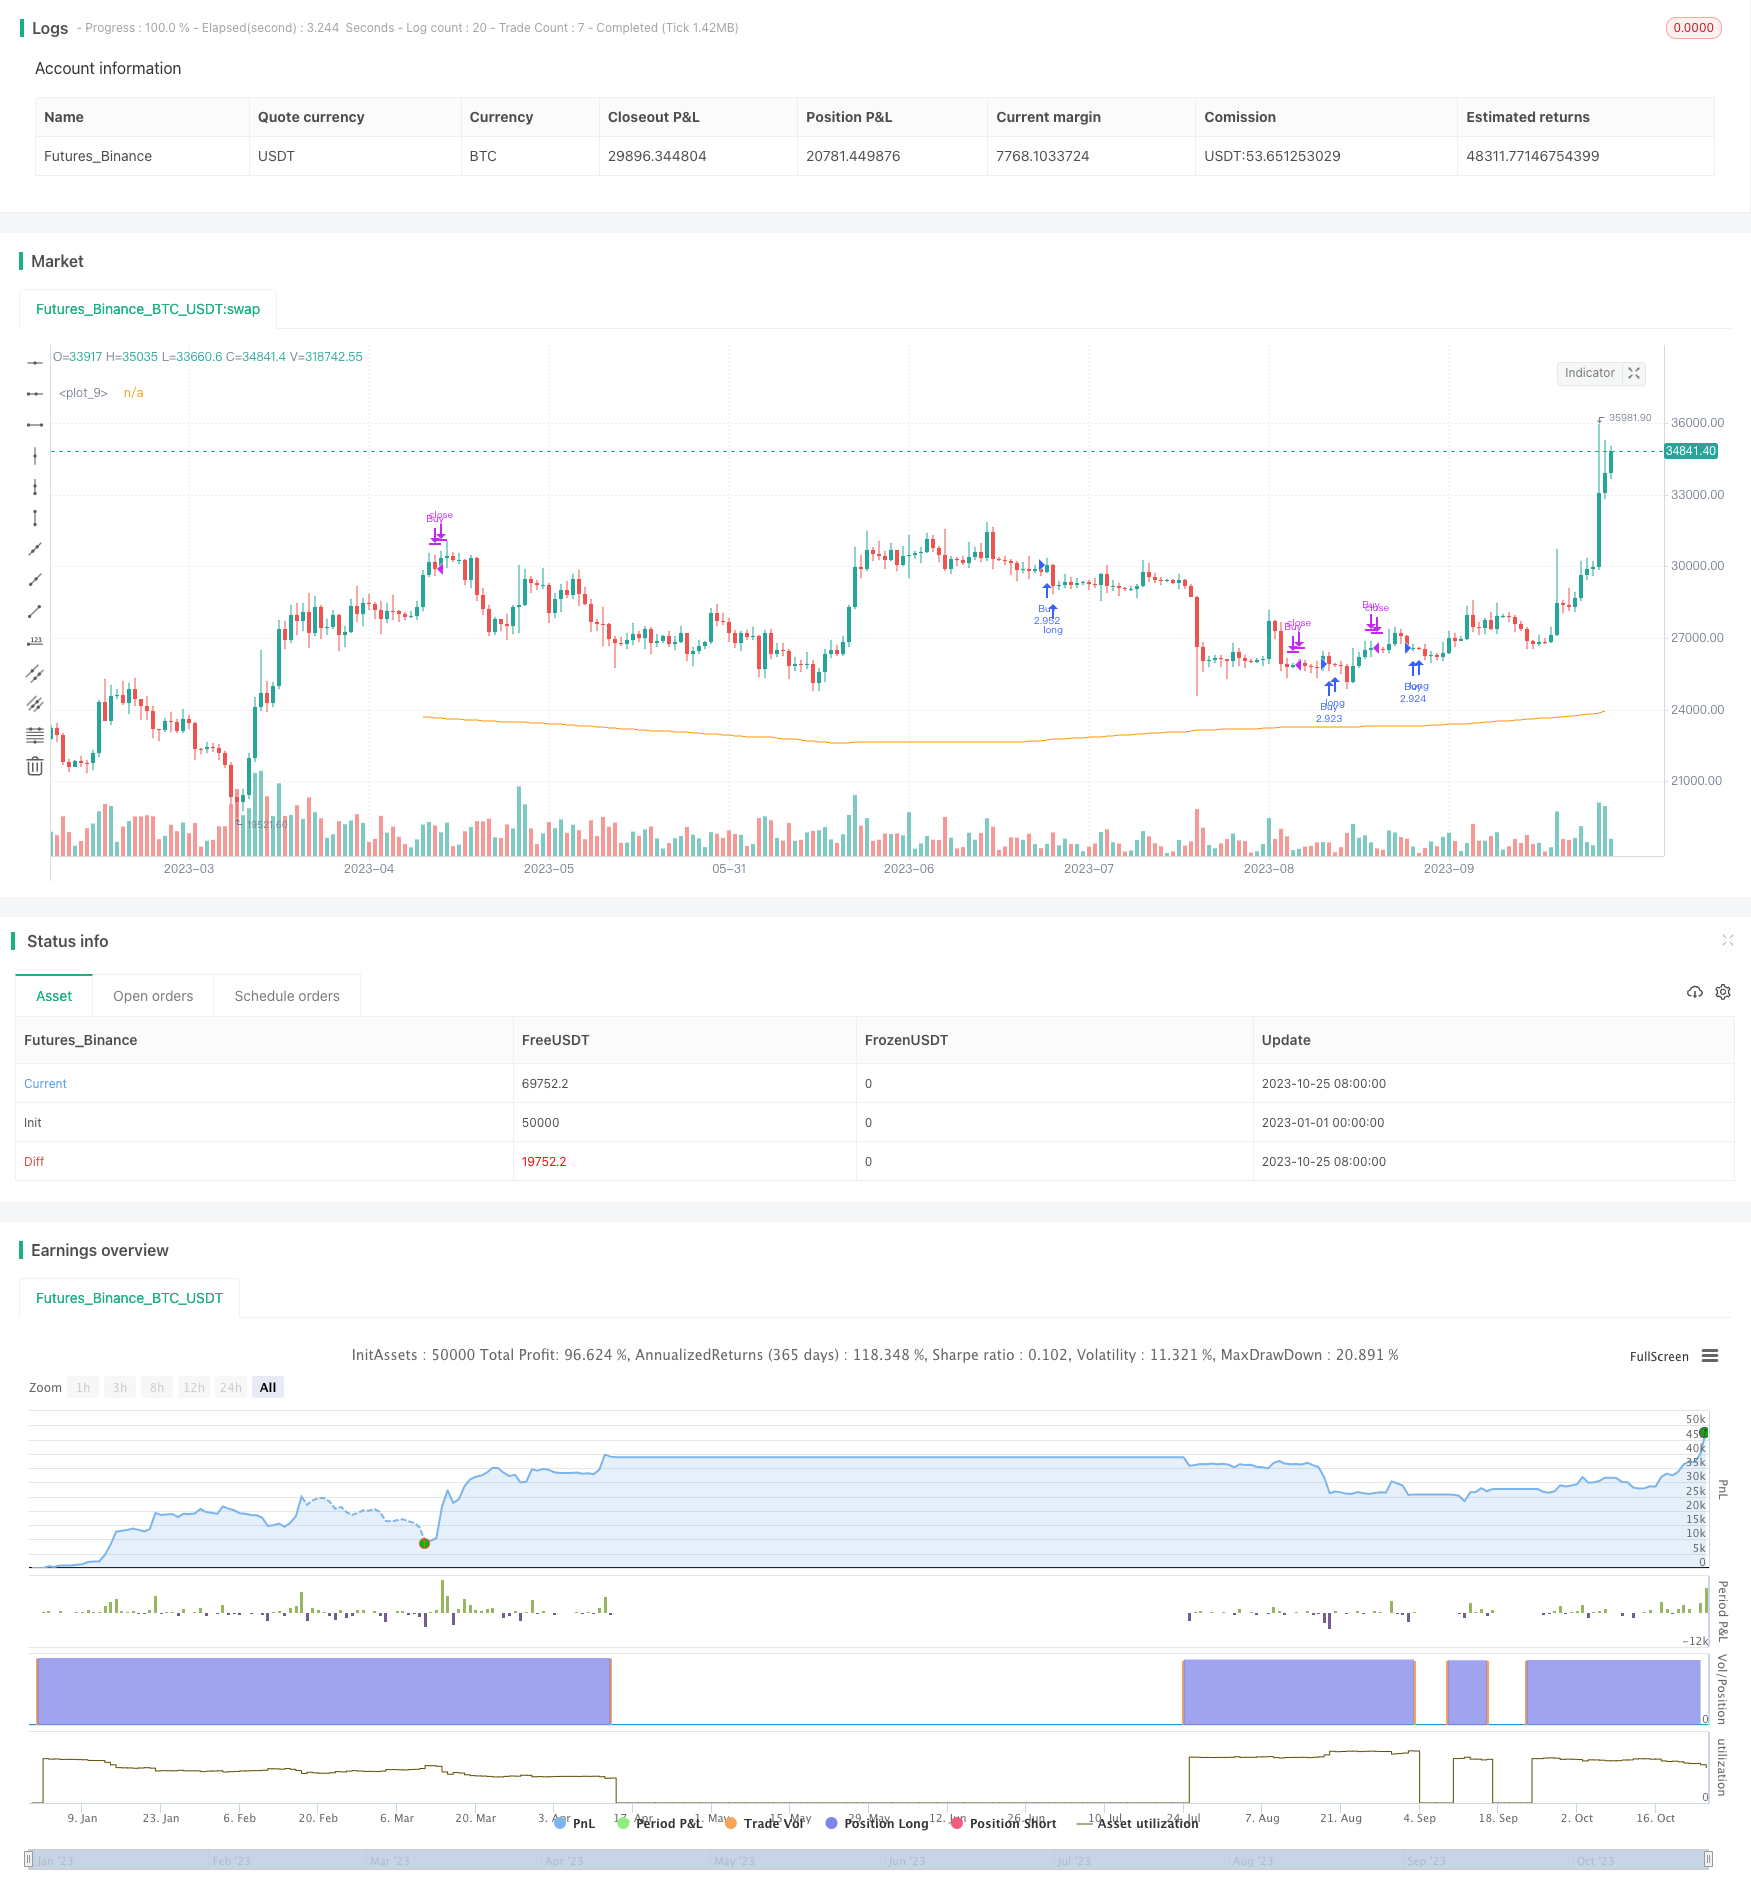 [trans]
概述
本策略运用简单移动平均线判断趋势方向,在持续上涨行情中做多,持续下跌行情中做空,实现双向交易。
策略原理
本策略使用加权移动平均线VWMA判断市场趋势方向。当VWMA上涨时,做多;当VWMA下跌时,做空。
具体来说,策略首先计算一定周期的VWMA,然后判断VWMA是否上涨超过5天,如果是,则开仓做多;如果VWMA下跌超过5天,则开仓做空。平仓条件是VWMA方向反转超过5天后平仓。
为了计算月度和年度的收益表现,策略记录每月和每年的收益。通过比较本策略与市场基准收益,可以直观看到策略相对市场的表现。
优势分析
本策略具有以下优势:
-
使用VWMA判断趋势,可以有效过滤市场噪音,捕捉主要趋势。
-
仅在趋势确认后开仓,可以避免趋势反转带来的风险。
-
采用双向交易,无论行情上涨或下跌都可以盈利。
-
记录月度和年度收益,便于评估策略效果。
-
收益表中添加市场基准收益,可以直观比较策略与市场的相对表现。
风险分析
本策略也存在一些风险:
-
使用VWMA判断趋势可能存在滞后,可能错过趋势开始阶段的机会。
-
仅在趋势确认后开仓,可能错过部分Movement。
-
双向交易需要确定止损点,否则亏损可能加大。
-
大市场波动可能导致止损被触发,无法持有完整的趋势。
-
趋势反转判断可能不准确,导致亏损加大。
优化方向
本策略可以从以下方面进行优化:
-
优化VWMA周期参数,改善趋势判断。
-
调整确认趋势的天数,改善进出场时机。
-
添加止损策略,控制单笔亏损。
-
结合其他指标判断走势反转,提高确定性。
-
优化仓位管理,根据市场情况调整仓位。
-
考虑交易成本,设定MinimumProfit。
总结
本策略整体思路清晰简单,利用VWMA判断趋势方向,在趋势确认后双向交易,可以有效跟踪市场走势。但也存在一定风险,需要进一步测试和优化参数,调整进出场逻辑,并适当控制仓位规模。本策略为基础双向交易策略,为量化交易奠定了基础,值得进一步研究与改进。
||
Overview
This strategy uses simple moving average to determine the trend direction and go long in an uptrend and go short in a downtrend to implement reversal trading.
Strategy Logic
This strategy uses Weighted Moving Average (VWMA) to determine the market trend direction. It goes long when VWMA is rising and goes short when VWMA is falling.
Specifically, it first calculates VWMA of a certain period, and then judges if VWMA has risen for over 5 days. If so, it opens long position. If VWMA has fallen for over 5 days, it opens short position. The closing condition is when VWMA direction reverses for over 5 days.
To calculate monthly and yearly returns, the strategy records the profit/loss of each month and year. By comparing the returns of this strategy with market benchmark, we can visually see the relative performance.
Advantage Analysis
The advantages of this strategy include:
-
Using VWMA to determine trend can filter market noise effectively and capture major trends.
-
Opening position only after trend is confirmed can avoid risks associated with trend reversal.
-
Reversal trading can profit from both uptrend and downtrend.
-
Recording monthly and yearly returns facilitates evaluating strategy performance.
-
Adding market benchmark returns enables direct comparison between strategy and market.
Risk Analysis
Some risks of this strategy:
-
Using VWMA to determine trend may lag and miss opportunities at beginning of the trend.
-
Opening position only after confirmation may miss some movements.
-
Reversal trading needs to set stop loss, otherwise loss could enlarge.
-
Significant market fluctuation may trigger stop loss and unable to hold entire trend.
-
Trend reversal judgement may be inaccurate, enlarging losses.
Optimization Directions
Some aspects that could optimize the strategy:
-
Optimize VWMA period parameter to improve trend determination.
-
Adjust number of days to confirm trend, improving entry and exit timing.
-
Add stop loss strategy to control single trade loss.
-
Incorporate other indicators to determine reversals, improving certainty.
-
Optimize position sizing based on market condition.
-
Consider trading cost, set minimum profit target.
Summary
The overall logic of this strategy is simple and clear, using VWMA to determine trend direction and reversal trade after confirmation, which can effectively track market moves. But it also has some risks, requiring further testing and parameter tuning, adjusting entry/exit logic, and appropriate position sizing. This basic reversal trading strategy lays the foundation for quantitative trading and is worth further research and improvement.
[/trans]
Strategy Arguments
| Argument | Default | Description |
|---|---|---|
| v_input_1 | 400 | maLength |
Source (PineScript)
/*backtest
start: 2023-01-01 00:00:00
end: 2023-10-26 00:00:00
period: 1d
basePeriod: 1h
exchanges: [{"eid":"Futures_Binance","currency":"BTC_USDT"}]
*/

//@version=4
strategy(title="Monthly Returns in Strategies with Market Benchmark", shorttitle="Monthly P&L With Market", initial_capital= 1000, overlay=true,default_qty_type = strategy.percent_of_equity, default_qty_value = 100, commission_type = strategy.commission.percent, commission_value = 0.1)
maLength= input(400)

wma= vwma(hl2,maLength)
uptrend= rising(wma, 5)
downtrend= falling(wma,5)

plot(wma)

if uptrend
    strategy.entry("Buy", strategy.long)
else
    strategy.close("Buy")//

///////////////////
// MONTHLY TABLE //

new_month = month(time) != month(time[1])
new_year  = year(time)  != year(time[1])

eq = strategy.equity

bar_pnl = eq / eq[1] - 1
bar_bh = (close-close[1])/close[1]

cur_month_pnl = 0.0
cur_year_pnl  = 0.0
cur_month_bh = 0.0
cur_year_bh  = 0.0

// Current Monthly P&L
cur_month_pnl := new_month ? 0.0 :
                 (1 + cur_month_pnl[1]) * (1 + bar_pnl) - 1
cur_month_bh := new_month ? 0.0 :
                 (1 + cur_month_bh[1]) * (1 + bar_bh) - 1

// Current Yearly P&L
cur_year_pnl := new_year ? 0.0 :
                 (1 + cur_year_pnl[1]) * (1 + bar_pnl) - 1
cur_year_bh := new_year ? 0.0 :
                 (1 + cur_year_bh[1]) * (1 + bar_bh) - 1

// Arrays to store Yearly and Monthly P&Ls
var month_pnl  = array.new_float(0)
var month_time = array.new_int(0)
var month_bh  = array.new_float(0)

var year_pnl  = array.new_float(0)
var year_time = array.new_int(0)
var year_bh  = array.new_float(0)

last_computed = false

if (not na(cur_month_pnl[1]) and (new_month or time_close + (time_close - time_close[1]) > timenow or barstate.islastconfirmedhistory))
    if (last_computed[1])
        array.pop(month_pnl)
        array.pop(month_time)

    array.push(month_pnl , cur_month_pnl[1])
    array.push(month_time, time[1])
    array.push(month_bh , cur_month_bh[1])

if (not na(cur_year_pnl[1]) and (new_year or time_close + (time_close - time_close[1]) > timenow or barstate.islastconfirmedhistory))
    if (last_computed[1])
        array.pop(year_pnl)
        array.pop(year_time)

    array.push(year_pnl , cur_year_pnl[1])
    array.push(year_time, time[1])
    array.push(year_bh , cur_year_bh[1])

last_computed := (time_close + (time_close - time_close[1]) > timenow or barstate.islastconfirmedhistory) ? true : nz(last_computed[1])

// Monthly P&L Table
var monthly_table = table(na)

getCellColor(pnl, bh)  =>
    if pnl > 0
        if bh < 0 or pnl > 2 * bh
            color.new(color.green, transp = 20)
        else if pnl > bh
            color.new(color.green, transp = 50)
        else
            color.new(color.green, transp = 80)
    else
        if bh > 0
            color.new(color.red, transp = 20)
        else if pnl < bh
            color.new(color.red, transp = 50)
        else
            color.new(color.red, transp = 80)

if last_computed
    monthly_table := table.new(position.bottom_right, columns = 14, rows = array.size(year_pnl) + 1, border_width = 1)

    table.cell(monthly_table, 0,  0, "",     bgcolor = #cccccc)
    table.cell(monthly_table, 1,  0, "Jan",  bgcolor = #cccccc)
    table.cell(monthly_table, 2,  0, "Feb",  bgcolor = #cccccc)
    table.cell(monthly_table, 3,  0, "Mar",  bgcolor = #cccccc)
    table.cell(monthly_table, 4,  0, "Apr",  bgcolor = #cccccc)
    table.cell(monthly_table, 5,  0, "May",  bgcolor = #cccccc)
    table.cell(monthly_table, 6,  0, "Jun",  bgcolor = #cccccc)
    table.cell(monthly_table, 7,  0, "Jul",  bgcolor = #cccccc)
    table.cell(monthly_table, 8,  0, "Aug",  bgcolor = #cccccc)
    table.cell(monthly_table, 9,  0, "Sep",  bgcolor = #cccccc)
    table.cell(monthly_table, 10, 0, "Oct",  bgcolor = #cccccc)
    table.cell(monthly_table, 11, 0, "Nov",  bgcolor = #cccccc)
    table.cell(monthly_table, 12, 0, "Dec",  bgcolor = #cccccc)
    table.cell(monthly_table, 13, 0, "Year", bgcolor = #999999)


    for yi = 0 to array.size(year_pnl) - 1
        table.cell(monthly_table, 0,  yi + 1, tostring(year(array.get(year_time, yi))), bgcolor = #cccccc)

        y_color = getCellColor(array.get(year_pnl, yi), array.get(year_bh, yi))
        table.cell(monthly_table, 13, yi + 1, tostring(round(array.get(year_pnl, yi) * 100)) + " (" + tostring(round(array.get(year_bh, yi) * 100)) + ")", bgcolor = y_color)

    for mi = 0 to array.size(month_time) - 1
        m_row   = year(array.get(month_time, mi))  - year(array.get(year_time, 0)) + 1
        m_col   = month(array.get(month_time, mi))
        m_color = getCellColor(array.get(month_pnl, mi), array.get(month_bh, mi))

        table.cell(monthly_table, m_col, m_row, tostring(round(array.get(month_pnl, mi) * 100)) + " (" + tostring(round(array.get(month_bh, mi) * 100)) +")", bgcolor = m_color)
Detail
https://www.fmz.com/strategy/430385
Last Modified
2023-10-27 17:04:48