
175 lines
8.5 KiB
Markdown
175 lines
8.5 KiB
Markdown
|
|
> Name
|
|
|
|
动态EMA交叉与RSI协同交易系统-Dynamic-EMA-Crossover-with-RSI-Synergy-Trading-System
|
|
|
|
> Author
|
|
|
|
ChaoZhang
|
|
|
|
> Strategy Description
|
|
|
|
|
|
|
|
[trans]
|
|
#### 概述
|
|
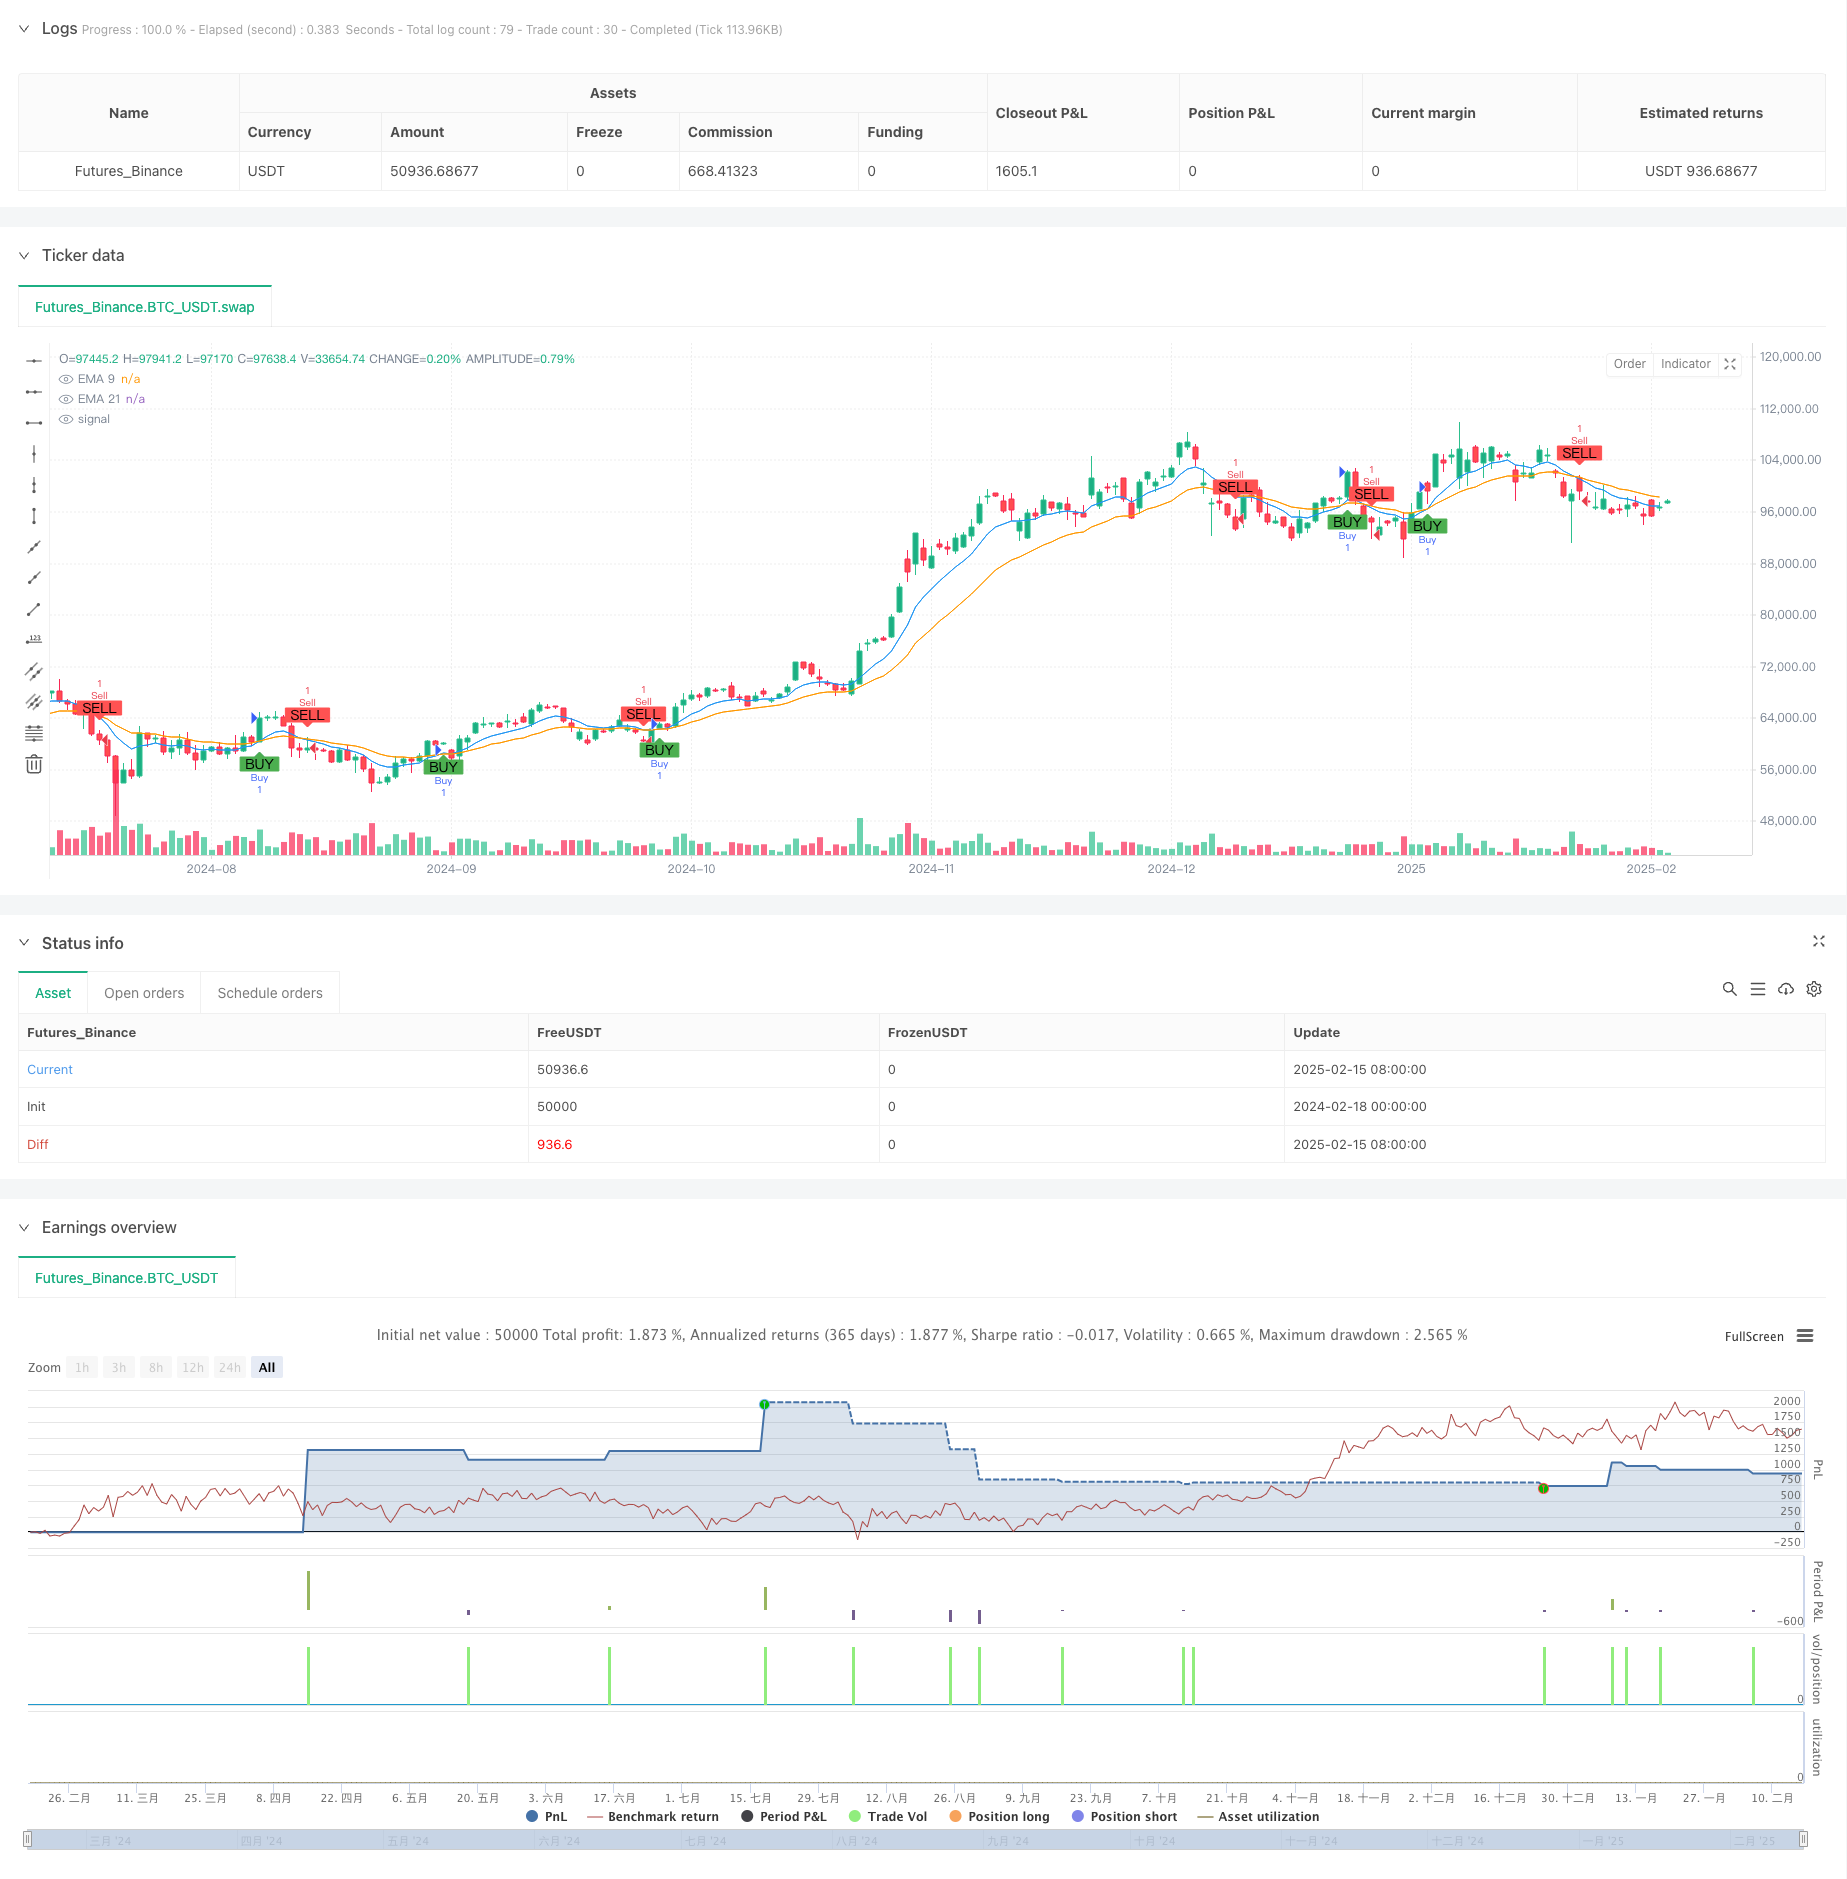
该策略是一个结合了指数移动平均线(EMA)交叉和相对强弱指标(RSI)的自动化交易系统。它通过EMA快线和慢线的交叉来识别趋势方向,同时利用RSI作为趋势确认指标,还包含了完整的资金管理和风险控制机制。系统采用固定风险和盈利目标的方式来管理每笔交易,通过动态计算持仓规模来确保风险的一致性。
|
|
|
|
#### 策略原理
|
|
策略的核心逻辑基于以下几个关键要素:
|
|
1. 使用9周期和21周期的EMA来识别趋势转折点,快线上穿慢线代表上涨趋势开始,下穿代表下跌趋势开始
|
|
2. RSI指标作为趋势确认工具,在买入信号出现时要求RSI>50,卖出信号时要求RSI<50
|
|
3. 风险管理系统设定每笔交易的最大亏损额度为1000,目标盈利为5000,通过调整持仓规模来实现固定的风险收益比
|
|
4. 系统采用固定点数(25点)的止损设置,并根据风险金额动态计算开仓数量
|
|
5. 交易失败检测机制可以及时发现止损出场的交易,并在图表上标记失败点位
|
|
|
|
#### 策略优势
|
|
1. 结合趋势跟踪和动量确认的双重验证机制,提高了交易信号的可靠性
|
|
2. 完善的资金管理系统,每笔交易的风险固定,避免了过度损失
|
|
3. 清晰的风险收益比设置(1:5),有利于长期盈利
|
|
4. 系统具备自动化的交易执行能力,减少了人为情绪干扰
|
|
5. 失败交易的可视化标记有助于策略优化和回测分析
|
|
|
|
#### 策略风险
|
|
1. EMA交叉策略在震荡市场可能产生频繁的假信号
|
|
2. 固定点数止损可能不够灵活,在波动性变化时难以适应
|
|
3. 较大的风险收益比(1:5)可能导致胜率降低
|
|
4. RSI指标在极端市场条件下可能失效
|
|
5. 固定的交易手数可能不适合所有市场条件
|
|
|
|
#### 策略优化方向
|
|
1. 引入自适应的止损机制,如基于ATR的动态止损
|
|
2. 增加市场波动性过滤器,在高波动期间调整策略参数
|
|
3. 考虑添加成交量指标作为辅助确认工具
|
|
4. 开发动态的手数调整机制,根据市场情况自适应
|
|
5. 引入更多的趋势确认工具,如MACD或布林带
|
|
|
|
#### 总结
|
|
该策略通过结合EMA交叉和RSI指标构建了一个完整的交易系统,包含信号生成、风险管理和交易执行等关键环节。虽然存在一些需要优化的地方,但整体框架设计合理,特别是在资金管理方面的考虑较为周全。通过进一步优化和完善,该策略有望在实际交易中取得更好的表现。
|
|
|
|
||
|
|
|
|
#### Overview
|
|
This strategy is an automated trading system that combines Exponential Moving Average (EMA) crossovers with the Relative Strength Index (RSI). It identifies trend directions through EMA crossovers while using RSI as a trend confirmation indicator, incorporating comprehensive money management and risk control mechanisms. The system manages each trade with fixed risk and profit targets, ensuring risk consistency through dynamic position sizing.
|
|
|
|
#### Strategy Principles
|
|
The core logic is based on several key elements:
|
|
1. Uses 9-period and 21-period EMAs to identify trend reversal points, with uptrend signals when fast EMA crosses above slow EMA and downtrend signals when it crosses below
|
|
2. RSI serves as trend confirmation, requiring RSI>50 for buy signals and RSI<50 for sell signals
|
|
3. Risk management system sets maximum loss per trade at 1000 and target profit at 5000, achieving fixed risk-reward ratios through position sizing
|
|
4. System employs fixed point (25 points) stop-loss and dynamically calculates position size based on risk amount
|
|
5. Trade failure detection mechanism identifies stopped-out trades and marks failure points on the chart
|
|
|
|
#### Strategy Advantages
|
|
1. Combines trend following and momentum confirmation for dual validation, improving signal reliability
|
|
2. Comprehensive money management system with fixed risk per trade prevents excessive losses
|
|
3. Clear risk-reward ratio setting (1:5) promotes long-term profitability
|
|
4. System features automated trade execution, reducing emotional interference
|
|
5. Visualization of failed trades aids in strategy optimization and backtesting analysis
|
|
|
|
#### Strategy Risks
|
|
1. EMA crossover strategy may generate frequent false signals in ranging markets
|
|
2. Fixed point stop-loss may lack flexibility in adapting to volatility changes
|
|
3. Large risk-reward ratio (1:5) might lead to lower win rates
|
|
4. RSI indicator may become ineffective in extreme market conditions
|
|
5. Fixed lot size may not suit all market conditions
|
|
|
|
#### Strategy Optimization Directions
|
|
1. Implement adaptive stop-loss mechanism, such as ATR-based dynamic stops
|
|
2. Add market volatility filters to adjust strategy parameters during high volatility periods
|
|
3. Consider incorporating volume indicators as additional confirmation tools
|
|
4. Develop dynamic lot size adjustment mechanism for market adaptability
|
|
5. Introduce additional trend confirmation tools like MACD or Bollinger Bands
|
|
|
|
#### Summary
|
|
This strategy builds a complete trading system by combining EMA crossovers and RSI indicators, encompassing signal generation, risk management, and trade execution. While there are areas for optimization, the overall framework is well-designed, particularly in terms of money management considerations. Through further optimization and refinement, this strategy shows promise for improved performance in actual trading.
|
|
[/trans]
|
|
|
|
|
|
|
|
> Source (PineScript)
|
|
|
|
``` pinescript
|
|
/*backtest
|
|
start: 2024-02-18 00:00:00
|
|
end: 2025-02-16 08:00:00
|
|
period: 1d
|
|
basePeriod: 1d
|
|
exchanges: [{"eid":"Futures_Binance","currency":"BTC_USDT"}]
|
|
*/
|
|
|
|
// This Pine Script™ code is subject to the terms of the Mozilla Public License 2.0 at https://mozilla.org/MPL/2.0/
|
|
// © Lukhi24
|
|
|
|
//@version=6
|
|
strategy("Lukhi EMA Crossover_TWL Strategy" , overlay=true)
|
|
|
|
// Input Parameters
|
|
capital = 15000 // Capital: ₹15,000
|
|
risk_per_trade = 1000 // Risk per Trade: ₹1,000
|
|
target_per_trade = 5000 // Take Profit per Trade: ₹5,000
|
|
lot_size = input.int(1, title="Lot Size") // Nifty option lot size (adjust as per your instrument)
|
|
stop_loss_distance = input.float(25, title="Stop Loss Distance (Points)") // Fixed stop-loss in points (adjustable)
|
|
|
|
// EMA Parameters
|
|
short_ema_length = input.int(9, title="Short EMA Length")
|
|
long_ema_length = input.int(21, title="Long EMA Length")
|
|
|
|
// RSI Parameters
|
|
rsi_length = input.int(14, title="RSI Length")
|
|
rsi_overbought = input.float(70, title="RSI Overbought Level")
|
|
rsi_oversold = input.float(30, title="RSI Oversold Level")
|
|
|
|
// Calculations
|
|
ema_short = ta.ema(close, short_ema_length)
|
|
ema_long = ta.ema(close, long_ema_length)
|
|
rsi = ta.rsi(close, rsi_length)
|
|
|
|
// Buy and Sell Signals
|
|
buy_signal = ta.crossover(ema_short, ema_long) and rsi > 50
|
|
sell_signal = ta.crossunder(ema_short, ema_long) and rsi < 50
|
|
|
|
// Plot EMAs on the chart
|
|
plot(ema_short, color=color.blue, title="EMA 9")
|
|
plot(ema_long, color=color.orange, title="EMA 21")
|
|
|
|
// Risk Management: Position size based on stop-loss distance
|
|
position_size = risk_per_trade / stop_loss_distance
|
|
|
|
// Stop Loss and Take Profit Levels
|
|
long_stop_loss = close - stop_loss_distance
|
|
long_take_profit = close + (target_per_trade / position_size)
|
|
|
|
short_stop_loss = close + stop_loss_distance
|
|
short_take_profit = close - (target_per_trade / position_size)
|
|
|
|
// Strategy Logic: Entry, Stop Loss, and Take Profit
|
|
if (buy_signal)
|
|
strategy.entry("Buy", strategy.long, qty=lot_size)
|
|
strategy.exit("Exit Buy", "Buy", stop=long_stop_loss, limit=long_take_profit)
|
|
|
|
if (sell_signal)
|
|
strategy.entry("Sell", strategy.short, qty=lot_size)
|
|
strategy.exit("Exit Sell", "Sell", stop=short_stop_loss, limit=short_take_profit)
|
|
|
|
// Track Trade Result and Detect Failures
|
|
long_trade_loss = strategy.position_size > 0 and close <= long_stop_loss
|
|
short_trade_loss = strategy.position_size < 0 and close >= short_stop_loss
|
|
|
|
// Plot Buy and Sell signals on the chart
|
|
plotshape(buy_signal, location=location.belowbar, color=color.green, style=shape.labelup, title="Buy Signal", text="BUY")
|
|
plotshape(sell_signal, location=location.abovebar, color=color.red, style=shape.labeldown, title="Sell Signal", text="SELL")
|
|
|
|
// Plot Failure Signals
|
|
plotshape(long_trade_loss, location=location.belowbar, color=color.red, style=shape.cross, title="Long Trade Failed", text="Failed")
|
|
plotshape(short_trade_loss, location=location.abovebar, color=color.red, style=shape.cross, title="Short Trade Failed", text="Failed")
|
|
```
|
|
|
|
> Detail
|
|
|
|
https://www.fmz.com/strategy/482450
|
|
|
|
> Last Modified
|
|
|
|
2025-02-18 14:57:55
|