
215 lines
11 KiB
Markdown
215 lines
11 KiB
Markdown
|
|
> Name
|
|
|
|
动态趋势识别策略与指数移动平均线和自适应波动阈值-Dynamic-Trend-Identification-Strategy-with-Exponential-Moving-Average-and-Adaptive-Volatility-Threshold
|
|
|
|
> Author
|
|
|
|
ianzeng123
|
|
|
|
> Strategy Description
|
|
|
|
|
|

|
|
|
|
|
|
|
|
[trans]
|
|
#### 概述
|
|
|
|
OneTrend Lite EMA策略是一种创新的趋势跟踪交易方法,通过结合指数移动平均线(EMA)、平均趋向指数(ADX)和平均真实波动范围(ATR)来识别和捕捉市场趋势。该策略旨在提供清晰、规则化的交易信号,同时动态调整对市场波动性的敏感度。
|
|
|
|
#### 策略原理
|
|
|
|
策略核心围绕三个关键技术指标展开:
|
|
1. 快速和慢速EMA:通过计算不同周期长度的指数移动平均线,捕捉价格变化趋势
|
|
2. 自定义ADX计算:评估趋势强度和市场动量
|
|
3. 动态ATR阈值:根据ADX值自适应调整趋势判断的敏感度
|
|
|
|
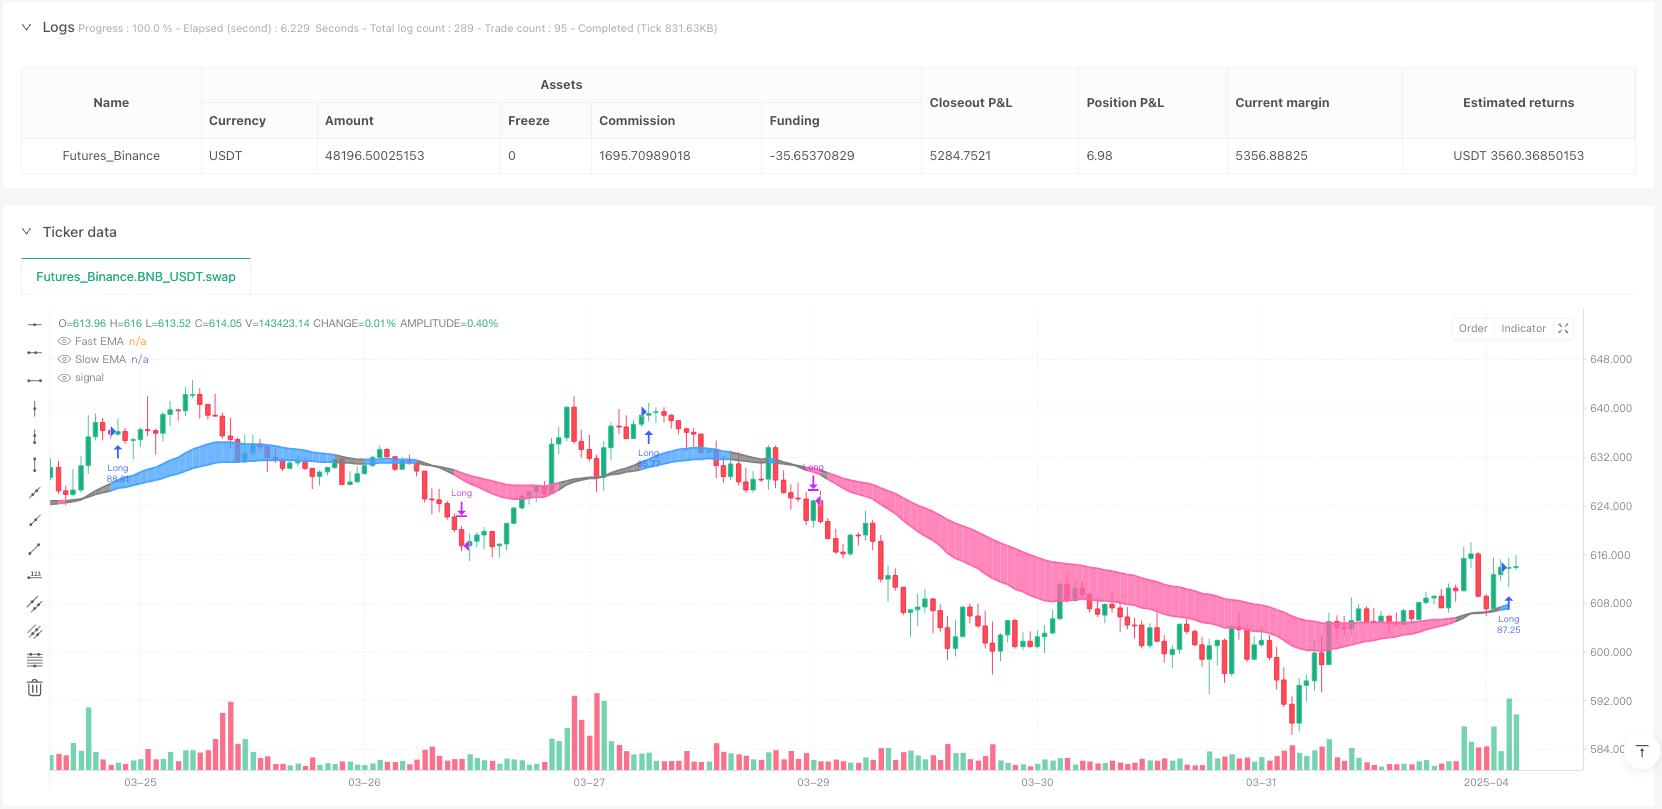
策略使用30周期快速EMA和60周期慢速EMA,通过它们的差值结合自适应ATR乘数来生成交易信号。当快速EMA超过动态阈值时进入蓝色趋势区域(看涨),当跌破阈值时进入粉色区域(看跌)。
|
|
|
|
#### 策略优势
|
|
|
|
1. 自适应性强:通过动态ADX阈值,策略可以根据不同市场条件调整敏感度
|
|
2. 多维度指标组合:融合EMA、ADX和ATR,提高信号准确性
|
|
3. 清晰的视觉化交易区间:蓝色和粉色区域直观展示趋势变化
|
|
4. 风险管理灵活:可调整EMA周期、ATR乘数和ADX阈值
|
|
|
|
#### 策略风险
|
|
|
|
1. 滞后性:EMA本质上存在一定的滞后特征,可能在快速变化的市场中延迟响应
|
|
2. 震荡市场表现:在缺乏明确趋势的市场中,可能产生频繁且无效的交易信号
|
|
3. 参数敏感性:策略性能高度依赖于选择的参数,需要不断回测和优化
|
|
|
|
#### 策略优化方向
|
|
|
|
1. 引入机器学习算法:使用AI技术动态优化参数选择
|
|
2. 多时间框架验证:在不同时间尺度验证策略稳定性
|
|
3. 组合其他指标:结合动量指标如RSI、MACD提高信号准确性
|
|
4. 自适应止损机制:根据ATR动态调整止损策略
|
|
|
|
#### 总结
|
|
|
|
OneTrend Lite EMA策略通过创新的指标组合和自适应阈值,为交易者提供了一种灵活且直观的趋势跟踪方法。尽管存在一些固有风险,但其多维度分析和动态调整能力使其成为一个值得深入研究的量化交易策略。
|
|
|
|
||
|
|
|
|
#### Overview
|
|
|
|
The OneTrend Lite EMA strategy is an innovative trend-tracking trading approach that combines Exponential Moving Averages (EMA), Average Directional Index (ADX), and Average True Range (ATR) to identify and capture market trends. The strategy aims to provide clear, rule-based trading signals while dynamically adjusting sensitivity to market volatility.
|
|
|
|
#### Strategy Principles
|
|
|
|
The strategy's core revolves around three key technical indicators:
|
|
1. Fast and Slow EMAs: Capturing price trend changes by calculating exponential moving averages of different period lengths
|
|
2. Custom ADX Calculation: Evaluating trend strength and market momentum
|
|
3. Dynamic ATR Threshold: Adaptively adjusting trend determination sensitivity based on ADX values
|
|
|
|
The strategy uses a 30-period fast EMA and a 60-period slow EMA, generating trading signals by combining their difference with an adaptive ATR multiplier. It enters the blue trend zone (bullish) when the fast EMA exceeds the dynamic threshold and enters the pink zone (bearish) when it falls below the threshold.
|
|
|
|
#### Strategy Advantages
|
|
|
|
1. High adaptability: Dynamic ADX threshold allows sensitivity adjustment based on different market conditions
|
|
2. Multi-dimensional indicator combination: Integrating EMA, ADX, and ATR improves signal accuracy
|
|
3. Clear visual trading intervals: Blue and pink areas intuitively display trend changes
|
|
4. Flexible risk management: Adjustable EMA periods, ATR multipliers, and ADX thresholds
|
|
|
|
#### Strategy Risks
|
|
|
|
1. Lagging nature: EMAs inherently have a lag, potentially delaying response in rapidly changing markets
|
|
2. Performance in oscillating markets: May generate frequent and ineffective trading signals in markets lacking clear trends
|
|
3. Parameter sensitivity: Strategy performance highly depends on chosen parameters, requiring continuous backtesting and optimization
|
|
|
|
#### Strategy Optimization Directions
|
|
|
|
1. Incorporate machine learning algorithms: Using AI to dynamically optimize parameter selection
|
|
2. Multi-timeframe validation: Verifying strategy stability across different time scales
|
|
3. Combine additional indicators: Integrating momentum indicators like RSI, MACD to improve signal accuracy
|
|
4. Adaptive stop-loss mechanism: Dynamically adjusting stop-loss strategies based on ATR
|
|
|
|
#### Summary
|
|
|
|
The OneTrend Lite EMA strategy provides traders with a flexible and intuitive trend-tracking method through innovative indicator combinations and adaptive thresholds. Despite inherent risks, its multi-dimensional analysis and dynamic adjustment capabilities make it a strategy worthy of in-depth research.
|
|
[/trans]
|
|
|
|
|
|
|
|
> Source (PineScript)
|
|
|
|
``` pinescript
|
|
/*backtest
|
|
start: 2024-04-03 00:00:00
|
|
end: 2025-04-02 00:00:00
|
|
period: 1h
|
|
basePeriod: 1h
|
|
exchanges: [{"eid":"Futures_Binance","currency":"BNB_USDT"}]
|
|
*/
|
|
|
|
//============================== OneTrend Lite Historical Performance ==============================/
|
|
//+--------+-----------+-----------+-----------+--------------------+---------------+---------------+
|
|
//| Ticker | Total P&L | Drawdown | # Trades | Profitable Trades | Profit Factor | Best Method |
|
|
//+--------+-----------+-----------+-----------+--------------------+---------------+---------------+
|
|
//| BTC | 557x | 55.29% | 11 | 72.73% | 13.579 | OneTrend Pro |
|
|
//| ETH | 207x | 55.11% | 13 | 46.15% | 1.696 | OneTrend Pro |
|
|
//| XRP | 29x | 99.85% | 23 | 30.43% | 1.261 | OneTrend Gaus |
|
|
//| SOL | 152x | 40.20% | 8 | 62.50% | 4.341 | OneTrend Gaus |
|
|
//| BNB | 519x | 64.29% | 12 | 50.00% | 3.351 | OneTrend Lite |
|
|
//| DOGE | 21x | 89.63% | 22 | 27.27% | 1.521 | OneTrend Gaus |
|
|
//| ADA | 9x | 76.18% | 9 | 55.56% | 9.039 | OneTrend Pro |
|
|
//| SUI | 6.6x | 11.44% | 2 | 100.00% | ∞ | OneTrend Pro |
|
|
//+--------+-----------+-----------+-----------+--------------------+---------------+---------------+
|
|
|
|
//============================== OneTrend Pro Historical Performance ===============================/
|
|
//+--------+-----------+-----------+-----------+--------------------+---------------+---------------+
|
|
//| Ticker | Total P&L | Drawdown | # Trades | Profitable Trades | Profit Factor | Best Method |
|
|
//+--------+-----------+-----------+-----------+--------------------+---------------+---------------+
|
|
//| BTC | 723x | 50.99% | 41 | 53.66% | 2.625 | OneTrend Pro |
|
|
//| ETH | 1925x | 40.07% | 31 | 58.06% | 3.472 | OneTrend Pro |
|
|
//| XRP | 298x | 99.97% | 53 | 37.74% | 1.87 | OneTrend Gaus |
|
|
//| SOL | 917x | 73.31% | 18 | 44.44% | 2.71 | OneTrend Gaus |
|
|
//| BNB | 353x | 49.44% | 31 | 45.16% | 2.849 | OneTrend Lite |
|
|
//| DOGE | 238x | 92.38% | 40 | 40.00% | 2.389 | OneTrend Gaus |
|
|
//| ADA | 39x | 71.96% | 31 | 35.48% | 1.684 | OneTrend Pro |
|
|
//| SUI | 8.7x | 31.53% | 4 | 50.00% | 13.457 | OneTrend Pro |
|
|
//+--------+-----------+-----------+-----------+--------------------+---------------+---------------+
|
|
|
|
//=========================== OneTrend Gaussian Historical Performance =============================/
|
|
//+--------+-----------+-----------+-----------+--------------------+---------------+---------------+
|
|
//| Ticker | Total P&L | Drawdown | # Trades | Profitable Trades | Profit Factor | Best Method |
|
|
//+--------+-----------+-----------+-----------+--------------------+---------------+---------------+
|
|
//| BTC | 107x | 72.45% | 26 | 57.69% | 5.5 | OneTrend Pro |
|
|
//| ETH | 10x | 40.07% | 31 | 58.06% | 3.472 | OneTrend Pro |
|
|
//| XRP | 1125x | 99.94% | 29 | 48.28% | 1.509 | OneTrend Gaus |
|
|
//| SOL | 925x | 52.10% | 11 | 63.64% | 11.338 | OneTrend Gaus |
|
|
//| BNB | 434x | 58.10% | 22 | 59.09% | 4.845 | OneTrend Lite |
|
|
//| DOGE | 487x | 90.48% | 40 | 32.50% | 2.263 | OneTrend Gaus |
|
|
//| ADA | 20x | 71.96% | 31 | 35.48% | 1.684 | OneTrend Pro |
|
|
//| SUI | 3.3x | 31.53% | 4 | 50.00% | 13.457 | OneTrend Pro |
|
|
//+--------+-----------+-----------+-----------+--------------------+---------------+---------------+
|
|
|
|
//@version=6
|
|
strategy("OneTrend Lite EMA", overlay=true, default_qty_type=strategy.percent_of_equity, default_qty_value=100, initial_capital = 10000)
|
|
|
|
// ——— USER INPUTS ———
|
|
// EMA settings
|
|
emaFastLen = 30
|
|
emaSlowLen = 60
|
|
atrLen = 60
|
|
|
|
// ADX settings
|
|
adxLen = 14
|
|
adxThreshold = 20
|
|
|
|
// ATR multipliers for trend conditions
|
|
atrMultStrong = 0.3
|
|
atrMultWeak = 0.1
|
|
|
|
// ——— CALCULATIONS ———
|
|
// Calculate EMAs and their difference
|
|
emaFast = ta.ema(close, emaFastLen)
|
|
emaSlow = ta.ema(close, emaSlowLen)
|
|
emaDiff = emaFast - emaSlow
|
|
|
|
// --- Custom ADX Calculation ---
|
|
up = ta.change(high)
|
|
down = -ta.change(low)
|
|
plusDM = (up > down and up > 0) ? up : 0.0
|
|
minusDM = (down > up and down > 0) ? down : 0.0
|
|
trur = ta.rma(ta.tr, adxLen)
|
|
plusDI = 100 * ta.rma(plusDM, adxLen) / trur
|
|
minusDI = 100 * ta.rma(minusDM, adxLen) / trur
|
|
dx = 100 * math.abs(plusDI - minusDI) / (plusDI + minusDI)
|
|
adxVal = ta.rma(dx, adxLen)
|
|
|
|
// Determine the dynamic ATR multiplier based solely on ADX
|
|
dynamicAtrMult = adxVal > adxThreshold ? atrMultStrong : atrMultWeak
|
|
|
|
// Define bull (blue) and bear (pink) zones using the dynamic multiplier
|
|
emaBull = emaDiff > dynamicAtrMult * ta.atr(atrLen)
|
|
emaBear = emaDiff < -dynamicAtrMult * ta.atr(atrLen)
|
|
|
|
// ——— PLOTTING ———
|
|
clrBull = color.rgb(70, 163, 255) // Blue for bull
|
|
clrBear = color.rgb(255, 102, 170) // Pink for bear
|
|
clrNeutral = color.rgb(128, 128, 128) // Gray for neutral
|
|
|
|
fastPlot = plot(emaFast, linewidth=2, color=emaBull ? clrBull : emaBear ? clrBear : clrNeutral, title="Fast EMA")
|
|
slowPlot = plot(emaSlow, linewidth=2, color=emaBull ? clrBull : emaBear ? clrBear : clrNeutral, title="Slow EMA")
|
|
fill(fastPlot, slowPlot, color=emaBull ? color.new(clrBull, 70) : emaBear ? color.new(clrBear, 70) : color.new(clrNeutral, 70))
|
|
|
|
// ——— STRATEGY LOGIC ———
|
|
// Enter long immediately when the zone turns blue, and exit when it turns pink.
|
|
if emaBull
|
|
strategy.entry("Long", strategy.long, comment="Long Entry")
|
|
if emaBear
|
|
strategy.close("Long", comment="Close Long")
|
|
```
|
|
|
|
> Detail
|
|
|
|
https://www.fmz.com/strategy/489311
|
|
|
|
> Last Modified
|
|
|
|
2025-04-03 13:08:04
|