
245 lines
9.9 KiB
Markdown
245 lines
9.9 KiB
Markdown
|
|
> Name
|
|
|
|
动态趋势反转与随机指标结合的自适应交易策略-Adaptive-Trading-Strategy-Combining-Dynamic-Trend-Reversal-and-Stochastic-Indicator
|
|
|
|
> Author
|
|
|
|
ianzeng123
|
|
|
|
> Strategy Description
|
|
|
|
|
|
|
|
|
|
|
|
|
|
|
|
[trans]
|
|
#### 概述
|
|
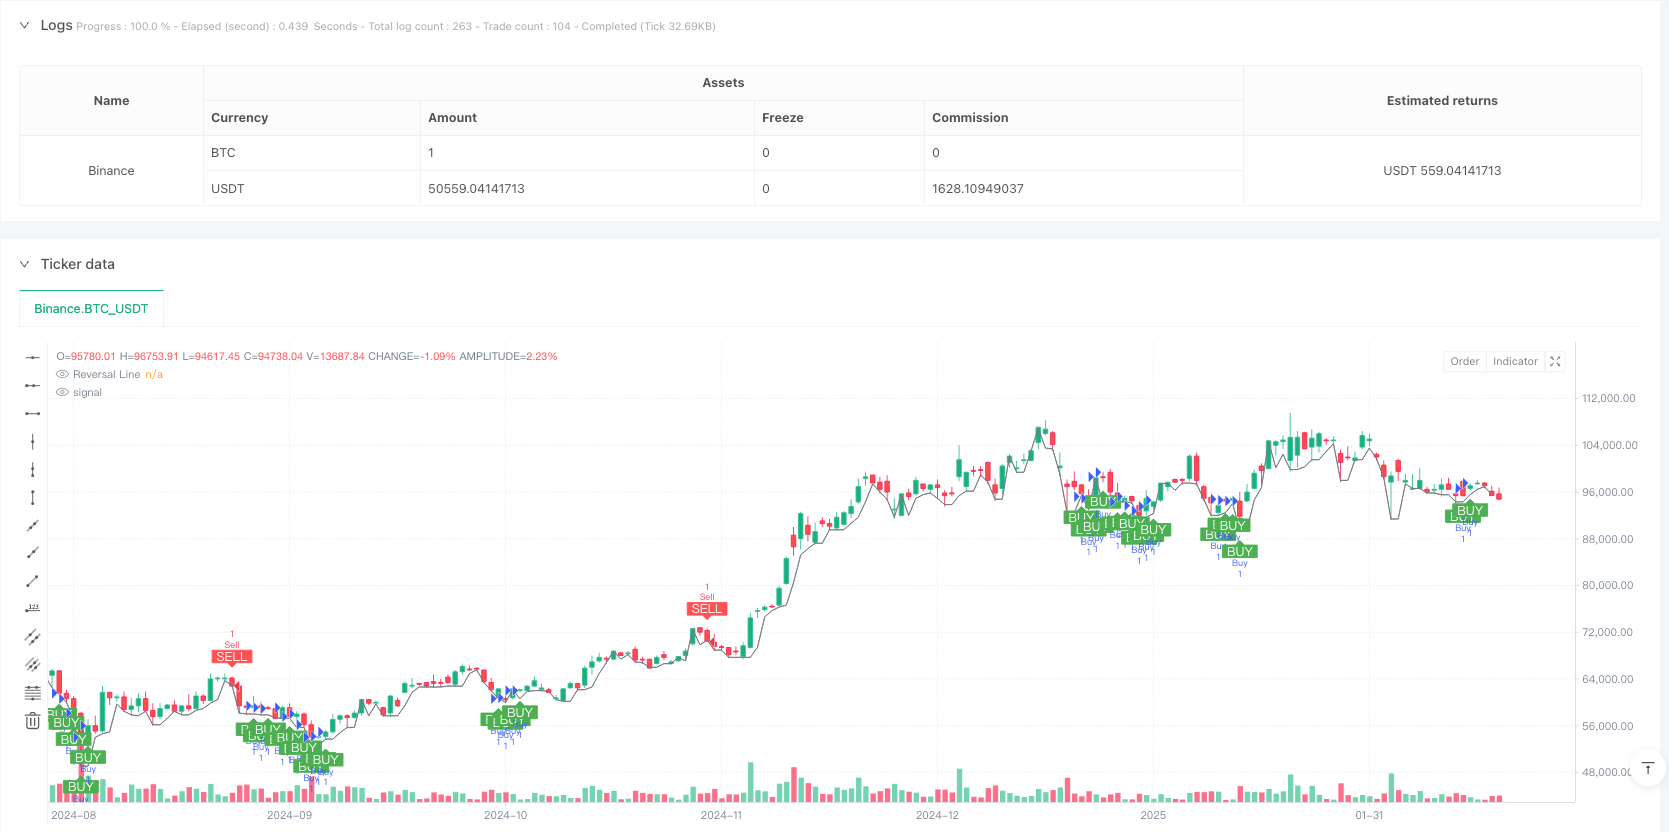
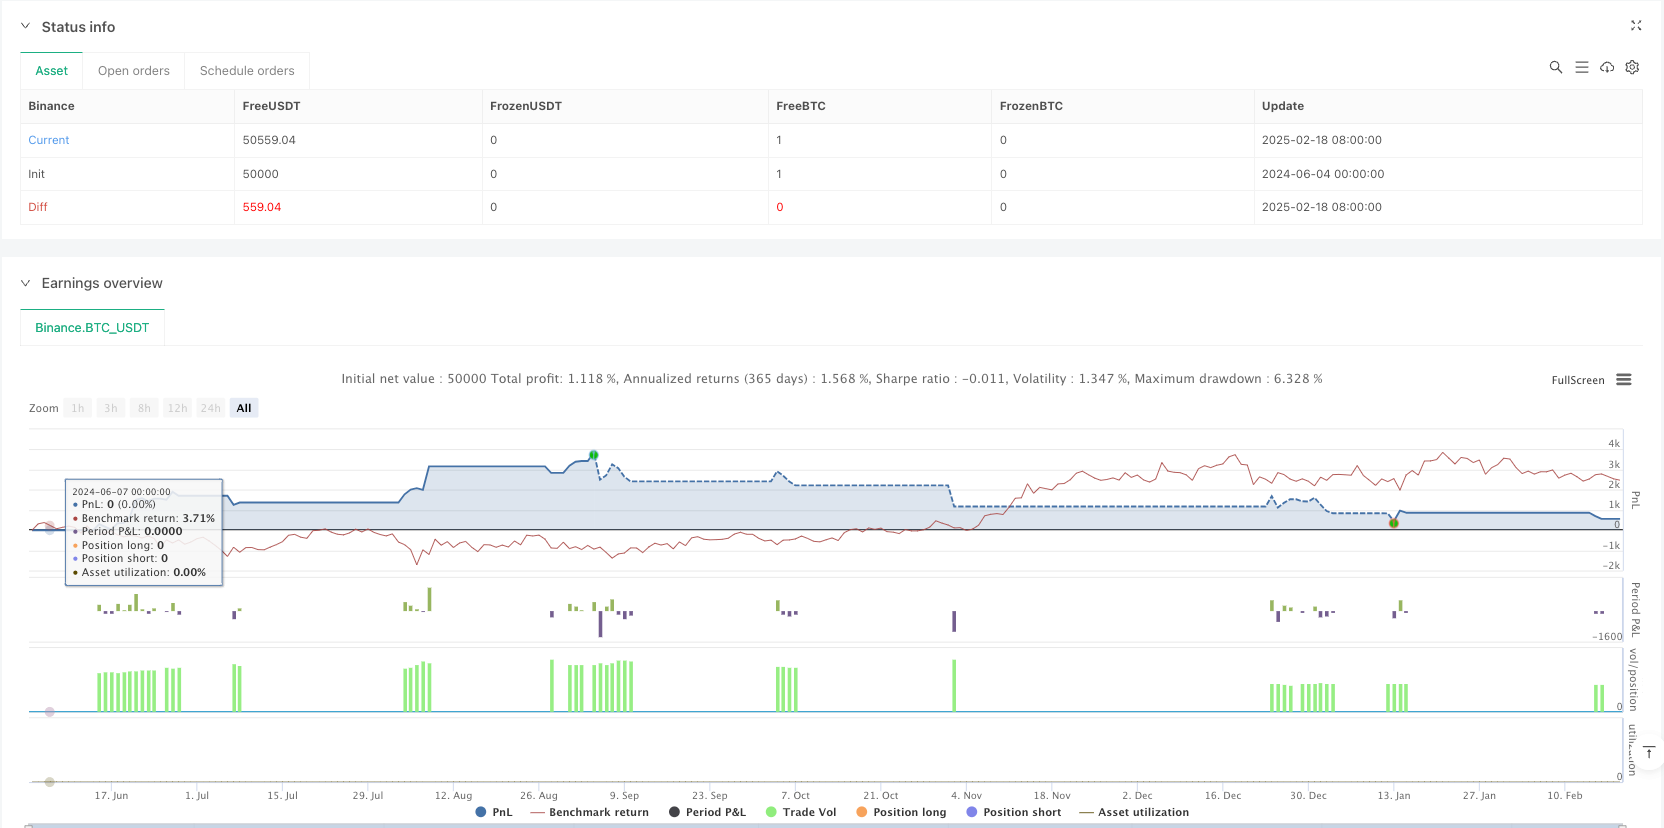
该策略是一个结合ZigZag百分比反转和随机指标的自适应交易系统。它通过动态计算市场波动来识别关键反转点,并结合随机指标超买超卖信号来确定交易时机。策略集成了自动止盈止损机制,可以有效管理风险。
|
|
|
|
#### 策略原理
|
|
策略的核心是通过百分比反转方法动态跟踪市场趋势。它允许用户选择手动设置反转百分比或基于不同周期(5-250天)的ATR动态计算。当价格突破反转线且随机指标K值低于30时产生做多信号;当价格跌破反转线且K值高于70时产生做空信号。系统自动设置止盈止损来保护盈利和控制风险。
|
|
|
|
#### 策略优势
|
|
1. 采用动态自适应的反转计算方法,能更好地适应不同市场环境
|
|
2. 结合趋势反转和动量指标,提供更可靠的交易信号
|
|
3. 内置止盈止损机制,帮助traders自动管理风险
|
|
4. 灵活的参数设置允许traders根据个人交易风格进行优化
|
|
5. 视觉化的交易信号展示,便于分析和决策
|
|
|
|
#### 策略风险
|
|
1. 在震荡市场可能产生频繁的假信号
|
|
2. ATR周期的选择会影响策略表现
|
|
3. 固定的止盈止损可能不适合所有市场环境
|
|
4. 随机指标在某些市场条件下可能滞后
|
|
5. 需要合理设置参数以避免过度交易
|
|
|
|
#### 策略优化方向
|
|
1. 引入多重时间框架分析,提高信号可靠性
|
|
2. 动态调整止盈止损水平,更好地适应市场波动
|
|
3. 添加交易量指标作为确认信号
|
|
4. 开发自适应的随机指标参数
|
|
5. 增加趋势强度过滤器减少假信号
|
|
|
|
#### 总结
|
|
这是一个结合技术分析经典工具的现代化交易策略。通过将ZigZag反转、随机指标和风险管理整合在一起,为交易者提供了一个全面的交易系统。策略的可定制性强,适合不同风险偏好的交易者使用。持续优化和调整参数可以进一步提升策略的稳定性和盈利能力。 ||
|
|
|
|
#### Overview
|
|
This strategy is an adaptive trading system that combines ZigZag percentage reversal with the Stochastic indicator. It identifies key reversal points through dynamic market volatility calculation and determines trading opportunities using Stochastic overbought/oversold signals. The strategy incorporates automatic take-profit and stop-loss mechanisms for effective risk management.
|
|
|
|
#### Strategy Principles
|
|
The core mechanism uses percentage reversal method to dynamically track market trends. Users can choose between manual setting of reversal percentage or dynamic calculation based on ATR across different periods (5-250 days). Buy signals are generated when price breaks above the reversal line with Stochastic K value below 30; sell signals occur when price breaks below the reversal line with K value above 70. The system automatically sets take-profit and stop-loss levels to protect profits and control risks.
|
|
|
|
#### Strategy Advantages
|
|
1. Dynamic adaptive reversal calculation method better suits different market conditions
|
|
2. Integration of trend reversal and momentum indicators provides more reliable trading signals
|
|
3. Built-in take-profit and stop-loss mechanisms help traders manage risk automatically
|
|
4. Flexible parameter settings allow traders to optimize according to personal trading styles
|
|
5. Visualized trading signals facilitate analysis and decision-making
|
|
|
|
#### Strategy Risks
|
|
1. May generate frequent false signals in ranging markets
|
|
2. ATR period selection impacts strategy performance
|
|
3. Fixed take-profit and stop-loss levels may not suit all market conditions
|
|
4. Stochastic indicator may lag in certain market conditions
|
|
5. Requires proper parameter setting to avoid overtrading
|
|
|
|
#### Strategy Optimization Directions
|
|
1. Introduce multiple timeframe analysis to improve signal reliability
|
|
2. Implement dynamic adjustment of take-profit and stop-loss levels for better market adaptation
|
|
3. Add volume indicators as confirmation signals
|
|
4. Develop adaptive Stochastic indicator parameters
|
|
5. Include trend strength filters to reduce false signals
|
|
|
|
#### Summary
|
|
This is a modernized trading strategy combining classic technical analysis tools. By integrating ZigZag reversal, Stochastic indicator, and risk management, it provides traders with a comprehensive trading system. The strategy's high customizability makes it suitable for traders with different risk preferences. Continuous optimization and parameter adjustment can further enhance the strategy's stability and profitability.[/trans]
|
|
|
|
|
|
|
|
> Source (PineScript)
|
|
|
|
``` pinescript
|
|
/*backtest
|
|
start: 2024-06-04 00:00:00
|
|
end: 2025-02-19 08:00:00
|
|
period: 1d
|
|
basePeriod: 1d
|
|
exchanges: [{"eid":"Binance","currency":"BTC_USDT"}]
|
|
*/
|
|
|
|
//@version=5
|
|
strategy("[RS]ZigZag Percent Reversal with Stochastic Strategy", overlay=true)
|
|
|
|
// ZigZag Settings
|
|
string percent_method = input.string(
|
|
defval="MANUAL",
|
|
title="Method to use for the zigzag reversal range:",
|
|
options=[
|
|
"MANUAL",
|
|
"ATR005 * X", "ATR010 * X", "ATR020 * X", "ATR050 * X", "ATR100 * X", "ATR250 * X"
|
|
]
|
|
)
|
|
|
|
var float percent = input.float(
|
|
defval=0.25,
|
|
title="Percent of last pivot price for zigzag reversal:",
|
|
minval=0.0, maxval=99.0
|
|
) / 100
|
|
|
|
float percent_multiplier = input.float(
|
|
defval=1.0,
|
|
title="Multiplier to apply to ATR if applicable:"
|
|
)
|
|
if percent_method == "ATR005 * X"
|
|
percent := ta.atr(5) / open * percent_multiplier
|
|
if percent_method == "ATR010 * X"
|
|
percent := ta.atr(10) / open * percent_multiplier
|
|
if percent_method == "ATR020 * X"
|
|
percent := ta.atr(20) / open * percent_multiplier
|
|
if percent_method == "ATR050 * X"
|
|
percent := ta.atr(50) / open * percent_multiplier
|
|
if percent_method == "ATR100 * X"
|
|
percent := ta.atr(100) / open * percent_multiplier
|
|
if percent_method == "ATR250 * X"
|
|
percent := ta.atr(250) / open * percent_multiplier
|
|
|
|
// Zigzag function
|
|
f_zz(_percent)=>
|
|
// Direction
|
|
var bool _is_direction_up = na
|
|
var float _htrack = na
|
|
var float _ltrack = na
|
|
var float _pivot = na
|
|
float _reverse_range = 0.0
|
|
var int _real_pivot_time = na
|
|
var int _htime = na
|
|
var int _ltime = na
|
|
var float _reverse_line = na
|
|
|
|
if bar_index >= 1
|
|
|
|
if na(_is_direction_up)
|
|
_is_direction_up := true
|
|
|
|
_reverse_range := nz(_pivot[1]) * _percent
|
|
|
|
if _is_direction_up
|
|
_ltrack := na
|
|
_ltime := time
|
|
|
|
if na(_htrack)
|
|
if high > high[1]
|
|
_htrack := high
|
|
_htime := time
|
|
else
|
|
_htrack := high[1]
|
|
_htime := time[1]
|
|
else
|
|
if high > _htrack
|
|
_htrack := high
|
|
_htime := time
|
|
|
|
_reverse_line := _htrack - _reverse_range
|
|
|
|
if close <= _reverse_line
|
|
_pivot := _htrack
|
|
_real_pivot_time := _htime
|
|
_is_direction_up := false
|
|
|
|
if not _is_direction_up
|
|
_htrack := na
|
|
_htime := na
|
|
|
|
if na(_ltrack)
|
|
if low < low[1]
|
|
_ltrack := low
|
|
_ltime := time
|
|
else
|
|
_ltrack := low[1]
|
|
_ltime := time[1]
|
|
else
|
|
if low < _ltrack
|
|
_ltrack := low
|
|
_ltime := time
|
|
|
|
_reverse_line := _ltrack + _reverse_range
|
|
|
|
if close >= _reverse_line
|
|
_pivot := _ltrack
|
|
_real_pivot_time := _ltime
|
|
_is_direction_up := true
|
|
|
|
[_pivot, _is_direction_up, _reverse_line, _real_pivot_time]
|
|
|
|
[pivot, direction_up, reverse_line, pivot_time] = f_zz(percent)
|
|
|
|
// Reversal line
|
|
var float static_reverse_line = na
|
|
if (not na(reverse_line))
|
|
static_reverse_line := reverse_line
|
|
|
|
plot(series=static_reverse_line, color=color.gray, style=plot.style_line, title="Reversal Line", trackprice=false)
|
|
|
|
// Stochastic Settings
|
|
K_length = input.int(9, title="Stochastic K Length", minval=1) // User input
|
|
K_smoothing = input.int(3, title="Stochastic K Smoothing", minval=1) // User input
|
|
stochK = ta.sma(ta.stoch(close, high, low, K_length), K_smoothing)
|
|
|
|
// User Input: Take Profit and Stop Loss Levels
|
|
stop_loss_pips = input.int(100, title="Stop Loss (pips)", minval=1) // Stop Loss
|
|
take_profit_pips = input.int(300, title="Take Profit (pips)", minval=1) // Take Profit
|
|
|
|
// Calculating levels
|
|
long_stop_loss = close - stop_loss_pips * syminfo.mintick
|
|
long_take_profit = close + take_profit_pips * syminfo.mintick
|
|
short_stop_loss = close + stop_loss_pips * syminfo.mintick
|
|
short_take_profit = close - take_profit_pips * syminfo.mintick
|
|
|
|
// Buy and Sell Conditions
|
|
buy_signal = close > static_reverse_line and stochK < 30 // K < 30 condition
|
|
sell_signal = close < static_reverse_line and stochK > 70 // K > 70 condition
|
|
|
|
if buy_signal
|
|
strategy.entry("Buy", strategy.long)
|
|
strategy.exit("TP/SL", "Buy", stop=long_stop_loss, limit=long_take_profit)
|
|
|
|
if sell_signal
|
|
strategy.entry("Sell", strategy.short)
|
|
strategy.exit("TP/SL", "Sell", stop=short_stop_loss, limit=short_take_profit)
|
|
|
|
// Signal Visualization
|
|
plotshape(series=buy_signal, location=location.belowbar, color=color.green, style=shape.labelup, title="Buy Signal", text="BUY", textcolor=color.white)
|
|
plotshape(series=sell_signal, location=location.abovebar, color=color.red, style=shape.labeldown, title="Sell Signal", text="SELL", textcolor=color.white)
|
|
|
|
```
|
|
|
|
> Detail
|
|
|
|
https://www.fmz.com/strategy/483102
|
|
|
|
> Last Modified
|
|
|
|
2025-02-27 17:00:50
|