
162 lines
9.0 KiB
Markdown
162 lines
9.0 KiB
Markdown
|
|
> Name
|
|
|
|
动态趋势动量交易策略-Dynamic-Trend-Momentum-Trading-Strategy
|
|
|
|
> Author
|
|
|
|
ChaoZhang
|
|
|
|
> Strategy Description
|
|
|
|
|
|
|
|
[trans]
|
|
#### 概述
|
|
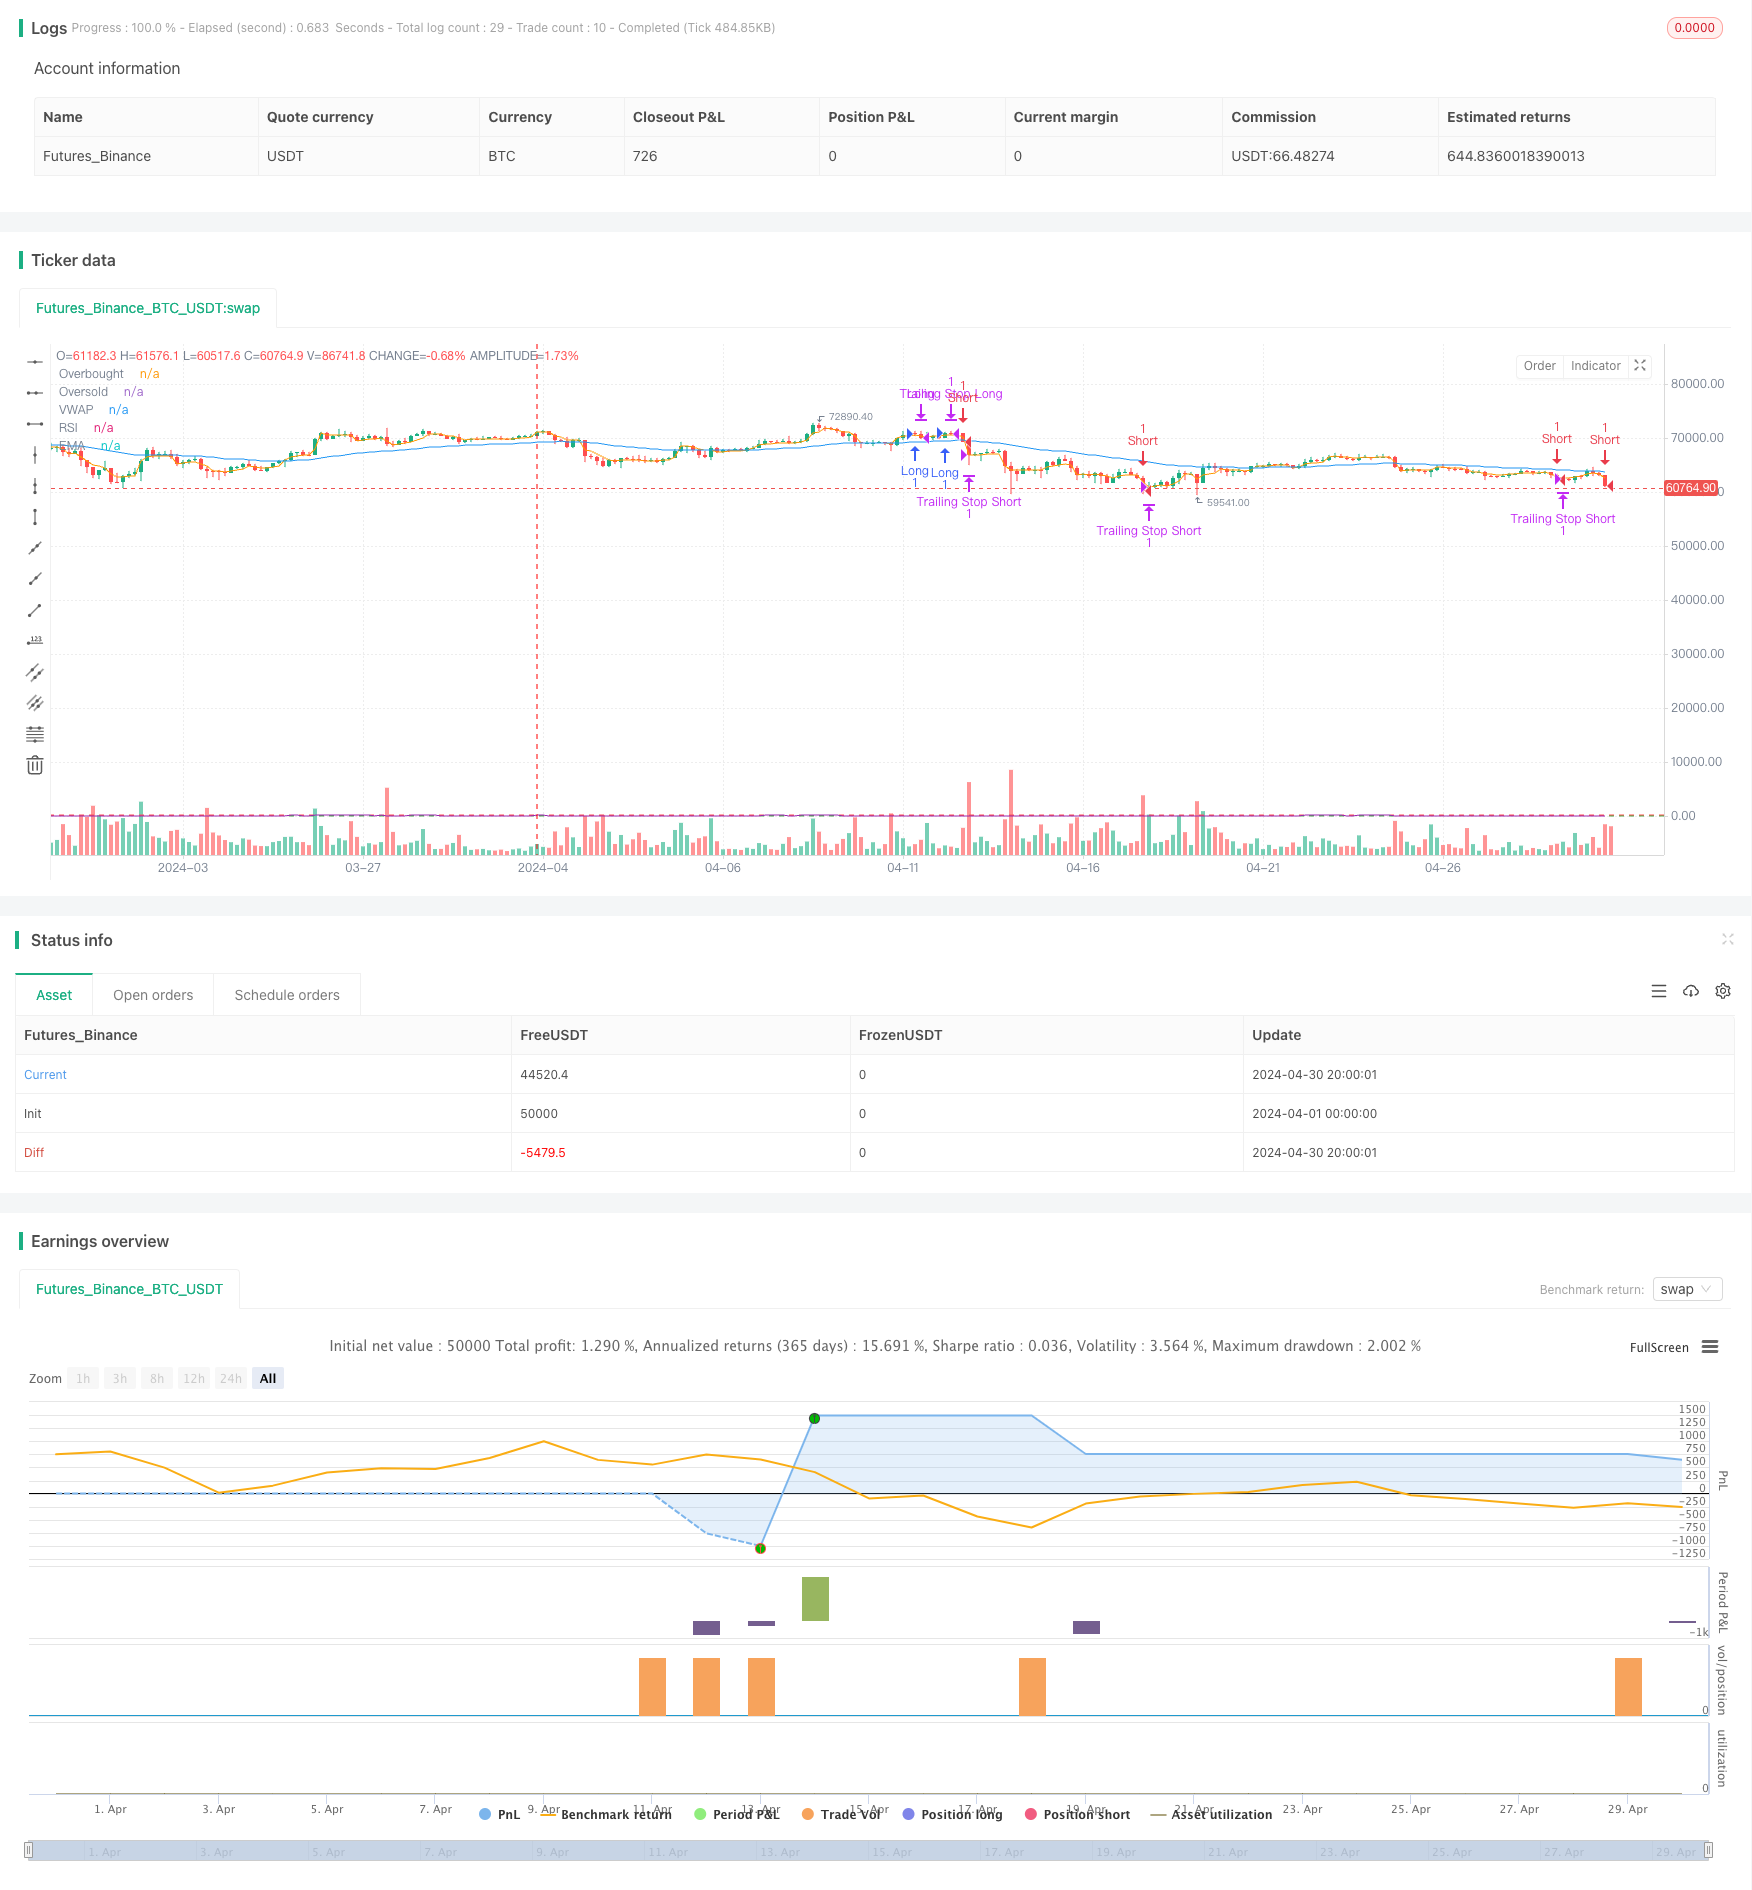
该策略结合了EMA、MACD、VWAP和RSI等多个指标,旨在捕捉高概率的交易机会。策略使用EMA来判断趋势方向,MACD来判断动量,VWAP来判断成交量,RSI来判断超买超卖情况。策略根据这些指标的组合来产生买入和卖出信号,同时使用移动止损来保护利润。
|
|
|
|
#### 策略原理
|
|
1. 使用EMA来判断趋势方向,当价格在EMA上方时认为是上升趋势,在EMA下方时认为是下降趋势。
|
|
2. 使用MACD来判断动量,当MACD快线上穿慢线时认为动量转强,快线下穿慢线时认为动量转弱。
|
|
3. 使用VWAP来判断成交量,当价格在VWAP上方时认为买盘强于卖盘,在VWAP下方时认为卖盘强于买盘。
|
|
4. 使用RSI来判断超买超卖情况,当RSI高于70时认为超买,低于30时认为超卖。
|
|
5. 当价格在EMA上方,MACD快线上穿慢线,价格在VWAP上方,RSI低于超买水平时,产生买入信号。
|
|
6. 当价格在EMA下方,MACD快线下穿慢线,价格在VWAP下方,RSI高于超卖水平时,产生卖出信号。
|
|
7. 根据账户资金和风险比例来计算头寸大小。
|
|
8. 使用移动止损来保护利润,止损价格随着价格变动而变动。
|
|
|
|
#### 策略优势
|
|
1. 多指标组合使用,可以更全面地判断市场状态,提高交易信号的准确性。
|
|
2. 使用移动止损,可以在趋势延续时保护利润,减少回撤。
|
|
3. 根据账户资金和风险比例来计算头寸大小,可以控制每笔交易的风险。
|
|
4. 参数可以根据用户偏好进行调整,提高策略的灵活性。
|
|
|
|
#### 策略风险
|
|
1. 在震荡市场中,频繁的交易信号可能导致过度交易和手续费损失。
|
|
2. 在趋势反转时,移动止损可能无法及时止损,导致较大的回撤。
|
|
3. 参数的选择需要根据不同市场和品种进行优化,不恰当的参数可能导致策略表现不佳。
|
|
|
|
#### 策略优化方向
|
|
1. 可以考虑加入更多的过滤条件,如交易量、波动率等,以进一步提高信号的准确性。
|
|
2. 可以考虑使用更加动态的止损方式,如ATR止损等,以更好地应对不同的市场状况。
|
|
3. 可以考虑对参数进行优化,如使用遗传算法等方法,寻找最优参数组合。
|
|
4. 可以考虑加入仓位管理和资金管理策略,以更好地控制风险和提高收益。
|
|
|
|
#### 总结
|
|
该策略通过结合多个指标来判断市场状态,产生交易信号,同时使用移动止损来保护利润。策略参数可以根据用户偏好进行调整,提高策略的灵活性。但是,策略在震荡市场中可能表现不佳,在趋势反转时可能面临较大回撤,因此需要根据不同市场和品种进行优化和改进。未来可以考虑加入更多的过滤条件、动态止损方式、参数优化和仓位管理等方面的优化,以提高策略的稳定性和盈利能力。
|
|
|
|
||
|
|
|
|
#### Overview
|
|
This strategy combines multiple indicators such as EMA, MACD, VWAP, and RSI to capture high-probability trading opportunities. It uses EMA to determine the trend direction, MACD for momentum, VWAP for volume, and RSI for overbought and oversold conditions. The strategy generates buy and sell signals based on a combination of these indicators while using a trailing stop loss to protect profits.
|
|
|
|
#### Strategy Principles
|
|
1. EMA is used to determine the trend direction. When the price is above the EMA, it is considered an uptrend, and when below, it is considered a downtrend.
|
|
2. MACD is used to gauge momentum. When the MACD fast line crosses above the slow line, momentum is considered to be turning bullish, and when it crosses below, momentum is considered to be turning bearish.
|
|
3. VWAP is used to assess volume. When the price is above VWAP, buying pressure is considered to be stronger than selling pressure, and when below, selling pressure is considered to be stronger.
|
|
4. RSI is used to determine overbought and oversold conditions. When RSI is above 70, it is considered overbought, and when below 30, it is considered oversold.
|
|
5. A buy signal is generated when the price is above the EMA, the MACD fast line crosses above the slow line, the price is above VWAP, and RSI is below the overbought level.
|
|
6. A sell signal is generated when the price is below the EMA, the MACD fast line crosses below the slow line, the price is below VWAP, and RSI is above the oversold level.
|
|
7. Position size is calculated based on account equity and risk percentage.
|
|
8. A trailing stop loss is used to protect profits, with the stop loss price moving along with the price.
|
|
|
|
#### Strategy Advantages
|
|
1. The combination of multiple indicators provides a more comprehensive assessment of market conditions, improving the accuracy of trading signals.
|
|
2. The use of a trailing stop loss helps protect profits during trend continuation and reduces drawdowns.
|
|
3. Calculating position size based on account equity and risk percentage allows for control over the risk of each trade.
|
|
4. Parameters can be adjusted according to user preferences, enhancing the flexibility of the strategy.
|
|
|
|
#### Strategy Risks
|
|
1. In choppy markets, frequent trading signals may lead to overtrading and commission losses.
|
|
2. During trend reversals, the trailing stop loss may not exit positions quickly enough, leading to larger drawdowns.
|
|
3. Parameter selection needs to be optimized for different markets and instruments, and inappropriate parameters may lead to poor strategy performance.
|
|
|
|
#### Strategy Optimization Directions
|
|
1. Consider adding more filtering conditions, such as volume and volatility, to further improve signal accuracy.
|
|
2. Consider using more dynamic stop loss methods, such as ATR stop loss, to better adapt to different market conditions.
|
|
3. Consider optimizing parameters using methods like genetic algorithms to find the optimal parameter combination.
|
|
4. Consider incorporating position sizing and money management strategies to better control risk and enhance returns.
|
|
|
|
#### Summary
|
|
This strategy combines multiple indicators to assess market conditions and generate trading signals while using a trailing stop loss to protect profits. Strategy parameters can be adjusted according to user preferences, enhancing the flexibility of the strategy. However, the strategy may perform poorly in choppy markets and face larger drawdowns during trend reversals, so it needs to be optimized and improved for different markets and instruments. Future optimizations can consider adding more filtering conditions, dynamic stop loss methods, parameter optimization, and position sizing to improve the stability and profitability of the strategy.
|
|
[/trans]
|
|
|
|
|
|
|
|
> Source (PineScript)
|
|
|
|
``` pinescript
|
|
/*backtest
|
|
start: 2024-04-01 00:00:00
|
|
end: 2024-04-30 23:59:59
|
|
period: 4h
|
|
basePeriod: 15m
|
|
exchanges: [{"eid":"Futures_Binance","currency":"BTC_USDT"}]
|
|
*/
|
|
|
|
//@version=5
|
|
strategy("Intraday Strategy", overlay=true)
|
|
|
|
// Input parameters
|
|
emaLength = input.int(50, title="EMA Length")
|
|
macdShort = input.int(12, title="MACD Short Period")
|
|
macdLong = input.int(26, title="MACD Long Period")
|
|
macdSignal = input.int(9, title="MACD Signal Period")
|
|
rsiLength = input.int(14, title="RSI Length")
|
|
rsiOverbought = input.int(70, title="RSI Overbought Level")
|
|
rsiOversold = input.int(30, title="RSI Oversold Level")
|
|
risk = input.float(1, title="Risk Percentage", minval=0.1, step=0.1)
|
|
trailOffset = input.float(0.5, title="Trailing Stop Offset", minval=0.1, step=0.1)
|
|
|
|
// Calculating indicators
|
|
ema = ta.ema(close, emaLength)
|
|
[macdLine, signalLine, _] = ta.macd(close, macdShort, macdLong, macdSignal)
|
|
rsi = ta.rsi(close, rsiLength)
|
|
vwap = ta.vwap(close)
|
|
|
|
// Entry conditions
|
|
longCondition = ta.crossover(macdLine, signalLine) and close > ema and rsi < rsiOverbought and close > vwap
|
|
shortCondition = ta.crossunder(macdLine, signalLine) and close < ema and rsi > rsiOversold and close < vwap
|
|
|
|
// Exit conditions
|
|
longExitCondition = ta.crossunder(macdLine, signalLine) or close < ema
|
|
shortExitCondition = ta.crossover(macdLine, signalLine) or close > ema
|
|
|
|
// Position sizing based on risk percentage
|
|
capital = strategy.equity
|
|
positionSize = (capital * (risk / 100)) / close
|
|
|
|
// Executing trades
|
|
if (longCondition)
|
|
strategy.entry("Long", strategy.long, qty=1)
|
|
if (shortCondition)
|
|
strategy.entry("Short", strategy.short, qty=1)
|
|
|
|
if (longExitCondition)
|
|
strategy.close("Long")
|
|
if (shortExitCondition)
|
|
strategy.close("Short")
|
|
|
|
// Trailing stop loss
|
|
if (strategy.position_size > 0)
|
|
strategy.exit("Trailing Stop Long", from_entry="Long", trail_price=close, trail_offset=trailOffset)
|
|
if (strategy.position_size < 0)
|
|
strategy.exit("Trailing Stop Short", from_entry="Short", trail_price=close, trail_offset=trailOffset)
|
|
|
|
// Plotting indicators
|
|
plot(ema, title="EMA", color=color.blue)
|
|
hline(rsiOverbought, "Overbought", color=color.red)
|
|
hline(rsiOversold, "Oversold", color=color.green)
|
|
plot(rsi, title="RSI", color=color.purple)
|
|
plot(vwap, title="VWAP", color=color.orange)
|
|
|
|
```
|
|
|
|
> Detail
|
|
|
|
https://www.fmz.com/strategy/452276
|
|
|
|
> Last Modified
|
|
|
|
2024-05-23 17:57:22
|