
196 lines
11 KiB
Markdown
196 lines
11 KiB
Markdown
|
|
> Name
|
|
|
|
动态自适应多时间周期趋势跟踪与震荡反转复合策略-Dynamic-Adaptive-Multi-Timeframe-Trend-Following-and-Range-Reversal-Hybrid-Strategy
|
|
|
|
> Author
|
|
|
|
ianzeng123
|
|
|
|
> Strategy Description
|
|
|
|
|
|
|
|
|
|
|
|
|
|
[trans]
|
|
#### 概述
|
|
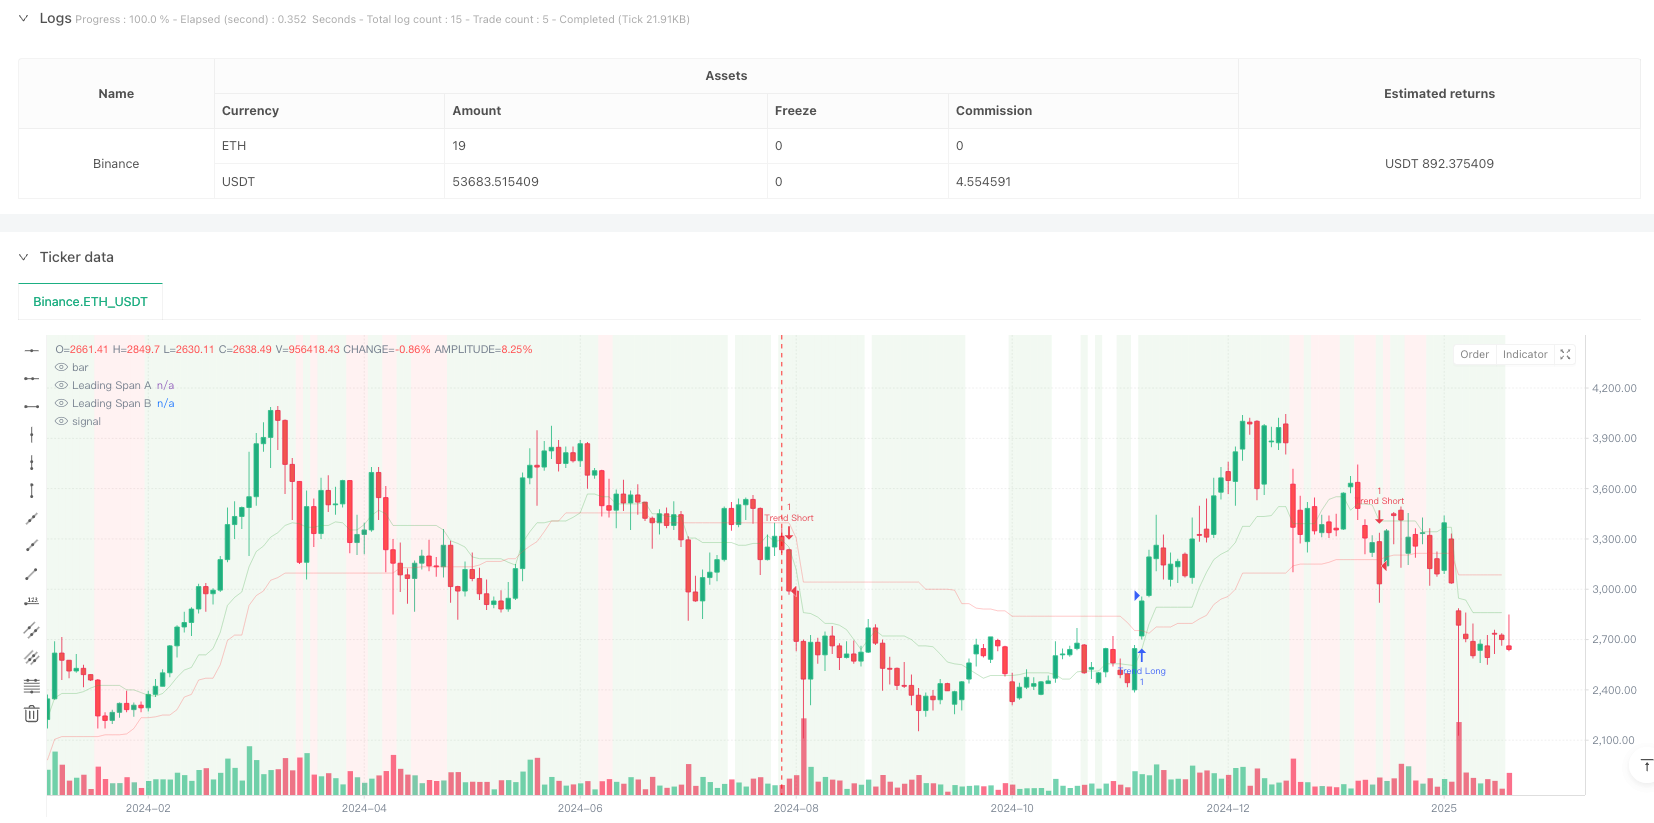
本策略是一个结合了趋势跟踪和区间交易的复合型交易系统,通过ichimoku云图进行市场状态识别,结合MACD动量确认和RSI超买超卖指标,同时运用ATR进行动态止损管理。该策略能够在趋势市场中捕捉趋势性机会,在震荡市场中寻找反转机会,具有较强的适应性和灵活性。
|
|
|
|
#### 策略原理
|
|
策略采用多层次信号确认机制:
|
|
1. 使用ichimoku云图作为市场状态的主要判断依据,通过价格与云层的位置关系判断市场是处于趋势还是震荡状态
|
|
2. 在趋势市场中,当价格位于云层之上且RSI>55、MACD柱状图为正时,进场做多;当价格位于云层之下且RSI<45、MACD柱状图为负时,进场做空
|
|
3. 在震荡市场中,当RSI<30且随机RSI<20时,寻找做多机会;当RSI>70且随机RSI>80时,寻找做空机会
|
|
4. 使用基于ATR的动态止损来管理风险,止损距离为ATR值的2倍
|
|
|
|
#### 策略优势
|
|
1. 市场适应性强:能够根据不同市场状态自动调整交易策略,提高策略的稳定性
|
|
2. 信号可靠性高:采用多重指标验证机制,降低虚假信号的影响
|
|
3. 风险控制完善:通过ATR动态止损,既能让盈利充分发展,又能有效控制风险
|
|
4. 可视化效果好:通过背景颜色标注市场状态,便于交易者直观理解市场环境
|
|
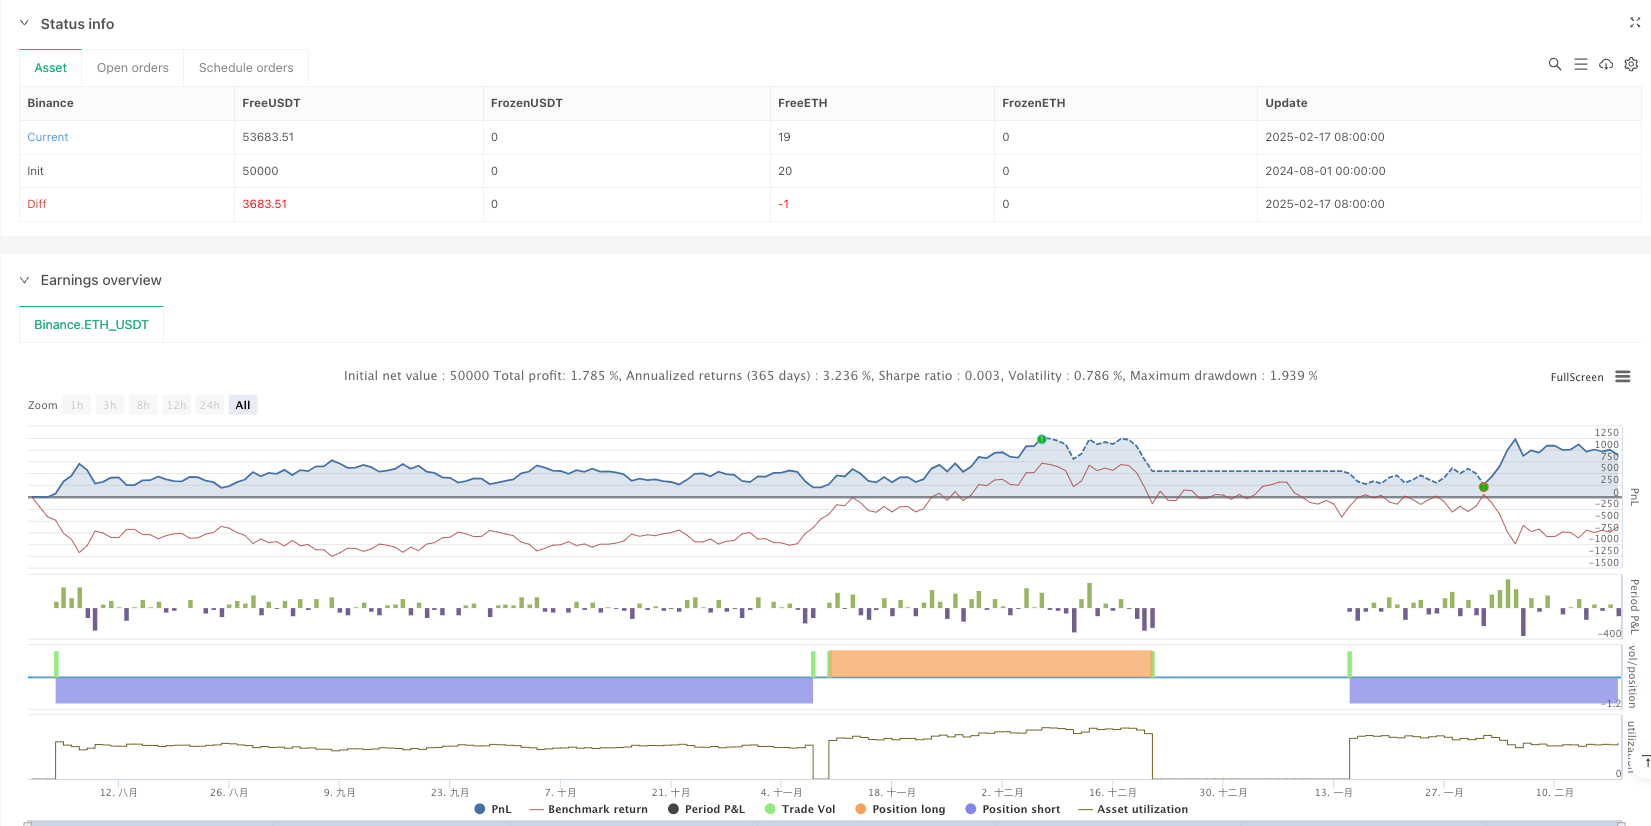
5. 高时间周期表现优异:在日线周期上具有2.159的利润因子,净利润达到10.71%
|
|
|
|
#### 策略风险
|
|
1. 胜率偏低:各个时间周期的胜率都低于40%,需要较强的心理承受能力
|
|
2. 低时间周期过度交易:在4小时周期内执行了430笔交易,效率较低
|
|
3. 信号滞后性:由于使用多重指标验证,可能错过一些市场机会
|
|
4. 参数优化难度大:多个指标的组合增加了策略优化的复杂度
|
|
|
|
#### 策略优化方向
|
|
1. 信号筛选优化:可以通过调整各指标的阈值来提高胜率
|
|
2. 时间周期适配:建议主要在日线及以上周期使用,可以根据不同市场特点调整参数
|
|
3. 止损优化:可以考虑根据不同市场状态动态调整ATR倍数
|
|
4. 入场时机优化:可以增加成交量确认或价格形态确认来提高入场准确性
|
|
5. 仓位管理优化:可以根据信号强度设计动态仓位管理系统
|
|
|
|
#### 总结
|
|
该策略是一个设计合理、逻辑清晰的综合交易系统,通过多重指标的配合使用,实现了市场状态的智能识别和交易机会的精准捕捉。虽然在低时间周期上存在一些问题,但在日线等较高时间周期上表现优异。建议交易者在实盘使用时,着重关注日线级别的信号,并根据自身风险承受能力合理调整参数。通过不断优化和调整,该策略有望为交易者提供稳定的盈利机会。 ||
|
|
|
|
#### Overview
|
|
This strategy is a hybrid trading system that combines trend following and range trading, using the Ichimoku Cloud for market state identification, MACD for momentum confirmation, RSI for overbought/oversold conditions, and ATR for dynamic stop-loss management. The strategy can capture trending opportunities in trending markets and find reversal opportunities in ranging markets, showing strong adaptability and flexibility.
|
|
|
|
#### Strategy Principles
|
|
The strategy employs a multi-level signal confirmation mechanism:
|
|
1. Uses the Ichimoku Cloud as the primary indicator for market state determination, judging whether the market is trending or ranging based on price position relative to the cloud
|
|
2. In trending markets, enters long when price is above the cloud with RSI>55 and positive MACD histogram; enters short when price is below the cloud with RSI<45 and negative MACD histogram
|
|
3. In ranging markets, looks for long opportunities when RSI<30 and Stochastic RSI<20; looks for short opportunities when RSI>70 and Stochastic RSI>80
|
|
4. Uses ATR-based dynamic stop-loss for risk management, with stop-loss distance set at 2 times the ATR value
|
|
|
|
#### Strategy Advantages
|
|
1. Strong market adaptability: Automatically adjusts trading strategy based on different market conditions, improving strategy stability
|
|
2. High signal reliability: Uses multiple indicator verification mechanism to reduce false signals
|
|
3. Comprehensive risk control: ATR dynamic stop-loss allows profits to develop while effectively controlling risk
|
|
4. Good visualization: Market states are marked with background colors for intuitive understanding
|
|
5. Excellent performance on higher timeframes: Shows a profit factor of 2.159 with 10.71% net profit on daily timeframe
|
|
|
|
#### Strategy Risks
|
|
1. Low win rate: Win rates below 40% across all timeframes, requiring strong psychological resilience
|
|
2. Overtrading on lower timeframes: Executed 430 trades on 4-hour timeframe with lower efficiency
|
|
3. Signal lag: Multiple indicator verification may cause missed market opportunities
|
|
4. Complex parameter optimization: Multiple indicator combinations increase strategy optimization complexity
|
|
|
|
#### Strategy Optimization Directions
|
|
1. Signal filtering optimization: Adjust indicator thresholds to improve win rate
|
|
2. Timeframe adaptation: Recommended for daily and higher timeframes, with parameters adjustable to different market characteristics
|
|
3. Stop-loss optimization: Consider dynamic adjustment of ATR multiplier based on market conditions
|
|
4. Entry timing optimization: Add volume confirmation or price pattern confirmation to improve entry accuracy
|
|
5. Position management optimization: Design dynamic position management system based on signal strength
|
|
|
|
#### Summary
|
|
This strategy is a well-designed, logically clear comprehensive trading system that achieves intelligent market state identification and precise capture of trading opportunities through multiple indicator coordination. While there are some issues on lower timeframes, it performs excellently on higher timeframes like daily. Traders are recommended to focus on daily timeframe signals when using it in live trading and adjust parameters according to their risk tolerance. Through continuous optimization and adjustment, this strategy has the potential to provide stable profit opportunities for traders.[/trans]
|
|
|
|
|
|
|
|
> Source (PineScript)
|
|
|
|
``` pinescript
|
|
/*backtest
|
|
start: 2024-08-01 00:00:00
|
|
end: 2025-02-18 08:00:00
|
|
period: 2d
|
|
basePeriod: 2d
|
|
exchanges: [{"eid":"Binance","currency":"ETH_USDT"}]
|
|
*/
|
|
|
|
// This Pine Script™ code is subject to the terms of the Mozilla Public License 2.0 at https://mozilla.org/MPL/2.0/
|
|
// © FIWB
|
|
|
|
//@version=6
|
|
strategy("Refined Ichimoku with MACD and RSI Strategy", overlay=true)
|
|
|
|
// Inputs for Ichimoku Cloud
|
|
conversionLength = input.int(9, title="Conversion Line Length", group="Ichimoku Settings")
|
|
baseLength = input.int(26, title="Base Line Length", group="Ichimoku Settings")
|
|
laggingSpanLength = input.int(52, title="Lagging Span Length", group="Ichimoku Settings")
|
|
displacement = input.int(26, title="Displacement", group="Ichimoku Settings")
|
|
|
|
// Inputs for MACD
|
|
macdFastLength = input.int(12, title="MACD Fast Length", group="MACD Settings")
|
|
macdSlowLength = input.int(26, title="MACD Slow Length", group="MACD Settings")
|
|
macdSignalLength = input.int(9, title="MACD Signal Length", group="MACD Settings")
|
|
|
|
// Inputs for RSI/Stochastic RSI
|
|
rsiLength = input.int(14, title="RSI Length", group="Momentum Indicators")
|
|
stochRsiLength = input.int(14, title="Stochastic RSI Length", group="Momentum Indicators")
|
|
stochRsiK = input.int(3, title="%K Smoothing", group="Momentum Indicators")
|
|
stochRsiD = input.int(3, title="%D Smoothing", group="Momentum Indicators")
|
|
|
|
// Inputs for ATR
|
|
atrLength = input.int(14, title="ATR Length", group="Risk Management")
|
|
atrMultiplier = input.float(2.0, title="ATR Multiplier", group="Risk Management")
|
|
|
|
// Ichimoku Cloud Calculation
|
|
conversionLine = (ta.highest(high, conversionLength) + ta.lowest(low, conversionLength)) / 2
|
|
baseLine = (ta.highest(high, baseLength) + ta.lowest(low, baseLength)) / 2
|
|
leadingSpanA = (conversionLine + baseLine) / 2
|
|
leadingSpanB = (ta.highest(high, laggingSpanLength) + ta.lowest(low, laggingSpanLength)) / 2
|
|
|
|
// Market Regime Detection Using Ichimoku Cloud
|
|
priceAboveCloud = close >= leadingSpanA and close >= leadingSpanB
|
|
priceBelowCloud = close <= leadingSpanA and close <= leadingSpanB
|
|
priceNearCloud = close > leadingSpanB and close < leadingSpanA
|
|
|
|
trendingMarket = priceAboveCloud or priceBelowCloud
|
|
rangeBoundMarket = priceNearCloud
|
|
|
|
// MACD Calculation
|
|
macdLine = ta.ema(close, macdFastLength) - ta.ema(close, macdSlowLength)
|
|
macdSignalLine = ta.sma(macdLine, macdSignalLength)
|
|
macdHistogram = macdLine - macdSignalLine
|
|
|
|
// RSI Calculation
|
|
rsiValue = ta.rsi(close, rsiLength)
|
|
|
|
// Stochastic RSI Calculation
|
|
stochRsiKValue = ta.sma(ta.stoch(close, high, low, stochRsiLength), stochRsiK)
|
|
stochRsiDValue = ta.sma(stochRsiKValue, stochRsiD)
|
|
|
|
// Entry Conditions with Tightened Filters
|
|
trendLongCondition = trendingMarket and priceAboveCloud and rsiValue > 55 and macdHistogram > 0 and stochRsiKValue > stochRsiDValue
|
|
trendShortCondition = trendingMarket and priceBelowCloud and rsiValue < 45 and macdHistogram < 0 and stochRsiKValue < stochRsiDValue
|
|
|
|
rangeLongCondition = rangeBoundMarket and rsiValue < 30 and stochRsiKValue < 20
|
|
rangeShortCondition = rangeBoundMarket and rsiValue > 70 and stochRsiKValue > 80
|
|
|
|
// Risk Management: Stop-Loss Based on ATR
|
|
atrValue = ta.atr(atrLength)
|
|
longStopLoss = low - atrMultiplier * atrValue
|
|
shortStopLoss = high + atrMultiplier * atrValue
|
|
|
|
// Strategy Execution: Entries and Exits
|
|
if trendLongCondition
|
|
strategy.entry("Trend Long", strategy.long)
|
|
strategy.exit("Exit Trend Long", from_entry="Trend Long", stop=longStopLoss)
|
|
|
|
if trendShortCondition
|
|
strategy.entry("Trend Short", strategy.short)
|
|
strategy.exit("Exit Trend Short", from_entry="Trend Short", stop=shortStopLoss)
|
|
|
|
if rangeLongCondition
|
|
strategy.entry("Range Long", strategy.long)
|
|
strategy.exit("Exit Range Long", from_entry="Range Long", stop=longStopLoss)
|
|
|
|
if rangeShortCondition
|
|
strategy.entry("Range Short", strategy.short)
|
|
strategy.exit("Exit Range Short", from_entry="Range Short", stop=shortStopLoss)
|
|
|
|
// Visualization: Highlight Market Regimes on Chart Background
|
|
bgcolor(trendingMarket ? color.new(color.green, 90) : na)
|
|
bgcolor(rangeBoundMarket ? color.new(color.red, 90) : na)
|
|
|
|
// Plot Ichimoku Cloud for Visualization
|
|
plot(leadingSpanA, color=color.new(color.green, 80), title="Leading Span A")
|
|
plot(leadingSpanB, color=color.new(color.red, 80), title="Leading Span B")
|
|
|
|
```
|
|
|
|
> Detail
|
|
|
|
https://www.fmz.com/strategy/482841
|
|
|
|
> Last Modified
|
|
|
|
2025-02-20 14:48:41
|