
207 lines
11 KiB
Markdown
207 lines
11 KiB
Markdown
|
||
> Name
|
||
|
||
动态均值回归与动量策略-Dynamic-Mean-Reversion-and-Momentum-Strategy
|
||
|
||
> Author
|
||
|
||
ChaoZhang
|
||
|
||
> Strategy Description
|
||
|
||
|
||
|
||
[trans]
|
||
#### 概述
|
||
|
||
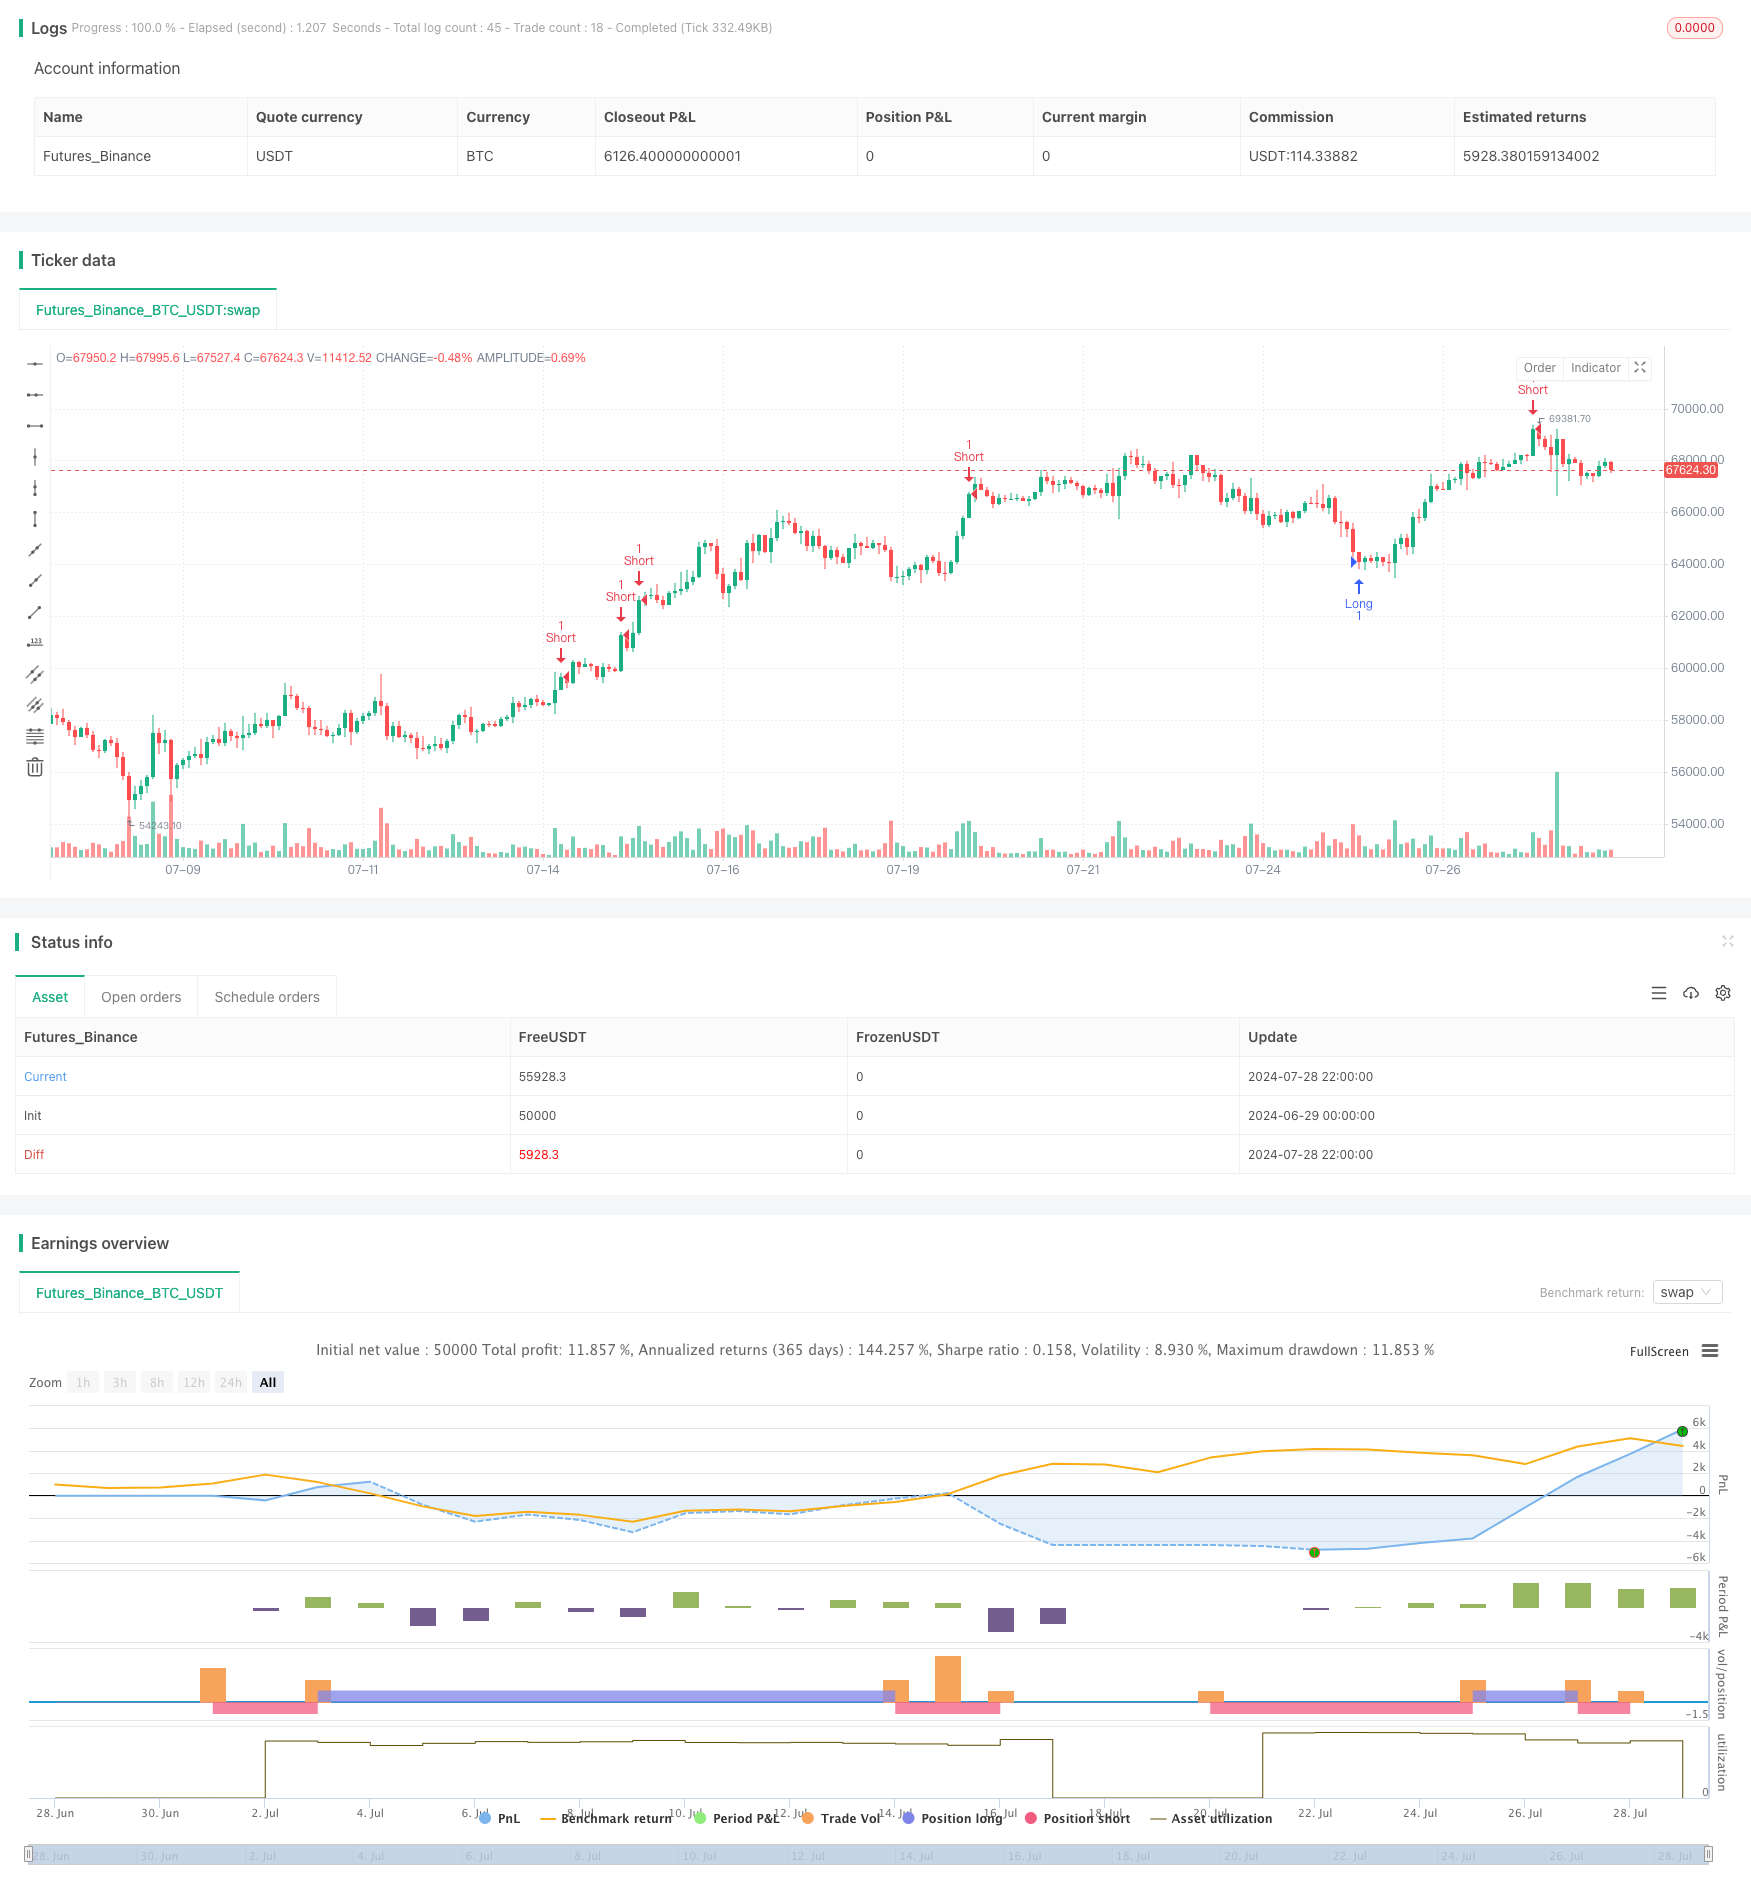
动态均值回归与动量策略是一种结合了均值回归和动量概念的量化交易策略。该策略利用相对强弱指标(RSI)、布林带(Bollinger Bands)和平均真实范围(ATR)等技术指标来识别市场的超买超卖状态,捕捉价格回归均值的机会,同时考虑市场动量,以实现更加稳健的交易决策。策略还incorporates动态的止损和获利水平,以适应市场波动性的变化。
|
||
|
||
#### 策略原理
|
||
|
||
1. 均值回归原理:策略使用布林带来识别价格偏离均值的程度。当价格触及下轨且RSI处于超卖区域时,视为做多信号;当价格触及上轨且RSI处于超买区域时,视为做空信号。
|
||
|
||
2. 动量分析:通过RSI指标来评估价格动量。RSI低于30被视为超卖,高于70被视为超买。这一设置有助于确认价格反转的可能性。
|
||
|
||
3. 动态风险管理:策略使用ATR来设置动态的止损和获利水平。这种方法使得策略能够根据市场波动性的变化来调整风险敞口。
|
||
|
||
4. 进场和出场逻辑:
|
||
- 做多条件:价格低于布林带下轨且RSI低于30
|
||
- 做空条件:价格高于布林带上轨且RSI高于70
|
||
- 止损设置:入场价格加减2倍ATR
|
||
- 获利设置:入场价格加减2倍ATR
|
||
|
||
#### 策略优势
|
||
|
||
1. 多重确认机制:结合布林带和RSI进行交易信号确认,降低了假突破的风险。
|
||
|
||
2. 适应市场波动:通过ATR动态调整止损和获利水平,使策略能够更好地适应不同市场条件。
|
||
|
||
3. 均衡的交易视角:同时考虑均值回归和动量因素,提供了更全面的市场分析。
|
||
|
||
4. 风险管理集成:内置的止损和获利机制有助于控制每笔交易的风险。
|
||
|
||
5. 灵活性:策略参数可根据不同市场和时间框架进行优化调整。
|
||
|
||
#### 策略风险
|
||
|
||
1. 假信号风险:在横盘市场中,可能会产生频繁的假信号,导致过度交易。
|
||
|
||
2. 趋势市场表现:在强趋势市场中,均值回归策略可能会频繁遭遇止损。
|
||
|
||
3. 参数敏感性:策略性能可能对RSI、布林带和ATR的参数设置高度敏感。
|
||
|
||
4. 滑点和流动性风险:在波动较大或流动性较差的市场中,可能面临严重的滑点问题。
|
||
|
||
5. 系统性风险:完全依赖技术指标可能忽视基本面因素对市场的影响。
|
||
|
||
#### 策略优化方向
|
||
|
||
1. 引入趋势过滤器:如添加移动平均线或MACD指标,以识别大趋势方向,避免在强趋势中逆势交易。
|
||
|
||
2. 优化参数选择:通过回测不同时间周期和市场环境,寻找最优参数组合。
|
||
|
||
3. 引入成交量分析:整合成交量指标,如OBV或CMF,以增强信号可靠性。
|
||
|
||
4. 改进风险管理:考虑使用百分比风险模型,而不是固定的ATR倍数,以更好地控制每笔交易的风险。
|
||
|
||
5. 添加时间过滤:引入交易时间窗口限制,避开波动性较大或流动性较差的时段。
|
||
|
||
6. 考虑基本面因素:在策略中加入对重要经济数据或事件的考量,提高策略的全面性。
|
||
|
||
#### 总结
|
||
|
||
动态均值回归与动量策略是一种结合了多个技术分析概念的综合交易系统。通过布林带、RSI和ATR的协同作用,该策略旨在捕捉价格波动中的交易机会,同时提供动态的风险管理机制。虽然策略展现出了一定的优势,如信号确认的可靠性和对市场波动的适应性,但仍存在一些潜在风险,如假信号和参数敏感性等问题。
|
||
|
||
为了进一步提升策略的稳健性和性能,可以考虑引入趋势过滤器、优化参数选择、加入成交量分析等改进措施。此外,结合基本面分析和更精细的风险管理方法,有助于策略在不同市场环境下保持竞争力。
|
||
|
||
总的来说,这个策略为交易者提供了一个有趣的起点,通过持续的优化和调整,有潜力成为一个可靠的交易系统。然而,在实际应用中,交易者需要谨慎评估策略在不同市场条件下的表现,并根据个人风险承受能力和交易目标进行适当的调整。
|
||
|
||
||
|
||
|
||
#### Overview
|
||
|
||
The Dynamic Mean Reversion and Momentum Strategy is a quantitative trading approach that combines mean reversion and momentum concepts. This strategy utilizes technical indicators such as the Relative Strength Index (RSI), Bollinger Bands (BB), and Average True Range (ATR) to identify overbought and oversold market conditions, capture opportunities for price reversion to the mean, while also considering market momentum to make more robust trading decisions. The strategy also incorporates dynamic stop-loss and take-profit levels to adapt to changes in market volatility.
|
||
|
||
#### Strategy Principles
|
||
|
||
1. Mean Reversion Principle: The strategy uses Bollinger Bands to identify the degree of price deviation from the mean. A long signal is generated when the price touches the lower band and the RSI is in the oversold zone; a short signal is generated when the price touches the upper band and the RSI is in the overbought zone.
|
||
|
||
2. Momentum Analysis: The RSI indicator is used to assess price momentum. An RSI below 30 is considered oversold, while above 70 is considered overbought. This setup helps confirm the likelihood of price reversals.
|
||
|
||
3. Dynamic Risk Management: The strategy employs ATR to set dynamic stop-loss and take-profit levels. This approach allows the strategy to adjust risk exposure based on changes in market volatility.
|
||
|
||
4. Entry and Exit Logic:
|
||
- Long Condition: Price below the lower Bollinger Band and RSI below 30
|
||
- Short Condition: Price above the upper Bollinger Band and RSI above 70
|
||
- Stop-Loss Setting: Entry price plus or minus 2 times ATR
|
||
- Take-Profit Setting: Entry price plus or minus 2 times ATR
|
||
|
||
#### Strategy Advantages
|
||
|
||
1. Multiple Confirmation Mechanism: Combining Bollinger Bands and RSI for trade signal confirmation reduces the risk of false breakouts.
|
||
|
||
2. Adaptation to Market Volatility: Dynamic adjustment of stop-loss and take-profit levels through ATR enables the strategy to better adapt to different market conditions.
|
||
|
||
3. Balanced Trading Perspective: Considering both mean reversion and momentum factors provides a more comprehensive market analysis.
|
||
|
||
4. Integrated Risk Management: Built-in stop-loss and take-profit mechanisms help control risk for each trade.
|
||
|
||
5. Flexibility: Strategy parameters can be optimized and adjusted for different markets and time frames.
|
||
|
||
#### Strategy Risks
|
||
|
||
1. False Signal Risk: In ranging markets, frequent false signals may lead to overtrading.
|
||
|
||
2. Performance in Trending Markets: Mean reversion strategies may frequently encounter stop-losses in strong trending markets.
|
||
|
||
3. Parameter Sensitivity: Strategy performance may be highly sensitive to RSI, Bollinger Bands, and ATR parameter settings.
|
||
|
||
4. Slippage and Liquidity Risk: In highly volatile or illiquid markets, significant slippage issues may arise.
|
||
|
||
5. Systematic Risk: Relying solely on technical indicators may overlook the impact of fundamental factors on the market.
|
||
|
||
#### Strategy Optimization Directions
|
||
|
||
1. Introduce Trend Filters: Add indicators like moving averages or MACD to identify broader trend directions and avoid counter-trend trading in strong trends.
|
||
|
||
2. Optimize Parameter Selection: Conduct backtests across different time periods and market environments to find optimal parameter combinations.
|
||
|
||
3. Incorporate Volume Analysis: Integrate volume indicators such as OBV or CMF to enhance signal reliability.
|
||
|
||
4. Improve Risk Management: Consider using a percentage risk model instead of fixed ATR multiples to better control risk for each trade.
|
||
|
||
5. Add Time Filters: Introduce trading time window restrictions to avoid periods of high volatility or low liquidity.
|
||
|
||
6. Consider Fundamental Factors: Incorporate consideration of important economic data or events into the strategy to improve comprehensiveness.
|
||
|
||
#### Conclusion
|
||
|
||
The Dynamic Mean Reversion and Momentum Strategy is a comprehensive trading system that combines multiple technical analysis concepts. Through the synergy of Bollinger Bands, RSI, and ATR, this strategy aims to capture trading opportunities in price fluctuations while providing dynamic risk management mechanisms. While the strategy demonstrates certain advantages, such as reliability in signal confirmation and adaptability to market volatility, it still faces potential risks like false signals and parameter sensitivity.
|
||
|
||
To further enhance the strategy's robustness and performance, considerations can be made to introduce trend filters, optimize parameter selection, and incorporate volume analysis. Additionally, integrating fundamental analysis and more refined risk management methods can help the strategy maintain competitiveness across different market environments.
|
||
|
||
Overall, this strategy provides traders with an interesting starting point that has the potential to evolve into a reliable trading system through continuous optimization and adjustment. However, in practical application, traders need to carefully evaluate the strategy's performance under different market conditions and make appropriate adjustments based on individual risk tolerance and trading objectives.
|
||
|
||
[/trans]
|
||
|
||
|
||
|
||
> Source (PineScript)
|
||
|
||
``` pinescript
|
||
/*backtest
|
||
start: 2024-06-29 00:00:00
|
||
end: 2024-07-29 00:00:00
|
||
period: 2h
|
||
basePeriod: 15m
|
||
exchanges: [{"eid":"Futures_Binance","currency":"BTC_USDT"}]
|
||
*/
|
||
|
||
// This Pine Script™ code is subject to the terms of the Mozilla Public License 2.0 at https://mozilla.org/MPL/2.0/
|
||
// © baranbay
|
||
|
||
//@version=5
|
||
strategy("BARONES - Mean Reversion and Momentum Strategy", overlay=true)
|
||
|
||
// İndikatör parametreleri
|
||
rsi_length = input.int(14, title="RSI Length")
|
||
rsi_overbought = input.int(70, title="RSI Overbought Level")
|
||
rsi_oversold = input.int(30, title="RSI Oversold Level")
|
||
bb_length = input.int(20, title="Bollinger Bands Length")
|
||
bb_mult = input.float(2.0, title="Bollinger Bands Multiplier")
|
||
|
||
// RSI ve Bollinger Bantları hesaplama
|
||
rsi = ta.rsi(close, rsi_length)
|
||
basis = ta.sma(close, bb_length)
|
||
dev = bb_mult * ta.stdev(close, bb_length)
|
||
upper = basis + dev
|
||
lower = basis - dev
|
||
|
||
// Giriş ve çıkış sinyalleri
|
||
if (close < lower and rsi < rsi_oversold)
|
||
strategy.entry("Long", strategy.long)
|
||
if (close > upper and rsi > rsi_overbought)
|
||
strategy.entry("Short", strategy.short)
|
||
|
||
// Dinamik stop-loss seviyeleri (ATR kullanarak)
|
||
atr_length = input.int(14, title="ATR Length")
|
||
atr = ta.atr(atr_length)
|
||
stop_loss_long = close - 2 * atr
|
||
take_profit_long = close + 2 * atr
|
||
stop_loss_short = close + 2 * atr
|
||
take_profit_short = close - 2 * atr
|
||
|
||
// Kar ve zarar durdurma seviyeleri
|
||
strategy.exit("Take Profit/Stop Loss", "Long", limit=take_profit_long, stop=stop_loss_long)
|
||
strategy.exit("Take Profit/Stop Loss", "Short", limit=take_profit_short, stop=stop_loss_short)
|
||
|
||
```
|
||
|
||
> Detail
|
||
|
||
https://www.fmz.com/strategy/458145
|
||
|
||
> Last Modified
|
||
|
||
2024-07-30 12:12:27
|