
9.0 KiB
Name
动态区间突破策略Dynamic-Range-Breakout-Strategy
Author
ChaoZhang
Strategy Description
 [trans]
概述
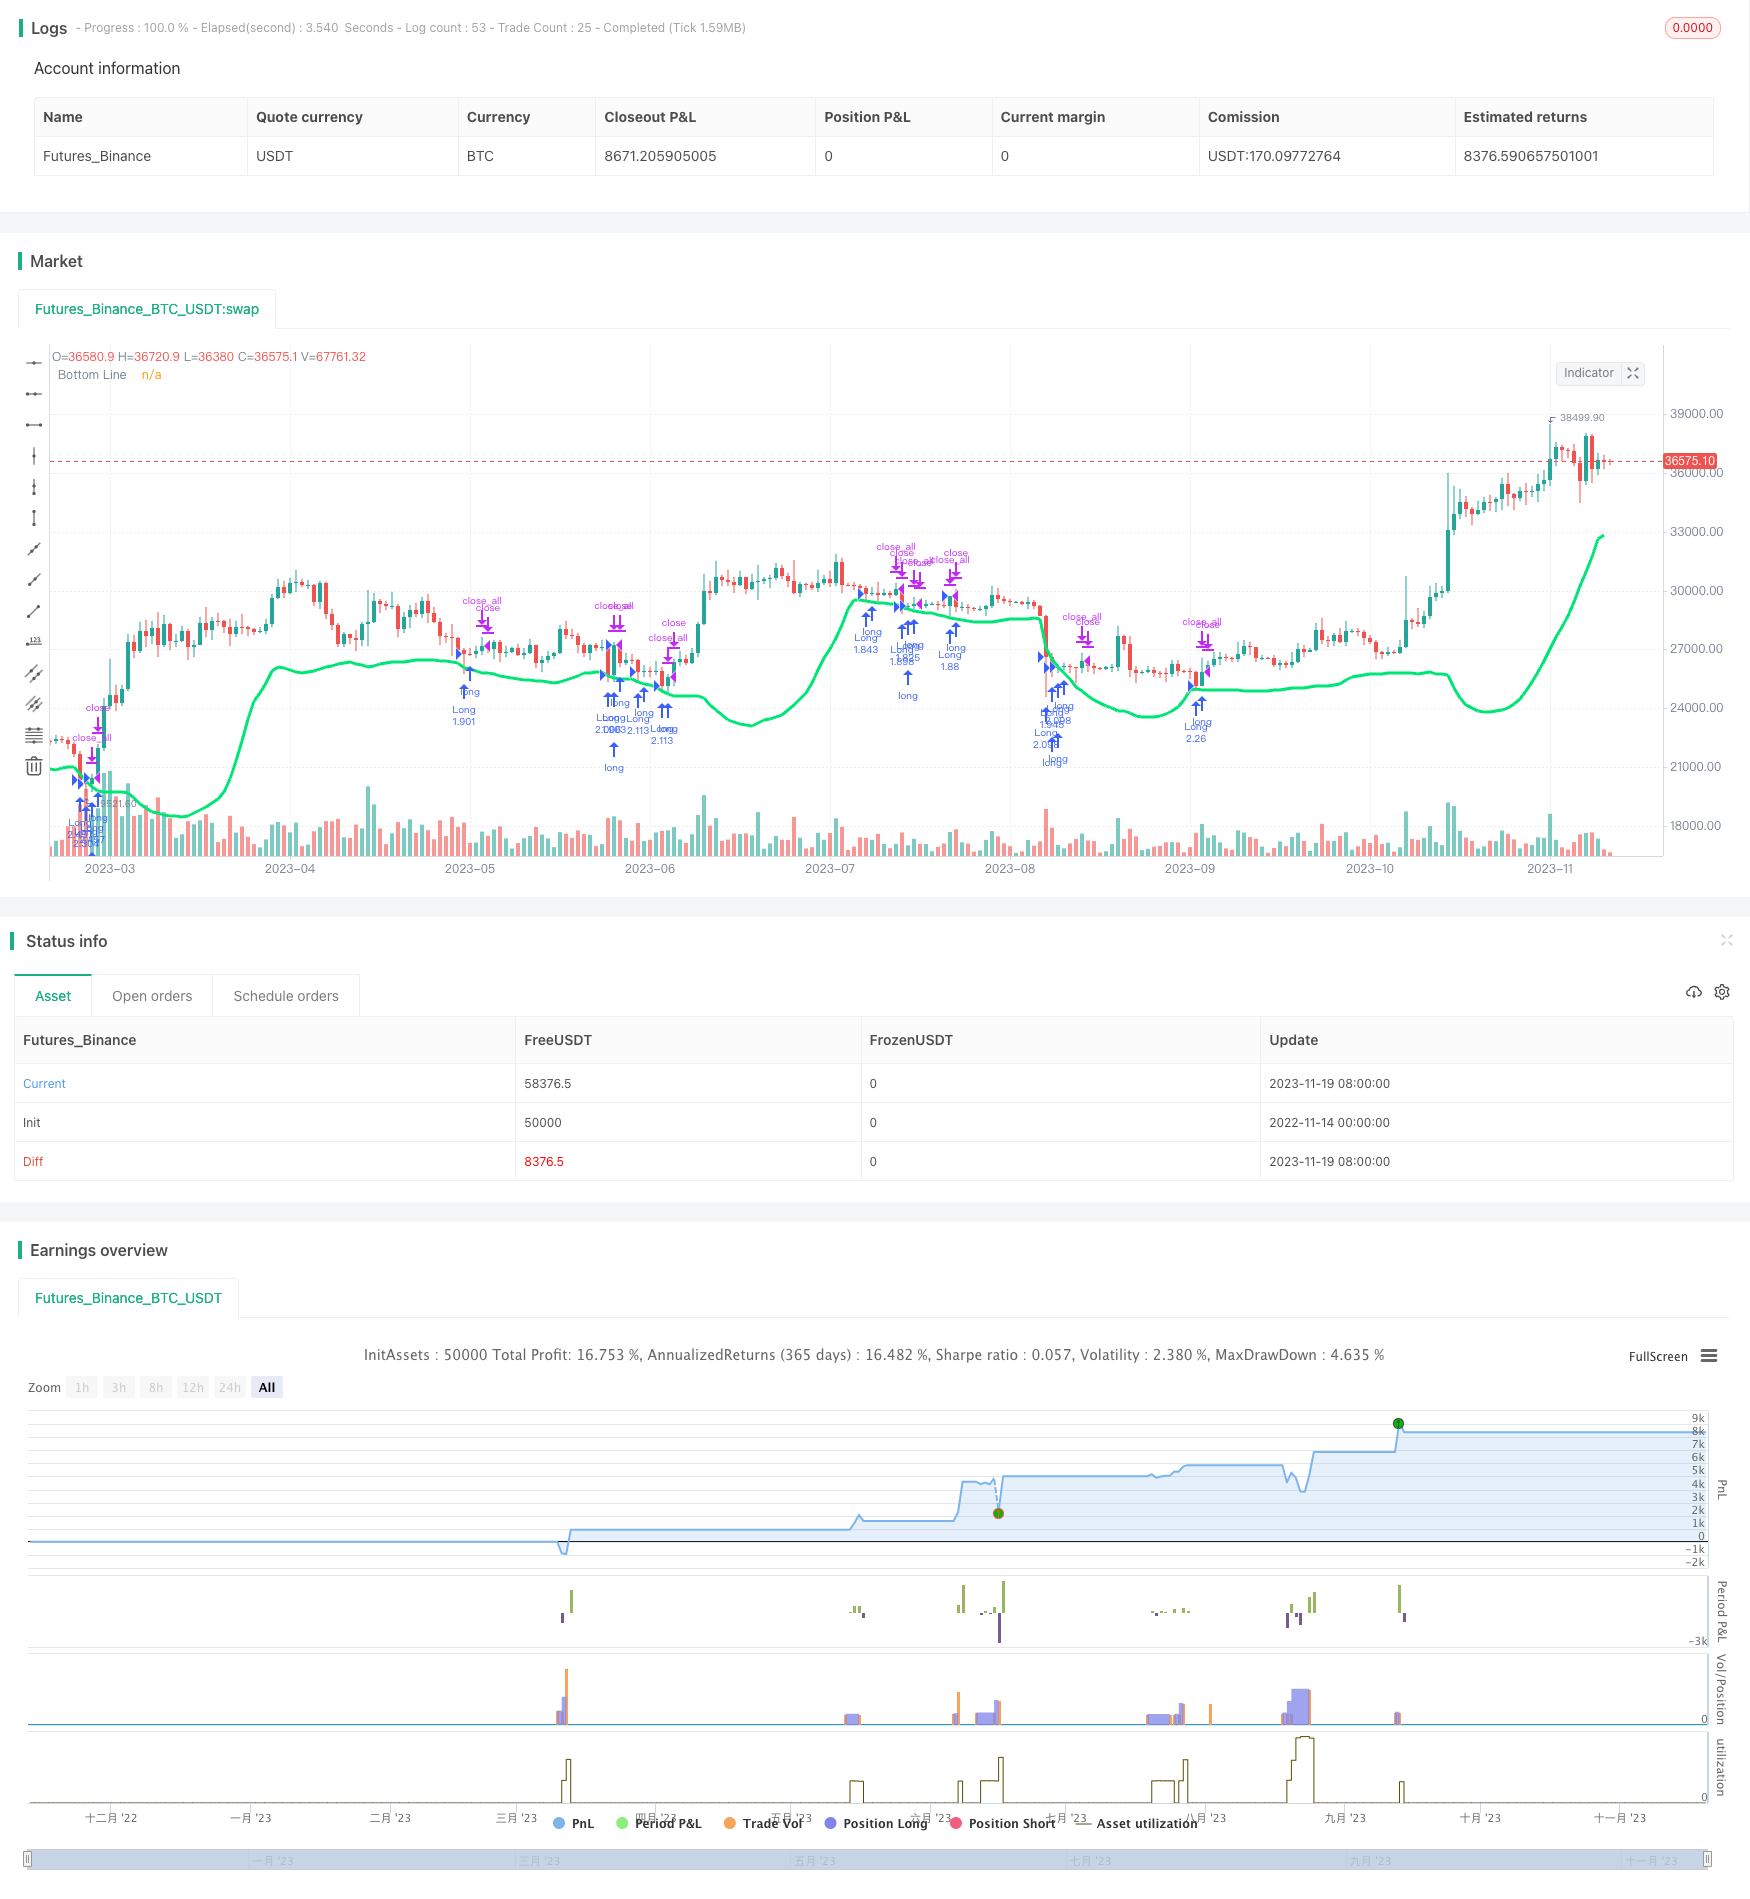
本策略基于布林带指标设计了一个动态的突破交易策略。它结合K线实体过滤和色彩过滤的条件,在布林带下轨附近寻找突破 entry 机会。 Exit 则基于实体过滤。该策略自动管理仓位数量和风险。
策略原理
指标计算
首先,根据低点计算布林带的基线和下轨:
src = low
basis = sma(src, length)
dev = mult * stdev(src, length)
lower = basis - dev
其中 src 为低点,length 为计算周期,basis 为均线,dev 为 standard deviation,lower 为下轨。
mult 一般设为 2,代表下轨是一个标准差。
过滤条件
策略加入两个过滤条件:
K线实体过滤 使用实体大小 nbody 和其均值 abody 判断,只有当 nbody 大于 abody 一半时才产生交易信号。
色彩过滤 K线收阳(close > open)时不做多单。这是避免hbox 头部的假突破。
交易信号
当满足以下条件时产生做多信号:
low < lower  // 价格突破下轨
close < open or usecol == false // 色彩过滤
nbody > abody / 2 or usebod == false // 实体过滤
当实体大小再次大于均值一半时,产生平仓:
close > open and nbody > abody / 2
仓位管理
策略自动计算交易数量,实现指数增长:
lot = strategy.position_size == 0 ? strategy.equity / close * capital / 100 : lot[1]
风险控制
加入年、月、日条件,限制只在指定日期范围内交易:
when=(time > timestamp(fromyear, frommonth, fromday, 00, 00) and time < timestamp(toyear, tomonth, today, 23, 59))
策略优势
动态交易区间
布林带下轨是一个动态的支持区域,能够捕捉市场趋势后的反弹机会。
双重过滤机制
结合 K 线实体和色彩判断,有效过滤假突破。
自动仓位管理
仓位按指数增长到 100%,自动管理风险。
指定交易时间范围
设置日期范围,降低特定时间的市场波动率带来的风险。
策略风险
空仓时间过长
当市场长期牛市时,布林带中轨和上轨快速上移,容易空仓时间过长。
解决方法
可以结合趋势指标判断,在中长线判断为牛市时暂停策略,避免空仓过长。
突破失败
下轨突破后可能出现回调和重试下轨的情况。
解决方法
加入止损线,在支撑下方一定比例止损。或加入再试失败的判断逻辑,快速止损。
策略优化
增加止损逻辑
根据回测数据情况,设定合理的支持下方止损位置。
优化过滤条件参数
调整实体过滤的 abody 周期, COLOR 过滤的使用等。找到最优参数组合。
结合趋势判断
增加中长线趋势判断,在判断为牛市时停止策略运行。减少空仓时间。
总结
本策略结合布林带支持,设计了实体过滤、色彩过滤与突破交易的策略逻辑来寻找高概率的反弹机会。实际应用中,可以根据回测结果不断优化参数,并加入止损与趋势判断模块来控制风险,从而获得较好的绩效。 ||
Overview
This strategy is designed based on the Bollinger Bands indicator to create a dynamic breakout trading strategy. It combines the conditions of candle body filter and color filter to look for breakout entry opportunities around the Bollinger lower band. Exits are based on body filter. The strategy automatically manages position sizing and risk.
Strategy Logic
Indicator Calculation
First, calculate the base line and lower band of Bollinger Bands based on low price:
src = low
basis = sma(src, length)
dev = mult * stdev(src, length)
lower = basis - dev
Where src is the low price, length is the calculation period, basis is the moving average, dev is the standard deviation, and lower is the lower band.
mult is usually set to 2, meaning the lower band is one standard deviation away.
Filter Conditions
The strategy incorporates two filter conditions:
Candle Body Filter Use the body size nbody and its mean abody to determine, only generate trading signal when nbody is greater than half of abody.
Color Filter
Do not long when candle closes positive (close > open). This avoids false breakout at the head of hbox.
Trading Signals
Generate long signal when below conditions meet:
low < lower // price breaks lower band
close < open or usecol == false // color filter
nbody > abody / 2 or usebod == false // body filter
When body size exceeds half of the mean again, close position:
close > open and nbody > abody / 2
Position Sizing
Strategy calculates trade size automatically for exponential growth of position:
lot = strategy.position_size == 0 ? strategy.equity / close * capital / 100 : lot[1]
Risk Control
Add constraints on year, month and date to limit trading only in specific date range:
when=(time > timestamp(fromyear, frommonth, fromday, 00, 00) and time < timestamp(toyear, tomonth, today, 23, 59))
Advantages
Dynamic Trading Range
Bollinger lower band provides a dynamic support area to capture retracements after trends.
Dual Filter
Combination of candle body and color filters avoids false breakouts effectively.
Automatic Position Sizing
Position sizes up exponentially to 100% managing risk automatically.
Date Range
Setting a date range lowers risk associated with market volatility in specific periods.
Risks
Prolonged Drawdown
When strong uptrend, BB middle and upper bands may shift up quickly, causing prolonged drawdown.
Solutions
Combine with trend indicators, stop strategy when judged as bull market to avoid prolonged drawdown.
Failed Breakout
Breakout may fail with pullback and retest of lower band.
Solutions
Add stop loss below support level. Or add logic to detect failed retest for quick stop loss.
Enhancements
Add Stop Loss
Optimize stop loss below support based on backtest results.
Optimize Parameters
Fine tune body filter abody period, COLOR filter etc to find optimum.
Add Trend Filter
Stop strategy when judged as bull market. Reduce drawdown time.
Conclusion
This strategy combines BB support, body filter, color filter and breakout logic to capture high probability retracements. In practice, parameters can be optimized based on backtest, with stop loss and trend filter added to control risks for improved performance.
[/trans]
Strategy Arguments
| Argument | Default | Description |
|---|---|---|
| v_input_1 | 100 | Capital, % |
| v_input_2 | 25 | BB Period |
| v_input_3 | false | Use Body-Filter |
| v_input_4 | false | Use Color-Filter |
| v_input_5 | false | Show Arrows |
| v_input_6 | 1900 | From Year |
| v_input_7 | 2100 | To Year |
| v_input_8 | true | From Month |
| v_input_9 | 12 | To Month |
| v_input_10 | true | From day |
| v_input_11 | 31 | To day |
Source (PineScript)
/*backtest
start: 2022-11-14 00:00:00
end: 2023-11-20 00:00:00
period: 1d
basePeriod: 1h
exchanges: [{"eid":"Futures_Binance","currency":"BTC_USDT"}]
*/

//Noro
//2018

//@version=2
strategy(title = "Noro's Wizard Strategy v1.0", shorttitle = "Wizard str 1.0", overlay = true, default_qty_type = strategy.percent_of_equity, default_qty_value = 100, pyramiding = 10)

//Settings
capital = input(100, defval = 100, minval = 1, maxval = 10000, title = "Capital, %")
length = input(25, defval = 25, minval = 1, maxval = 200, title = "BB Period")
usebod = input(false, defval = false, title = "Use Body-Filter")
usecol = input(false, defval = false, title = "Use Color-Filter")
showar = input(false, defval = false, title = "Show Arrows")
fromyear = input(1900, defval = 1900, minval = 1900, maxval = 2100, title = "From Year")
toyear = input(2100, defval = 2100, minval = 1900, maxval = 2100, title = "To Year")
frommonth = input(01, defval = 01, minval = 01, maxval = 12, title = "From Month")
tomonth = input(12, defval = 12, minval = 01, maxval = 12, title = "To Month")
fromday = input(01, defval = 01, minval = 01, maxval = 31, title = "From day")
today = input(31, defval = 31, minval = 01, maxval = 31, title = "To day")

//Bollinger
src = low
mult = 2
basis = sma(src, length)
dev = mult * stdev(src, length)
lower = basis - dev
plot(lower, color = lime, linewidth = 3, title="Bottom Line")

//Body Filter
nbody = abs(close - open)
abody = sma(nbody, 10)
body = nbody > abody / 2 or usebod == false

//Signals
up1 = low < lower and (close < open or usecol == false) and body
exit = close > open and nbody > abody / 2

//Arrows
needar = up1 and showar
plotarrow(needar ? 1 : na)

//Trading
lot = strategy.position_size == 0 ? strategy.equity / close * capital / 100 : lot[1]

if up1
    if strategy.position_size < 0
        strategy.close_all()

    strategy.entry("Long", strategy.long, lot, when=(time > timestamp(fromyear, frommonth, fromday, 00, 00) and time < timestamp(toyear, tomonth, today, 23, 59)))

if time > timestamp(toyear, tomonth, today, 23, 59) or exit
    strategy.close_all()
Detail
https://www.fmz.com/strategy/432786
Last Modified
2023-12-01 15:00:31