
16 KiB
Name
动态云层突破量化交易策略-Dynamic-Kumo-Breakout-Quantitative-Trading-Strategy
Author
ianzeng123
Strategy Description
[trans]
动态云层突破量化交易策略
概述
动态云层突破量化交易策略是一种基于市场技术分析的量化交易系统,核心依托于日本蜡烛图技术中的"一目均衡"(Ichimoku)指标体系,特别聚焦于云层(Kumo)突破信号。该策略通过监测价格与云层上边界的突破关系,识别潜在的强势突破趋势,同时结合移动平均线交叉确认交易信号,形成一套完整的趋势跟踪交易系统。策略设计目的在于捕捉市场中具有持续性的突破行情,尤其适用于波动明显的市场环境。
策略原理
该策略的核心原理建立在一目均衡指标的云层结构和简单移动平均线的交叉逻辑上。具体实现过程如下:
-
一目均衡指标计算:
- 转换线(Tenkan-Sen):计算过去9个周期内的最高价和最低价的平均值
- 基准线(Kijun-Sen):计算过去26个周期内的最高价和最低价的平均值
- 先行带A(Senkou Span A):转换线和基准线的平均值
- 先行带B(Senkou Span B):计算过去52个周期内的最高价和最低价的平均值
- 云层上边界(Cloud Top):先行带A和先行带B中的较大值
- 云层下边界(Cloud Bottom):先行带A和先行带B中的较小值
-
信号生成逻辑:
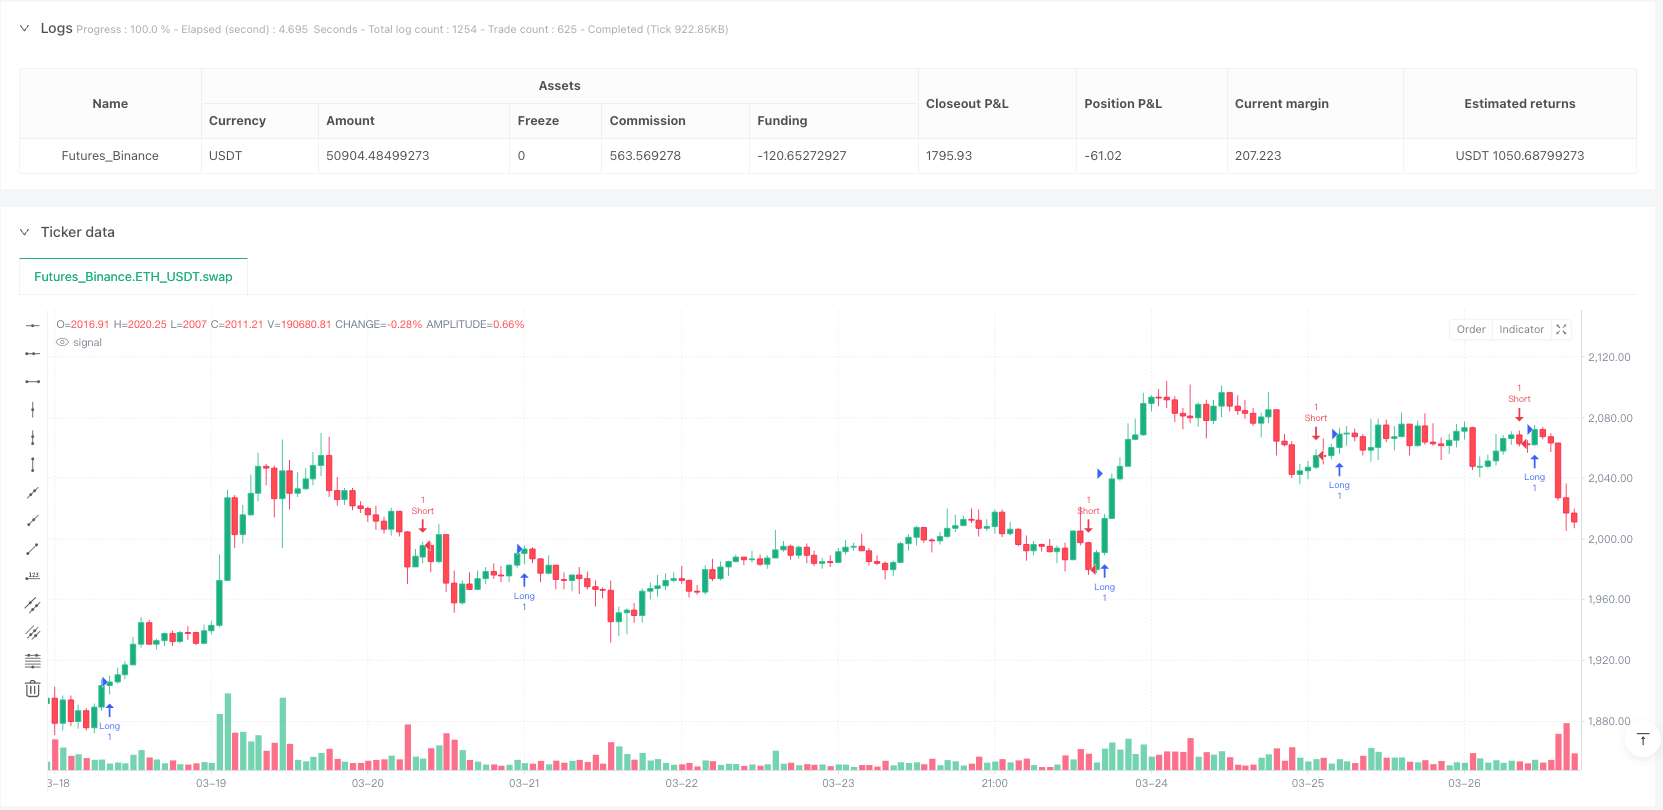
- 多头信号:收盘价向上突破云层上边界(close crossover cloudTop)
- 空头信号:14周期简单移动平均线下穿28周期简单移动平均线(SMA(14) crossunder SMA(28))
- 多头平仓信号:收盘价向下突破云层下边界(close crossunder cloudBottom)
策略实际上结合了两种不同的信号系统:一目均衡云层突破用于多头入场和平仓,而简单移动平均线交叉用于空头入场。这种组合设计旨在充分利用云层作为支撑和阻力的特性,同时通过移动平均线交叉提供额外的趋势确认。
策略优势
-
趋势确认的多重维度:通过云层突破和移动平均线交叉两种不同的指标体系来确认趋势,降低了假突破的风险。
-
动态支撑阻力识别:一目均衡的云层结构提供了动态的支撑与阻力区域,相比固定数值的支撑阻力更能适应市场变化。
-
趋势强度评估:云层的厚度和价格突破云层的决定性程度可以间接反映趋势的强度,帮助交易者评估潜在的趋势持续性。
-
视觉直观性:策略的信号在图表上表现直观,云层形态变化和价格突破点清晰可见,便于交易者理解和操作。
-
适应性强:通过参数调整(如Tenkan-Sen、Kijun-Sen和Senkou Span B的周期长度),策略可以适应不同市场环境和时间框架。
策略风险
-
云层区域内波动风险:当价格在云层区域内波动时,可能产生频繁的交叉信号,导致过度交易和不必要的交易成本。
-
信号滞后性:由于一目均衡指标包含较长周期的计算(如52周期的Senkou Span B),信号可能具有一定的滞后性,在快速反转市场中可能错过最佳入场点。
-
参数敏感性:策略对参数设置较为敏感,不同的参数组合可能产生显著不同的交易结果,需要针对具体交易品种和市场环境进行优化。
-
单一时间框架局限性:代码中未考虑多时间框架分析,可能导致在较大趋势背景下产生与主趋势相反的错误信号。
-
信号冲突处理不足:当云层突破信号与移动平均线交叉信号产生冲突时,代码中未提供明确的处理机制,可能导致策略行为不一致。
解决方法:
- 增加额外的过滤条件,如交易量确认、趋势强度指标或波动率过滤器
- 引入多时间框架分析,确保交易方向与更高时间框架趋势一致
- 设计信号冲突的优先级处理机制,明确在信号冲突时应遵循哪种信号
- 实施动态参数优化,根据市场条件自适应调整参数
策略优化方向
-
信号确认机制强化:
- 增加交易量确认,要求突破信号伴随交易量增加
- 添加RSI或MACD等动量指标作为辅助确认
- 引入波动率阈值,在低波动率环境下提高信号触发门槛
-
风险管理机制完善:
- 实现基于ATR的动态止损设置
- 添加部分利润锁定机制
- 设计资金管理模块,根据信号强度和市场波动性动态调整仓位大小
-
时间框架协调性:
- 引入多时间框架分析,确保交易方向与更高级别趋势一致
- 开发时间过滤器,避免在市场开盘和收盘前的波动期间交易
-
信号质量评估:
- 开发信号质量评分系统,综合考虑突破强度、云层厚度、价格与云层距离等因素
- 根据信号质量评分动态调整仓位大小
-
参数自适应优化:
- 实现基于市场波动率的动态参数调整
- 开发机器学习模块,根据历史市场数据优化参数组合
这些优化方向旨在提高策略的稳健性、适应性和风险调整后的回报率。特别是通过引入多层次的信号确认机制和动态风险管理,可以显著提升策略在不同市场环境下的表现。
总结
动态云层突破量化交易策略是一种基于一目均衡云层突破和移动平均线交叉的趋势跟踪系统。其核心优势在于结合了两种不同的技术指标体系,提供了多维度的趋势确认机制。策略通过监测价格与云层的关系以及移动平均线的交叉情况,识别潜在的趋势性机会。
尽管该策略具有信号直观、适应性强等优点,但也面临信号滞后、参数敏感等挑战。通过加强信号确认机制、完善风险管理系统、引入多时间框架分析以及实现参数自适应优化,可以显著提升策略的整体表现。
对于交易者而言,该策略最适合用于中长期趋势明显的市场环境,并应将其视为完整交易系统的一部分,而非独立使用的单一指标。结合合理的资金管理和风险控制,动态云层突破策略有潜力成为一套稳健的量化交易工具。 ||
Overview
The Dynamic Kumo Breakout Quantitative Trading Strategy is a quantitative trading system based on technical market analysis, primarily leveraging the Japanese candlestick technique known as the "Ichimoku" indicator system, with a special focus on cloud (Kumo) breakout signals. The strategy monitors the breakout relationship between price and the upper boundary of the cloud, identifying potential strong breakout trends, while combining moving average crossovers to confirm trading signals, forming a complete trend-following trading system. The strategy is designed to capture sustainable breakout market conditions and is particularly suitable for markets with significant volatility.
Strategy Principles
The core principles of this strategy are built on the cloud structure of the Ichimoku indicator and the crossover logic of simple moving averages. The specific implementation process is as follows:
-
Ichimoku Indicator Calculation:
- Tenkan-Sen (Conversion Line): Average of the highest high and lowest low over the past 9 periods
- Kijun-Sen (Base Line): Average of the highest high and lowest low over the past 26 periods
- Senkou Span A (Leading Span A): Average of the Tenkan-Sen and Kijun-Sen
- Senkou Span B (Leading Span B): Average of the highest high and lowest low over the past 52 periods
- Cloud Top: The greater value between Senkou Span A and Senkou Span B
- Cloud Bottom: The lesser value between Senkou Span A and Senkou Span B
-
Signal Generation Logic:
- Long Signal: Closing price breaks above the cloud top (close crossover cloudTop)
- Short Signal: 14-period simple moving average crosses below the 28-period simple moving average (SMA(14) crossunder SMA(28))
- Long Exit Signal: Closing price breaks below the cloud bottom (close crossunder cloudBottom)
The strategy effectively combines two different signal systems: Ichimoku cloud breakouts for long entries and exits, while simple moving average crossovers are used for short entries. This combination design aims to fully utilize the characteristics of the cloud as support and resistance, while providing additional trend confirmation through moving average crossovers.
Strategy Advantages
-
Multi-dimensional Trend Confirmation: By using two different indicator systems - cloud breakouts and moving average crossovers - to confirm trends, the risk of false breakouts is reduced.
-
Dynamic Support and Resistance Identification: The cloud structure of Ichimoku provides dynamic support and resistance zones, which adapt better to market changes compared to fixed value support and resistance levels.
-
Trend Strength Assessment: The thickness of the cloud and the decisiveness of price breaking through the cloud can indirectly reflect the strength of the trend, helping traders assess potential trend sustainability.
-
Visual Intuitiveness: The strategy's signals are visually intuitive on charts, with clear cloud formation changes and price breakout points, making it easy for traders to understand and operate.
-
Strong Adaptability: Through parameter adjustments (such as the period lengths of Tenkan-Sen, Kijun-Sen, and Senkou Span B), the strategy can adapt to different market environments and time frames.
Strategy Risks
-
Volatility Risk within Cloud Region: When prices fluctuate within the cloud region, frequent crossover signals may occur, leading to overtrading and unnecessary transaction costs.
-
Signal Lag: Due to the calculation of the Ichimoku indicator involving longer periods (such as the 52-period Senkou Span B), signals may have a certain lag, potentially missing optimal entry points in rapidly reversing markets.
-
Parameter Sensitivity: The strategy is sensitive to parameter settings, with different parameter combinations potentially producing significantly different trading results, requiring optimization for specific trading instruments and market environments.
-
Single Timeframe Limitation: The code does not consider multi-timeframe analysis, which may lead to generating incorrect signals contrary to the main trend in the larger trend context.
-
Insufficient Handling of Signal Conflicts: When cloud breakout signals conflict with moving average crossover signals, the code does not provide a clear handling mechanism, potentially leading to inconsistent strategy behavior.
Solutions:
- Add additional filtering conditions, such as volume confirmation, trend strength indicators, or volatility filters
- Introduce multi-timeframe analysis to ensure trading direction aligns with higher timeframe trends
- Design priority handling mechanisms for signal conflicts, clarifying which signals to follow when conflicts occur
- Implement dynamic parameter optimization, adaptively adjusting parameters based on market conditions
Strategy Optimization Directions
-
Strengthening Signal Confirmation Mechanism:
- Add volume confirmation, requiring breakout signals to be accompanied by increased trading volume
- Add momentum indicators like RSI or MACD as auxiliary confirmation
- Introduce volatility thresholds, raising signal triggering thresholds in low-volatility environments
-
Improving Risk Management Mechanism:
- Implement dynamic stop-loss settings based on ATR
- Add partial profit locking mechanisms
- Design a capital management module to dynamically adjust position sizes based on signal strength and market volatility
-
Timeframe Coordination:
- Introduce multi-timeframe analysis to ensure trading direction aligns with higher-level trends
- Develop time filters to avoid trading during volatile periods around market openings and closings
-
Signal Quality Assessment:
- Develop a signal quality scoring system, comprehensively considering breakout strength, cloud thickness, distance between price and cloud, etc.
- Dynamically adjust position sizes based on signal quality scores
-
Parameter Adaptive Optimization:
- Implement dynamic parameter adjustments based on market volatility
- Develop machine learning modules to optimize parameter combinations based on historical market data
These optimization directions aim to improve the robustness, adaptability, and risk-adjusted returns of the strategy. In particular, introducing multi-level signal confirmation mechanisms and dynamic risk management can significantly enhance the strategy's performance in different market environments.
Conclusion
The Dynamic Kumo Breakout Quantitative Trading Strategy is a trend-following system based on Ichimoku cloud breakouts and moving average crossovers. Its core advantage lies in combining two different technical indicator systems, providing multi-dimensional trend confirmation mechanisms. The strategy identifies potential trend opportunities by monitoring the relationship between price and the cloud, as well as moving average crossovers.
Although the strategy has advantages such as intuitive signals and strong adaptability, it also faces challenges like signal lag and parameter sensitivity. By strengthening signal confirmation mechanisms, improving risk management systems, introducing multi-timeframe analysis, and implementing parameter adaptive optimization, the overall performance of the strategy can be significantly enhanced.
For traders, this strategy is most suitable for markets with obvious medium to long-term trends and should be viewed as part of a complete trading system rather than a single indicator used independently. Combined with reasonable capital management and risk control, the Dynamic Kumo Breakout Strategy has the potential to become a robust quantitative trading tool.[/trans]
Source (PineScript)
/*backtest
start: 2024-03-28 00:00:00
end: 2025-03-27 00:00:00
period: 1h
basePeriod: 1h
exchanges: [{"eid":"Futures_Binance","currency":"ETH_USDT"}]
*/

// This Pine Script™ code is subject to the terms of the Mozilla Public License 2.0 at https://mozilla.org/MPL/2.0/
// © SwissyTrader

//@version=6
strategy("KumoBreakLong", overlay=true, fill_orders_on_standard_ohlc=true)

//=== Parameters ===//
lenTenkan = input.int(9, title="Tenkan-Sen (Conversion Line) Length")
lenKijun  = input.int(26, title="Kijun-Sen (Base Line) Length")
lenSenkou = input.int(52, title="Senkou Span B Length")

//=== Ichimoku Calculation ===//
// Tenkan-Sen (Conversion Line)
tenkan = (ta.highest(high, lenTenkan) + ta.lowest(low, lenTenkan)) / 2
// Kijun-Sen (Base Line)
kijun  = (ta.highest(high, lenKijun) + ta.lowest(low, lenKijun)) / 2
// Senkou Span A (Leading Span A)
senkouA = (tenkan + kijun) / 2
// Senkou Span B (Leading Span B)
senkouB = (ta.highest(high, lenSenkou) + ta.lowest(low, lenSenkou)) / 2

// Current "Kumo" Boundaries
cloudTop    = math.max(senkouA, senkouB)  // Upper cloud boundary
cloudBottom = math.min(senkouA, senkouB)  // Lower cloud boundary

//=== Signals ===//
// Long condition: Price crosses above the Kumo cloud
longCondition = ta.crossover(close, cloudTop)

// Exit condition: Price crosses below the lower cloud boundary
exitCondition = ta.crossunder(close, cloudBottom)

//=== Position Triggers ===//

//longCondition = ta.crossover(ta.sma(close, 14), ta.sma(close, 28))
if (longCondition)
    strategy.entry("Long", strategy.long)

shortCondition = ta.crossunder(ta.sma(close, 14), ta.sma(close, 28))
if (shortCondition)
    strategy.entry("Short", strategy.short)
Detail
https://www.fmz.com/strategy/488518
Last Modified
2025-03-28 15:16:43