
258 lines
9.8 KiB
Markdown
258 lines
9.8 KiB
Markdown
|
|
> Name
|
|
|
|
动态买卖量波动突破策略Dynamic-Buying-Selling-Volume-Breakout-Strategy
|
|
|
|
> Author
|
|
|
|
ChaoZhang
|
|
|
|
> Strategy Description
|
|
|
|
|
|
|
|
[trans]
|
|
|
|
## 概述
|
|
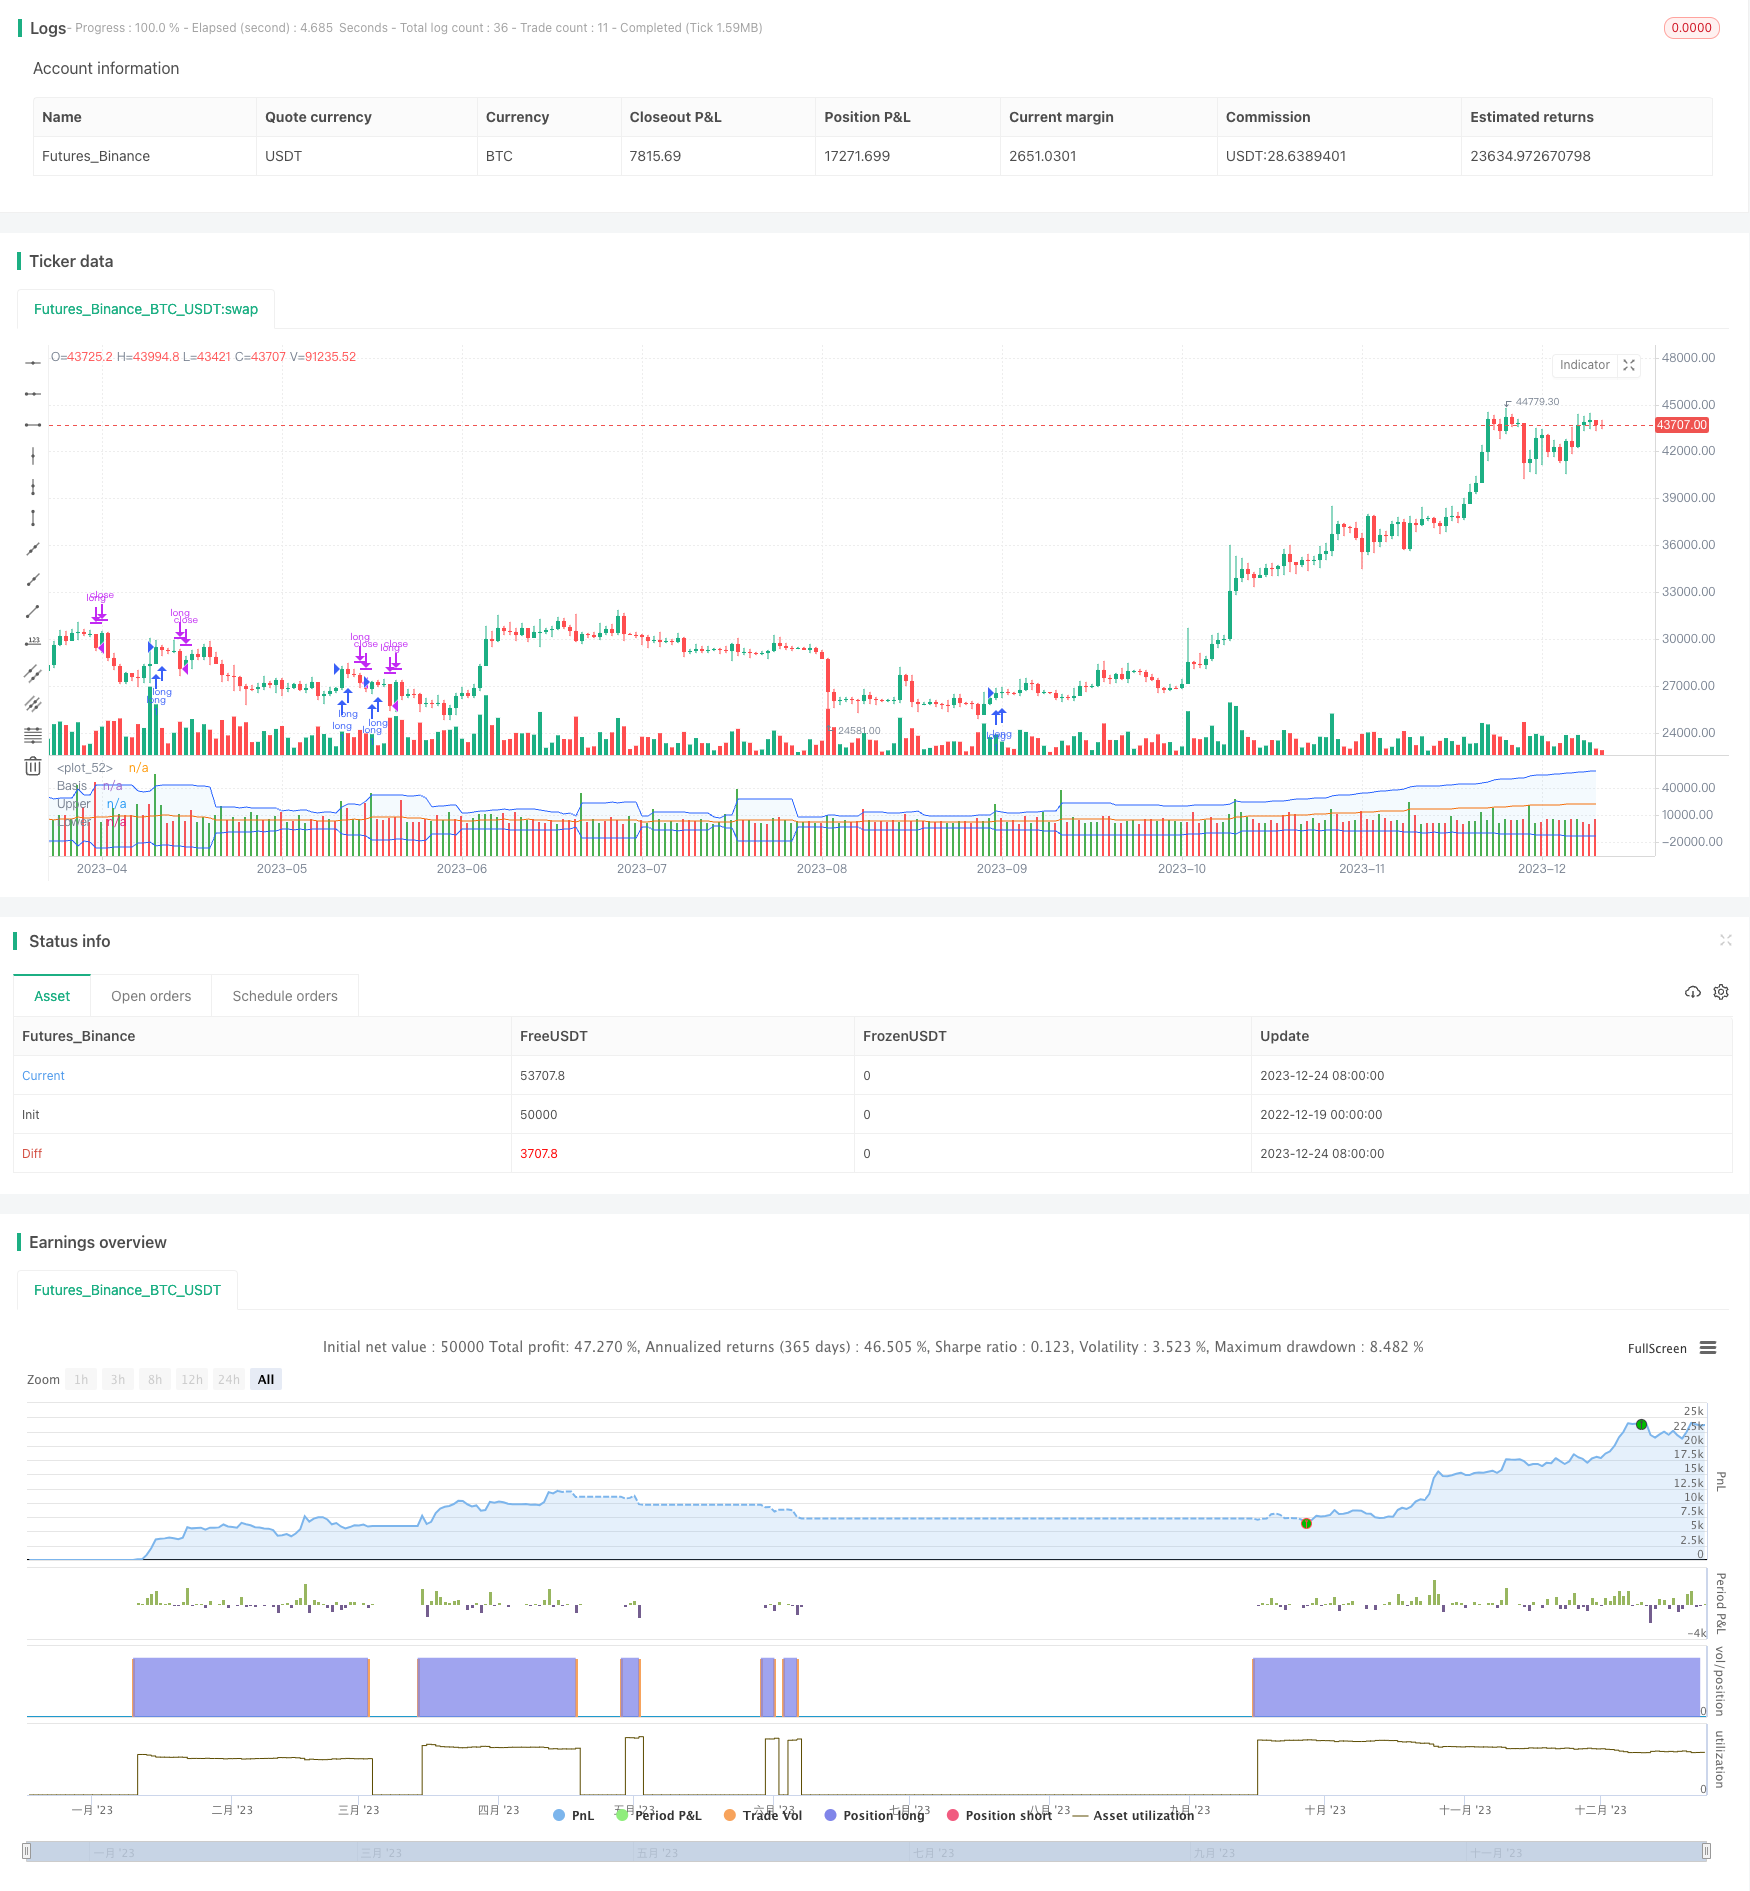
本策略通过自定义时间周期的买卖量进行多空判断,结合周线VWAP、布林带进行过滤,实现高概率的趋势追踪。同时引入动态止盈止损机制,能有效控制单边风险。
|
|
|
|
## 策略原理
|
|
1. 计算自定义时间周期内的买卖量指标
|
|
- BV:买量,通过低点买入造成的量
|
|
- SV:卖量,通过高点卖出造成的量
|
|
2. 对买卖量进行处理
|
|
- 利用20周期EMA进行平滑
|
|
- 对处理后的买卖量进行正负分离
|
|
3. 判断指标方向
|
|
- 指标大于0为看涨,小于0为看跌
|
|
4. 结合周线VWAP、布林带判断背离
|
|
- 价格在VWAP之上且指标看涨为做多信号
|
|
- 价格在VWAP之下且指标看跌为做空信号
|
|
5. 动态止盈止损
|
|
- 按日ATR设置止盈止损百分比
|
|
|
|
## 策略优势
|
|
1. 买卖量能反映市场真实动力,捕捉趋势潜在能量
|
|
2. 周线VWAP判断大周期趋势方向,布林带判断突破信号
|
|
3. 动态ATR设置止盈止损,能最大限度锁定利润,避免超调
|
|
|
|
## 策略风险
|
|
1. 买卖量数据存在一定误差,可能导致判断失误
|
|
2. 单一指标结合判断,容易产生误信号
|
|
3. 布林带 Parameter设置不当,会缩小有效突破
|
|
|
|
## 策略优化方向
|
|
1. 多时间周期买卖量指标进行优化
|
|
2. 增加交易量等辅助指标进行过滤
|
|
3. 动态调整布林带 Parameter,提高突破效率
|
|
|
|
## 总结
|
|
本策略充分利用买卖量的预测性,辅以VWAP和布林带产生高概率信号,通过动态止盈止损有效控制风险,是一种高效稳定的量化交易策略。随着参数及规则的不断优化,预计效果会更加明显。
|
|
|
|
||
|
|
|
|
## Overview
|
|
This strategy determines long and short through customized timeframe buying and selling volume, combined with weekly VWAP and Bollinger Bands for filtering, to realize high probability trend tracking. It also introduces dynamic take profit and stop loss mechanism to effectively control one-sided risk.
|
|
|
|
## Strategy Principle
|
|
1. Calculate buying and selling volume indicators within customized timeframe
|
|
- BV: Buying volume, caused by buying at low point
|
|
- SV: Selling volume, caused by selling at high point
|
|
2. Process buying and selling volume
|
|
- Smooth by 20-period EMA
|
|
- Separate processed buying and selling volume into positive and negative
|
|
3. Judge indicator direction
|
|
- Greater than 0 is bullish, less than 0 is bearish
|
|
4. Determine divergence combined with weekly VWAP and Bollinger Bands
|
|
- Price above VWAP and indicator bullish is long signal
|
|
- Price below VWAP and indicator bearish is short signal
|
|
5. Dynamic take profit and stop loss
|
|
- Set percentage of take profit and stop loss based on daily ATR
|
|
|
|
## Advantages
|
|
1. Buying and selling volume reflects real market momentum, captures potential energy of trends
|
|
2. Weekly VWAP judges longer timeframe trend direction, Bollinger Bands determine breakout signals
|
|
3. Dynamic ATR sets take profit and stop loss, maximizes profit locking and avoids overtuning
|
|
|
|
## Risks
|
|
1. Buying and selling volume data has certain errors, may cause misjudgement
|
|
2. Single indicator combined judgement tends to generate false signals
|
|
3. Improper Bollinger Bands parameter settings narrow down valid breakouts
|
|
|
|
## Optimization Directions
|
|
1. Optimize with multiple timeframe buying and selling volume indicators
|
|
2. Add trading volume and other auxiliary indicators for filtering
|
|
3. Dynamically adjust Bollinger Bands parameters to improve breakout efficiency
|
|
|
|
## Conclusion
|
|
This strategy makes full use of the predictability of buying and selling volume, generating high probability signals supplemented by VWAP and Bollinger Bands, while effectively controlling risk through dynamic take profit and stop loss. As parameters and rules continue to be optimized, performance is expected to become more significant.
|
|
[/trans]
|
|
|
|
> Strategy Arguments
|
|
|
|
|
|
|
|
|Argument|Default|Description|
|
|
|----|----|----|
|
|
|v_input_timeframe_1|60|(?Entry Settings)customTimeframe|
|
|
|v_input_bool_1|true|allow_long|
|
|
|v_input_bool_2|false|allow_short|
|
|
|v_input_int_1|20|(?Volatility Settings)length|
|
|
|v_input_float_1|2|StdDev|
|
|
|v_input_float_2|100|(?Dynamic Risk Management)TP Multiplier for Long entries |
|
|
|v_input_float_3|true|SL Multiplier for Long entries|
|
|
|v_input_float_4|100|TP Multiplier for Short entries |
|
|
|v_input_float_5|5|SL Multiplier for Short entries|
|
|
|
|
|
|
> Source (PineScript)
|
|
|
|
``` pinescript
|
|
/*backtest
|
|
start: 2022-12-19 00:00:00
|
|
end: 2023-12-25 00:00:00
|
|
period: 1d
|
|
basePeriod: 1h
|
|
exchanges: [{"eid":"Futures_Binance","currency":"BTC_USDT"}]
|
|
*/
|
|
|
|
// This source code is subject to the terms of the Mozilla Public License 2.0 at https://mozilla.org/MPL/2.0/
|
|
// © original author ceyhun
|
|
//@ exlux99 update
|
|
|
|
//@version=5
|
|
strategy('Buying Selling Volume Strategy', format=format.volume, precision=0, overlay=false)
|
|
|
|
weekly_vwap = request.security(syminfo.tickerid, "W", ta.vwap(hlc3))
|
|
|
|
vi = false
|
|
customTimeframe = input.timeframe("60", group="Entry Settings")
|
|
|
|
allow_long = input.bool(true, group="Entry Settings")
|
|
allow_short = input.bool(false, group="Entry Settings")
|
|
|
|
xVolume = request.security(syminfo.tickerid, customTimeframe, volume)
|
|
xHigh = request.security(syminfo.tickerid, customTimeframe, high)
|
|
xLow = request.security(syminfo.tickerid, customTimeframe, low)
|
|
xClose = request.security(syminfo.tickerid, customTimeframe, close)
|
|
|
|
BV = xHigh == xLow ? 0 : xVolume * (xClose - xLow) / (xHigh - xLow)
|
|
SV = xHigh == xLow ? 0 : xVolume * (xHigh - xClose) / (xHigh - xLow)
|
|
|
|
vol = xVolume > 0 ? xVolume : 1
|
|
TP = BV + SV
|
|
BPV = BV / TP * vol
|
|
SPV = SV / TP * vol
|
|
TPV = BPV + SPV
|
|
|
|
tavol20 = request.security(syminfo.tickerid, customTimeframe, ta.ema(vol, 20))
|
|
tabv20= request.security(syminfo.tickerid, customTimeframe, ta.ema(BV, 20))
|
|
tasv20= request.security(syminfo.tickerid, customTimeframe, ta.ema(SV, 20))
|
|
VN = vol / tavol20
|
|
BPN = BV / tabv20 * VN * 100
|
|
SPN = SV / tasv20 * VN * 100
|
|
TPN = BPN + SPN
|
|
|
|
xbvp = request.security(syminfo.tickerid, customTimeframe,-math.abs(BPV))
|
|
xbpn = request.security(syminfo.tickerid, customTimeframe,-math.abs(BPN))
|
|
xspv = request.security(syminfo.tickerid, customTimeframe,-math.abs(SPV))
|
|
xspn = request.security(syminfo.tickerid, customTimeframe,-math.abs(SPN))
|
|
|
|
BPc1 = BPV > SPV ? BPV : xbvp
|
|
BPc2 = BPN > SPN ? BPN : xbpn
|
|
SPc1 = SPV > BPV ? SPV : xspv
|
|
SPc2 = SPN > BPN ? SPN : xspn
|
|
BPcon = vi ? BPc2 : BPc1
|
|
SPcon = vi ? SPc2 : SPc1
|
|
|
|
|
|
minus = BPcon + SPcon
|
|
plot(minus, color = BPcon > SPcon ? color.green : color.red , style=plot.style_columns)
|
|
|
|
length = input.int(20, minval=1, group="Volatility Settings")
|
|
src = minus//input(close, title="Source")
|
|
mult = input.float(2.0, minval=0.001, maxval=50, title="StdDev", group="Volatility Settings")
|
|
xtasma = request.security(syminfo.tickerid, customTimeframe, ta.sma(src, length))
|
|
xstdev = request.security(syminfo.tickerid, customTimeframe, ta.stdev(src, length))
|
|
basis = xtasma
|
|
dev = mult * xstdev
|
|
upper = basis + dev
|
|
lower = basis - dev
|
|
plot(basis, "Basis", color=#FF6D00, offset = 0)
|
|
p1 = plot(upper, "Upper", color=#2962FF, offset = 0)
|
|
p2 = plot(lower, "Lower", color=#2962FF, offset = 0)
|
|
fill(p1, p2, title = "Background", color=color.rgb(33, 150, 243, 95))
|
|
|
|
// Original a
|
|
longOriginal = minus > upper and BPcon > SPcon and close > weekly_vwap
|
|
shortOriginal = minus > upper and BPcon < SPcon and close< weekly_vwap
|
|
|
|
|
|
|
|
high_daily = request.security(syminfo.tickerid, "D", high)
|
|
low_daily = request.security(syminfo.tickerid, "D", low)
|
|
close_daily = request.security(syminfo.tickerid, "D", close)
|
|
|
|
true_range = math.max(high_daily - low_daily, math.abs(high_daily - close_daily[1]), math.abs(low_daily - close_daily[1]))
|
|
atr_range = ta.sma(true_range*100/request.security(syminfo.tickerid, "D", close), 14)
|
|
|
|
ProfitTarget_Percent_long = input.float(100.0, title='TP Multiplier for Long entries ', step=0.5, step=0.5, group='Dynamic Risk Management')
|
|
Profit_Ticks_long = close + (close * (atr_range * ProfitTarget_Percent_long))/100
|
|
LossTarget_Percent_long = input.float(1.0, title='SL Multiplier for Long entries', step=0.5, group='Dynamic Risk Management')
|
|
Loss_Ticks_long = close - (close * (atr_range * LossTarget_Percent_long ))/100
|
|
|
|
ProfitTarget_Percent_short = input.float(100.0, title='TP Multiplier for Short entries ', step=0.5, step=0.5, group='Dynamic Risk Management')
|
|
Profit_Ticks_short = close - (close * (atr_range*ProfitTarget_Percent_short))/100
|
|
LossTarget_Percent_short = input.float(5.0, title='SL Multiplier for Short entries', step=0.5, group='Dynamic Risk Management')
|
|
Loss_Ticks_short = close + (close * (atr_range*LossTarget_Percent_short))/100
|
|
|
|
|
|
|
|
var longOpened_original = false
|
|
var int timeOfBuyLong = na
|
|
var float tpLong_long_original = na
|
|
var float slLong_long_original = na
|
|
long_entryx = longOriginal
|
|
|
|
longEntry_original = long_entryx and not longOpened_original
|
|
|
|
|
|
if longEntry_original
|
|
longOpened_original := true
|
|
tpLong_long_original := Profit_Ticks_long
|
|
slLong_long_original := Loss_Ticks_long
|
|
timeOfBuyLong := time
|
|
//lowest_low_var_sl := lowest_low
|
|
|
|
|
|
tpLong_trigger = longOpened_original[1] and ((close > tpLong_long_original) or (high > tpLong_long_original)) //or high > lowest_low_var_tp
|
|
slLong_Trigger = longOpened_original[1] and ((close < slLong_long_original) or (low < slLong_long_original)) //or low < lowest_low_var_sl
|
|
|
|
longExitSignal_original = shortOriginal or tpLong_trigger or slLong_Trigger
|
|
|
|
|
|
if(longExitSignal_original)
|
|
longOpened_original := false
|
|
tpLong_long_original := na
|
|
slLong_long_original := na
|
|
|
|
|
|
if(allow_long)
|
|
strategy.entry("long", strategy.long, when=longOriginal)
|
|
strategy.close("long", when= longExitSignal_original) //or shortNew
|
|
|
|
if(allow_short)
|
|
strategy.entry("short", strategy.short, when=shortOriginal )
|
|
strategy.close("short", when= longOriginal) //or shortNew
|
|
|
|
|
|
```
|
|
|
|
> Detail
|
|
|
|
https://www.fmz.com/strategy/436608
|
|
|
|
> Last Modified
|
|
|
|
2023-12-26 11:15:31
|